SNX breaks its historical record amount in 2021!SNX is in an increasing channel and there is a very strong resistance line around 11.5 for SNX. If can break this level upward with a strong candle, it easily reaches 12.6 which is the FIBO 0.618. Besides, the MA50 brock the MA100 that is a very good signal for SNX, and also the trend line for the RSI is in a very good increasing position. I think 14 price is not too far and the main goal of this token is reaching 16 in 2021!
SNXUSDT trade ideas

SNX USD Nice looking chartIt's look good. I think it will be touch $50 but for long term. Maybe it can move within the channel for the time being.

Next SNXUSDT wave (looking bullish to me)Let me know what do you think of this
I think it might blow up if it manages to properly break the trendline resistance


It can't get better than thisAfter the correction the cryptomarket suffered, $snx is one of the coins that didn't recover yet.
It has been consolidating since it broke the first trendline.
A fundamentally strong project with an excelent R:R and an incredible future.
As a long-term investor in crypto, this chart is just stunning.
I don't see how it can better than this.
Hope you enjoy <3

BO Plan SNXThis is my first trading plan, hope i can help you make desicion.
SNX is Breakout in 1D TF, hope the BO target HIT!

SNXUSDTHello to all dear traders, I hope you always hunt for big profits.
DISCLAIMER:
This is not financial advice! This is an opinion-based show. I am not a financial adviser. Please only invest what you can afford to lose, and we encourage you to do your own research before investing.
everyone should buy and sell according to their own strategy.
Everything you need to know is outlined in the chart and keep in mind that we are moving forward with probabilities and the analysis may be wrong so take capital management seriously.
The time to buy SNX is almost nowAfter a year long downtrend snx is starting to show signs of a reversal. The price has been respecting the downwards channel and has been unable to break its resistance line.
But.. it looks like it might be starting to wake up. We have had a bounce again from a strong area of support and the price has made a higher low.
I suspect we might be starting to form a new upwards channel as indicated by the black lines, break of the old downwards channel would be confirmation.
For an aggressive entry daily close above the 200ema with a bullish candle with some volume would be required. Otherwise wait for a break of the downwards channel.
I will be entering in both places and looking for at least a 2x before selling. Breakout on this could be very decent given how long its been consolidating and how the OBV has been going upwards in the meantime.

SNX, time for investmentThe weekly time frame for SNX indicates a high potential for growth in the next couple of months. HODL SNX since nearly many altcoins reached their previous ATH and it's time for those who didn't move yet.
Good luck


SNX Weekly Potential Explosion aheadWell in the weekly charts It has very similar situation to the last time that it broke a trend and raise to 800% ant then came down for price correction.
I see the same potential, at least in long term Condition, Dramatically Target will be 86 or maybe 100$ as shadow but less Fantasy targets are resistance levels that are obvious in the chart 20$-30$;
This is not a financial advice for selling or buying at all. Just a technical analysis.

SNX/USDTSNX forming a rounded bottom on the daily chart underneath resistance of $10.70. Measured move of 22.5% upon confirmation of breaking resistance sends it towards resistance of $13 which will also coincide with an attempted breakout from the macro downtrend line SNX has had since it's ATH in February. RSI has also broke resistance and above 50..

It’s going to get interesting very SOONThis chart looks really good to me:
After reaching the all time high, price made some lower highs and as it was unable to creat a new higher high it dropped heavily and the market sentiment changed from bullish to bearish.
The last bullish correction got rejected and retreated to the 618 fibonacci level,
And we are currently trading above this level.
We are holding well and the accumulation phase is lasting for about 2 months now.
I think $SNX is ready to start a new bullish trend and it will happen this week.
First target should be around $14 and I will wait and see the reaction of the market after that.
Stay tuned and follow me on tradingview to get notified of the next step.
Cryptosep ;)

#5 | Synthetix Network Token vs Tether (SNXUSDT)I had multiple options for the last pair to share with you today, I found many mentioned in the comments section that looked good.
These were CAKEUSDT and BZRXUSDT, I went for Synthetix Network Token (SNXUSDT) since we already have a trade active for this one.
To spot these bullish charts, the Fibs can be very useful/important.
Notice here how bullish action takes place above the 0.382 Fib. extension level, this is marked light blue.
Each Fib. level here below the current price can be considered strong support.
Above the current price, I call these resistance levels or targets.
Since we have kind of a curve coming up from the candles, yes, I look at that... This can signal that things are about to move up.
We have this curve pattern showing up, with increasing volume, bullish indicators, and prices breaking above EMA50... The rest is on the chart.
Namaste.

SNX ab=cd pattern to $40#SNXUSDT
$SNX broke out from descending resistance line and head up to break the long term one that is the same with a resistance zone. if bulls success to close a weekly candle above resistance zone price will head up to touch $19.
an AB=CD pattern can complete around $40.
if price break down from ascending support this bullish scenario will be invalid.

snx big bullish move wave 3 is on the move and i show two paths that have high Possibility of chart movement
so buy and hold that for next 3 month

SnxSupport 9.50 resiatnc 10$ tarhet 12$ small trade but if volume
Steps in it could go on a higher run… symetrical triangle extremely tight range.

Synthetix Price AnalysisSynthetix currently finding support on a long term macro trend line with 3 previous touches of support after it found as resistance in the past.

SNX Looking READY for Liftoff #SynthetixOn the daily charts I noticed that it appears that SNX could be forming one of the largest bull flags I've ever seen. This is not trading advice, but I'm personally long on SNX since it has yet to mark up and return to it's ATH this cycle leaving plenty of potential for gains. It's very possible that it could consolidate to gain momentum for a little longer, but eventually, SNX is going to melt faces. Additionally, Sythentix Network is an awesome project with plenty of support on the fundamental level.
Best of luck on your trades and please don't risk anything you can't afford to lose (especially your sanity).

SNX LONG POSITON 10/26/2021BINANCE:SNXUSDT
Price consolidating looking to go long in q4. charts are meant to be guidelines. trade at your own risk.

SNX / USDTfrom the perspective of Short term trade setup
Its on the verge of flipping EMA 99 to support and a move to 13$ looks likely
$crv $rune so far leading the #Defi
The lagging ones will catch up soon

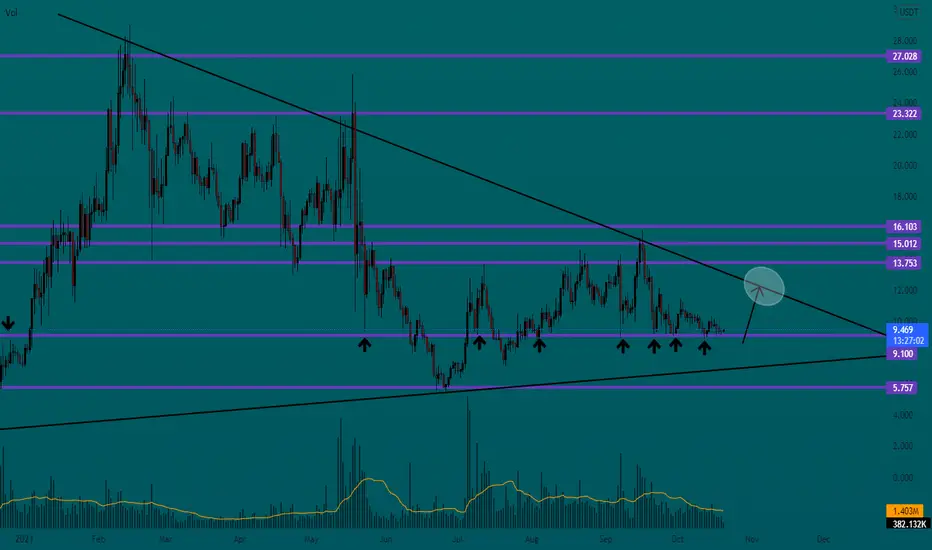
#SNXUSDT (Watchlist) 10/21#SNXUSDT maybe worth it to add this coin to your Watchlist. 👀
Pree "like button" and leaving your "comments" below our ideas is a great thing and supports us to providing more ideas.❤️ (Share it with your folks)
Everything mentioned on the chart (Pattern/Resistance/Support / Breakout/Breadkwon levels, Also R: R)
add to watchlist means the coin we mentioned is forming a pattern or moving near a historical bottom, around or above good support, increase in trading volume , showing a reversal candle, accumulation stage, etc, but no reaction from bulls, so we inform you to add it to your watchlist until the right time for entry.!!
Ps:
we avoid trading any coin if the entire project for it is based on gambling, prostitution, human trafficking, borrowing, and lending, etc.
This is not financial advice, The purpose of these Charts is to give you an idea about coin movement (not buy or sell signal) so before following any idea be sure to do your own research, and follow your risk management. the Cryptocurrency market is very volatile and involves gains and losses as well so know very well what you are heading towards before engaging in it.
The information we mentioned here is a personal effort that is subject to success or failure and we welcome constructive criticism.
Good luck to All.
🙏we ask Allah reconcile and repay🙏

Snx Chart Analysis #SNX USDT 4H Chart SIGNAL by Sajjat Hossen
This Is Risky Call Because Of Bitcoin. ⚠️
Entry ✅ If 4H Candle Close Above $10.09
Stop-loss ❌ If 4H Candle Close Below The $9.20
