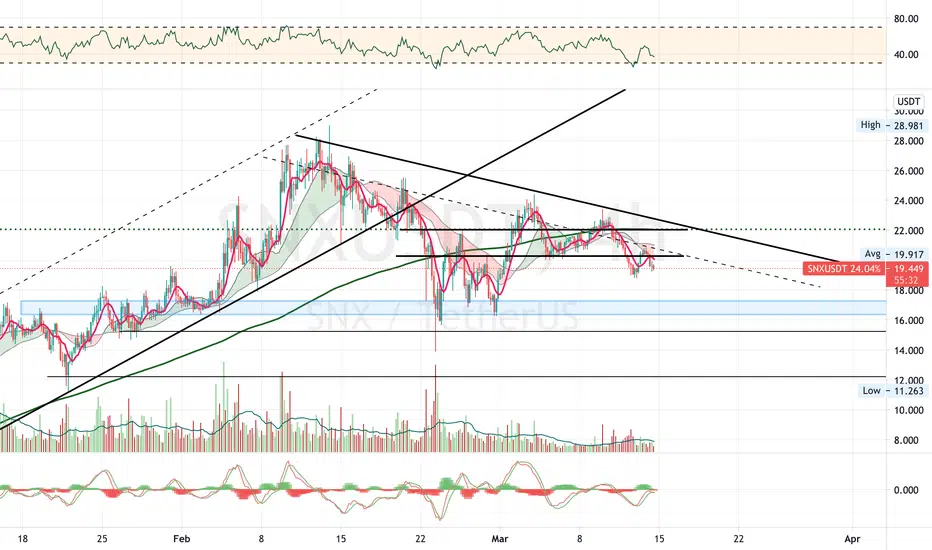
SNX/USD - Get ready for $30 soon! 🚀🚀🚀SNX is looking sexy. This chart is primed for some nice explosion to the upside (see yellow arrows):
MACD = bullish
RSI = bullish
Volume = bullish
Once we break out of this triangle, the game is on! Make sure you set and alert!
Bias is very much bullish on this chart and provided BTC and ETH don't ruin the fun, we should go higher pretty soon.
Market for alts is getting hot, especially now that BTC dominance has cracked under 60%... you know what that means right? Check my BTC Dominance chart below to find out. :)
Like and follow if you liked this idea! Also join my crypto community to stay in touch!
SNXUSDT trade ideas

SNX bullish pattern and targetsSNX has a big triangle and was in a correction for a long enough time. I consider two targets for it showed by orange short-lines. Stop-loss for the short target is marked and for the next target, we could use the bellow green line as a stop-loss point.


SNX just triggered for a solid bounce play off the lower rangeSNXUSDT just triggered for a possible good risk conscious trade off the lower range. With crypto on whole in a massive bull market bounces off the lower range have been super high probability trades with large returns really quickly. A potential trade could be a buy here with a target up into the 19.50 range. We are trading this long in our live account.

Alt Season is COMING !Creating this decreasing triangle at the end of an uptrend can be a sign that the trend is continuing

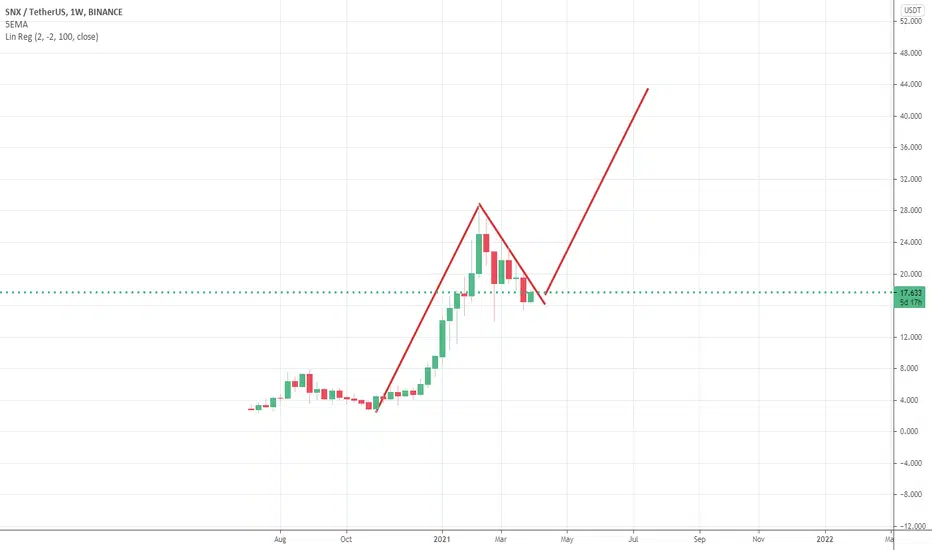
Synthetix Bull_FlagDear traders,
Synthetix has made a bull-flag on the chart.
target is $44
Good Trading,
Hans
Synthetix My next entry on Synthetix, to be safe will Be btw 16 and 17$
My TP are the next ones:
TP1: 20,25
TP2: 24,63
TP3: 28,83
For a total arround 65%

SNX Making a run soonOne of the only assets showing Classic Bullish Divergence (Class A Reversal) on the daily.Looks perfect to go. On the hourly we have a double bottom which can hint a powerful move to the upside. The stop loss is strategically setup to be below the daily engulifing candle.


More AccumulationAfter falling from the ascending channel at the end of Feb, I thought it would climb back up into the channel on Mar09, indicated by the 2 blue arrows, but alas, like my ADA plan, this is going equally splendidly.
In a sideways “accumulating” movement (translate, don’t sell at a loss), it has formed a bullish descending flag. Looking at the MacD day timeframe, it looks like a continued “accumulation” till a breakout and a positive green day MacD.
My thoughts, not advice Oklah. Cheers

SNXQuick chart for a sunday morning.'Small' coin buying zone.If we can buy here we could get nice profit.:) Cheers

SNXUSDT n SUSHIUSDT at tricky spotsshe needs to hold this level or we could see a re trace down to 15.00usd which if she breaks breaks get out for a bit and scoop the dips
ETH and ESP BTC pairs r beating up snx sushi and few other alts so great time to start to pick spots for next run but maybe not so spread out ( talking to all u 5 to 10 plus alt junkies out there smilez
_HGM


SNX (Synthetix) Token Analysis 24/03/2021 Updatedas we can see the price has fallen to the trend line and has some good chances of getting bounced from the Retracement and support zones
targets are the same as the past analysis

Synthetix Network Token (SNX) - March 24Hello?
Dear traders, nice to meet you.
By "following" you can always get new information quickly.
Please also click "Like".
Have a good day.
-------------------------------------------------- -----
We have to see if we can get support and climb at 16.809.
As such, we need to see if there is any movement to move sideways at 16.809 or break off the downtrend line.
If you go down at 16.809, you can touch 13.222, so you need a Stop Loss to preserve profit or loss.
In order to turn to the uptrend line, it must rise to the 20.397-21.592 section and receive support.
As the OBV on the volume indicator increases green, it remains to be seen if the center line can rise.
It remains to be seen if the CCI line can rise above 100 on the CCI-RC indicator.
---------------------------------------
(SNXBTC 1D chart)
We need to see if it can rise along the uptrend line (1).
In particular, it remains to be seen if the volatility around March 26 could increase more than 3280 Satoshi.
In order to turn to an uptrend, you must get off the downtrend line.
-------------------------------------------------- -------------------------------------------
** All indicators are lagging indicators.
So, it's important to be aware that the indicator moves accordingly with the movement of price and volume.
Just for the sake of convenience, we are talking upside down for interpretation of the indicators.
** The wRSI_SR indicator is an indicator created by adding settings and options from the existing Stochastic RSI indicator.
Therefore, the interpretation is the same as the conventional stochastic RSI indicator. (K, D line -> R, S line)
** The OBV indicator was re-created by applying a formula to the DepthHouse Trading indicator, an indicator that oh92 disclosed. (Thank you for this.)
** Check support, resistance, and abbreviation points.
** Support or resistance is based on the closing price of the 1D chart.
** All explanations are for reference only and do not guarantee profit or loss on investment.
Explanation of abbreviations displayed on the chart
R: A point or section of resistance that requires a response to preserve profits
S-L: Stop Loss point or section
S: A point or segment that can be bought for profit generation as a support point or segment
(Short-term Stop Loss can be said to be a point where profits and losses can be preserved or additionally entered through installment transactions. It is a short-term investment perspective.)
GAP refers to the difference in prices that occurred when the stock market, CME, and BAKKT exchanges were closed because they do not trade 24 hours a day.
G1: Closing price when closed
G2: Cigar at the time of opening
(Example) Gap (G1-G2)
