SNXUSDT trade ideas


$SNX - whats nextSignificant moves by BINANCE:SNXUSDT driven by protocol decision to end token inflation - However after passing through heavy long term resistance band (Blue box) failed to take next resistance level...
Since then has been in a conjoining wedge - as fails to make headway in either direction -
How I'm trading this:
1) Watch to see declining volumes on a flattening baseline -> then either play the breakout (medium risk - higher possible returns) - or assume a retest of trend and buy a few pips north of it....

SNXUSDT Analysis: Upward Momentum Imminent!With SNXUSDT currently at $3.805, positive indicators suggest a potential upward surge. Key trends in moving averages and RSI point to favorable conditions, hinting at an upcoming bullish movement. 📈 #SNXUSDT #UpwardTrend

SNX/USDT bullish horizons from Demand Zone? 👀🚀 SNX Analysis💎 Paradisers, let’s zoom in on #SNXUSDT as it’s exhibiting a pivotal market behavior. SNX is currently nestled in a demand zone, poised for another assault on a key resistance area.
💎 #SNX recently faced a setback at the resistance level of $4.964. Presently, it's regaining strength in the demand zone. If it can maintain this upward momentum, we could see an ambitious push towards the significant resistance level at $6.006.
💎 Nonetheless, navigating the unpredictable crypto market demands flexibility in strategy. If #SNX struggles to keep above the $3.806 demand level, a strategic rethink may be required.
💎This scenario might see us anticipating a bullish recovery from a lower support at $3.227. Importantly, if NYSE:SNX slips below this crucial support, it could be a harbinger of a bearish trend.

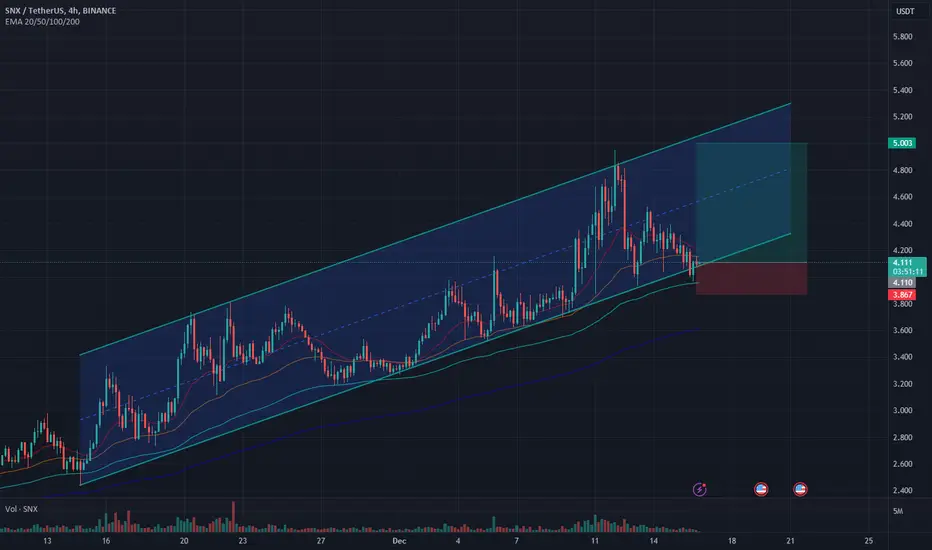
Pullback for Short PositionOn 4h TF
I see a pullback with low volume reaching up to range 4.1 - 4.3
I think this range is potential short zone
So wait for reject at this range
Time will tell

SNX LongKeep your trading simple 🚀🚀🚀
Long SNX 30Min trend continuation trade.
First target: 1:1
Exit: Trend reversal/stop
Not a financial advice just my tradingview - trade smart trade safe.
Follow me to support my work, Thanks!

🔥SNX Trying to Break 1-year Channel: What Are The Targets❓🔥SNX is the top gainer and grow for 2 months straight. Now the chart shows that SNX doesn't have enough power for the futher growth. Only the breakout of the channel and test it as the support will confirms the bull power.
Possible that price can fall to the middle of the channel. I think that it will be a good entry point in long. You need to pay attention on Bitcoin of course to make the right decision.
💥The 2 targets are on chart. Enjoy it!
like❤️ and follow

SNX testing the channel bottomIf it can get support from here, we can see a nice rise. It can be tried with a tight stop-loss. If it rises, I plan to sell half of the position at mid-channel resistance and the rest at 5. DYOR
#SNXIn the 1-hour and 4-hour timeframes, there is a concentration in a corner, which can return to the specified supply area if the dynamic trigger line is broken. If the range of the blue line is broken, you can continue the correction up to the specified area, which can correct 100% of the previous wave.

USDT/SNX BYBIT LONG 2H usdt/snx bybit long.
This is a short term trade.
When taking profit, put stop-loss up to gain even if it were to fall down.
5x-10x leverage

SNX LONG usdt/snx bybit long.
This is a short term trade.
When taking profit, put stop-loss up to gain even if it were to fall down.
5x-10x leverage

SNX longSNX bounced off the ascending trendline and bounced off the support level. Bullish movement to resistance level at 4.95 is expected to happen.

SNX/USDT Break the key resistance area. Bullish Momentum??💎 SNX has significantly caught the market's attention, having recently achieved a notable milestone by breaking through a key resistance area, along with completing the Eve Adam Pattern. This pattern is typically recognized as a rounding bottom, indicative of a bullish trend.
💎 Presently, SNX is demonstrating a robust bounce during its retesting phase at what was previously resistance, now serving as support. This positive momentum suggests a probability continuation of its upward journey, with our next goal being a formidable resistance area.
💎 However, there is a concern: if SNX fails to maintain its upward trajectory and loses support upon returning to this area, it could signal a false breakout. Such a scenario would not bode well for SNX's future direction, possibly leading to a downward trend back towards the demand area.
💎 At the demand level, a strong rebound is essential for SNX. If it fails to show a significant recovery from this zone, there's a risk of further breakdown. This could lead SNX into a deeper bearish trend, potentially moving towards a stronger support area.

SNXSNX next target if it could close a ochl candle above resistant line
It's not a financial advice
Always DYOR

Synthetics Council voted to stop inflationSynthetics Council voted to stop inflation, and initial reactions seem to be good.
DeFi has yet to see a proper resurgence (other than INJ).
Other potential tickers (DYDX and GMX) mulling about.
nil other thoughts.
should see 5 & 6$ eventually.

SNXAfter breaking the long-term trend line, the price leaves the range box and moves towards the first target in the picture

#SNX/USDT#SNX
The price is trading in a large descending triangle and has been gaining bullish momentum recently
Supported by reversal triangle patterns
The price is now in the downtrend breach zone at
the current price of 2.37
With the first goal 3.27
Second goal 4.32
With oversold conditions
During the uptrend there may be some price correction

SNX 2024-2025 BULL RUN TARGET 100$SNX changed its inflation rate and will offer great multi chain amm, they will be new gem after TIA in this bull run.

SNXUSDT - BULLISH OUTLOOKSNXUSDT is displaying a compelling technical setup on the 1-hour timeframe, marked by a bullish divergence on the RSI, suggesting a potential reversal for a bullish trend. Here's a concise analysis and trade plan:
Entry: Consider entering a long position at $3.36
Stop Loss (SL): Set the stop loss at $3.17 to manage potential downside risk
Take-Profit Levels:
TP 1 @ 1:1 = $3.55
TP 2 @ 1:2 = $3.74
TP 3 @ 1:3 = $3.93
After achieving the first take-profit level, consider adjusting the stop loss to the entry point (breakeven) to protect the gains and mitigate further risk.
This trade plan is designed to take advantage of the identified bullish divergence on the RSI, anticipating a reversal in the bullish trend. Managing risk through a stop loss and implementing a breakeven strategy after the first take-profit level aligns with a prudent trading approach. As always, staying informed and adapting to market conditions is crucial for successful trading

SNX BullLooking at SNX as a bottom very shortly based on Tech EW, waiting for volume to kick in.. Divergence with RSI on HT

SNX/USDTThe market trend looks good, it looks like it will form a double bottom or maybe go down a little more and create a divergence.
Wait for confirmation to enter buy

what happens for snxi think it will go down to the 2.82$ range
and after that it goes up to the range 5.5$
we can see that the resistance is broken
