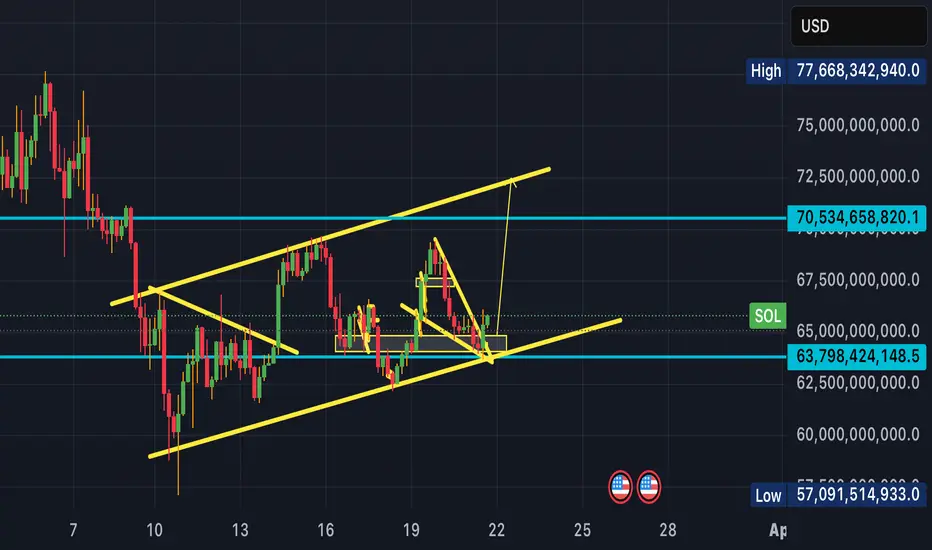
SOLANA MARKETCAP LOOKS COOKEDIs that a Head and Shoulder's top?
Is #crypto about to endure a Iron dome penetration event?
Key data points
Previous close
—
Open
—
Day's range
—
About Market Cap SOL, $
Coin
Solana is a protocol praised a lot for its performance and speed — all for the sake of facilitating decentralized apps. The protocol is even doted on for its Proof-of-history consensus that improves scalability and, consequently, usability. Some bold fans even say Solana is a future rival of Ethereum. How true this is, we can't know, but we can try to evaluate how well the network is doing at the moment by watching market cap of its native token, SOL — we've calculated it and displayed on the chart so that you can stay informed and prepared in any market scenario.

W$J Meme Index – Live Market Cap Tracker for DegensThe W$J Meme Index is a market-cap–weighted chart of the top 14 meme coins in circulation. Built by degenerates, for degenerates. This is your daily source of truth when the timeline is pure hopium.
No fluff. No TA wizardry. Just raw, unfiltered meme market data for the financially unwell.
Coins i

"SOL Market Cap Breakdown Setup| Bearish Retest Targeting 83.3B"SOL Market Cap is showing signs of a potential breakdown after a series of lower highs and a bearish retest of previous support. Price is currently retesting the breakdown level. If confirmed, the next support zone is near 83.3B.
This is a technical analysis-based observation, not financial advice.

$SOL / $BTC Inverse Head and Shoulders BREAKOUT!!CRYPTOCAP:SOL / CRYPTOCAP:BTC Inverse Head and Shoulders reversal pattern confirmed 🥳
PA has also reclaimed the 50DMA
Bullish Divergence on RSI
So many signs indicators aligning across the market.
IS IT REALLY TIME !!?!?

SOL Market Cap – Bearish Rejection Expected from Resistance ZoneSolana's market cap is approaching a **major resistance zone** near $77.8B, aligning with an ascending trendline. The market is showing signs of exhaustion as price nears this confluence of **horizontal and trendline resistance**.
A bearish reaction is expected from this zone, potentially forming a

$SOL ?!Here we have CRYPTOCAP:SOL America’s top pick over CRYPTOCAP:ETH .
I smell a bullish reversal and it seems like this time could be a lot different maybe because of volume and volatility… who knows ?

solana bullish biasafter the recent tariff wars , which mostly began in america , most asset classes plumeted, so my anticipation is that solana will pick up an upward trajectory from the key zones i have highlited.

$SOL Here we have CRYPTOCAP:SOL ,a very famous coin for American investors who trade meme coins etc.
People around the world are also trading meme coins on Salona . Salona is not only good for meme coins but great for tokenization in general. The banks have their own system of tokenization for thei
SOLANA and Elliott Wave.Marked in Blue is the Main Wave. This wave expressed itself in 5 Waves. Though incomplete at the moment, we can see that Wave 4 is completed and a lunge to the upside would complete Wave 5(Red), hence Wave 3(Blue) of the Main Wave. After 3(Blue) is complete, a Wave A would begin for the Flat as a Wa

Solana Bird's eye viewSolana to me is showing basic high volume crypto chart patterns, to be just a bunch of breaks and retest with easy r:r, pump.fun and these crazy kinda criminal events happening onchain non the less id say much higher but thats just in due time

See all ideas
Summarizing what the indicators are suggesting.
Oscillators
Neutral
SellBuy
Strong sellStrong buy
Strong sellSellNeutralBuyStrong buy
Oscillators
Neutral
SellBuy
Strong sellStrong buy
Strong sellSellNeutralBuyStrong buy
Summary
Neutral
SellBuy
Strong sellStrong buy
Strong sellSellNeutralBuyStrong buy
Summary
Neutral
SellBuy
Strong sellStrong buy
Strong sellSellNeutralBuyStrong buy
Summary
Neutral
SellBuy
Strong sellStrong buy
Strong sellSellNeutralBuyStrong buy
Moving Averages
Neutral
SellBuy
Strong sellStrong buy
Strong sellSellNeutralBuyStrong buy
Moving Averages
Neutral
SellBuy
Strong sellStrong buy
Strong sellSellNeutralBuyStrong buy
Displays a symbol's price movements over previous years to identify recurring trends.