SOL - High Time Frame Technical EntrySOL #6
There are a few coins I am buying now based on the 2 week candle that just closed.
SOL is one of them.
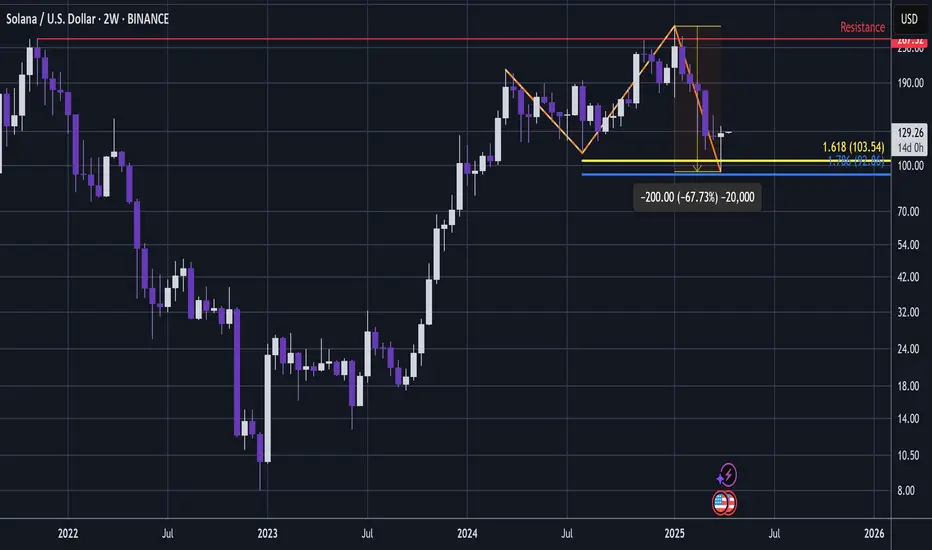
It has printed what appears to be a very tidy high time frame, 3 wave, 1:1.618 Golden Window correction.
The 2 week candle just closed is a bullish long wicked hammer that bounced from within the Golden Window band; just beyond the 1.618.
And so we have the price action signalling that the 1.618 GW has a decent chance to have captured a high time frame pivot low.
If it has then this is now the next wave up.
Worth noting also that although the correction may not appear too deep, this chart is in log and thats a 67% drawdown since January.
Its not too far off the percentage loss of a Bitcoin bear market.
Could wobble in low time frame; who knows really...
I bought more here 👍.
Not advice
SOLANA trade ideas
SOL/USD "Solana vs U.S Dollar" Crypto Heist Plan (Swing / Day)🌟Hi! Hola! Ola! Bonjour! Hallo! Marhaba!🌟
Dear Money Makers & Robbers, 🤑 💰💸✈️
Based on 🔥Thief Trading style technical and fundamental analysis🔥, here is our master plan to heist the SOL/USD "Solana vs U.S Dollar" Crypto Market. Please adhere to the strategy I've outlined in the chart, which emphasizes long entry. Our aim is to escape near the high-risk Blue ATR Line. Risky level, overbought market, consolidation, trend reversal, trap at the level where traders and bearish robbers are stronger. 🏆💸"Take profit and treat yourself, traders. You deserve it!💪🏆🎉
Entry 📈 : "The vault is wide open! Swipe the Bullish loot at any price - the heist is on!
however I advise to Place buy limit orders within a 15 or 30 minute timeframe nearest or swing low or high level for pullback entries.
Stop Loss 🛑:
📍 Thief SL placed at the recent/swing low level Using the 4H timeframe (120.00) Day/Swing trade basis.
📍 SL is based on your risk of the trade, lot size and how many multiple orders you have to take.
🏴☠️Target 🎯: 168.00 (or) Escape Before the Target
🧲Scalpers, take note 👀 : Only scalp on the Long side. If you have a lot of money, you can go straight away; if not, you can join swing traders and carry out the robbery plan. Use trailing SL to safeguard your money 💰.
💰💵💸SOL/USD "Solana vs U.S Dollar" Crypto Market Heist Plan (Day / Swing Trade) is currently experiencing a bullishness,., driven by several key factors.☝☝☝
📰🗞️Get & Read the Fundamental, Macro, COT Report, On Chain Analysis, Sentimental Outlook, Intermarket Analysis, Future trend targets.. go ahead to check 👉👉👉🔗
⚠️Trading Alert : News Releases and Position Management 📰 🗞️ 🚫🚏
As a reminder, news releases can have a significant impact on market prices and volatility. To minimize potential losses and protect your running positions,
we recommend the following:
Avoid taking new trades during news releases
Use trailing stop-loss orders to protect your running positions and lock in profits
💖Supporting our robbery plan 💥Hit the Boost Button💥 will enable us to effortlessly make and steal money 💰💵. Boost the strength of our robbery team. Every day in this market make money with ease by using the Thief Trading Style.🏆💪🤝❤️🎉🚀
I'll see you soon with another heist plan, so stay tuned 🤑🐱👤🤗🤩

Trade Setup Summary (Solana - 19/04/2025 at 04:33 PM)Trade Setup Summary (Solana - 19/04/2025 at 04:33 PM)
Entry Point: 137.50
Target (Take Profit): 141.00
Stop Loss: 135.00
Trend: Bullish (Higher Highs on 30-min Chart)
📈 Technical Outlook (30-min Time Frame)
Trend: Market structure is forming higher highs, suggesting upward momentum.
Entry is in line with trend continuation.
Risk-Reward Ratio: ~1:1.14 — moderate reward relative to risk.
Price Action: Watch for possible rejection or consolidation near the 141 resistance zone.
Stop-Loss is well-placed below recent support levels but could be at risk in case of sudden volatility.
📌 Suggestions
Ensure volume confirms the breakout.
Adjust stop-loss or trail it once price moves in your favor.
Always monitor for unexpected news or macro events affecting crypto prices.
⚠️ Disclaimer
This analysis is for informational purposes only and should not be considered financial advice. Trading cryptocurrencies involves substantial risk and may not be suitable for all investors. Always conduct your own research or consult a licensed financial advisor before making trading decisions.

Solana has just made an upward moveSolana has just made an upward move due to liquidation levels. At the $140 level, we will most likely see a brief downtrend again, after which we will set the price target at $174. Based on historical data, this timing would also make sense, and it aligns with the liquidation levels from futures positions.

SOL: The Leader#Solana is among the top 10 and stands as a key market mover.
It remains in a strong bullish trend, recently bouncing off the 111SMA. Three possible scenarios are presented, two bullish, and one more time-consuming.

Solana Climbs Amid Institutional Investments and ETF Backing Solana (SOL) has climbed to $134.35, marking a 0.89% gain over the last 24 hours and an impressive 20.39% increase over the past week. Its market capitalization now stands at $69.37 billion. Although 24-hour trading volume has declined by 14.73%, settling at $3.71 billion, bullish sentiment continues to build around the asset.
Institutional interest has intensified. Real estate fintech company Janover recently added over $10 million in SOL to its treasury. With more than 163,000 SOL now under management, Janover is following a similar strategy to MicroStrategy’s Bitcoin approach — buying, staking, and holding long-term. This move reinforces growing trust in Solana’s infrastructure and staking rewards.
Support for Solana also extends to regulated investment channels. Canadian institutions have backed Solana-based ETFs, adding another layer of credibility. These developments suggest that SOL is transitioning from a speculative asset to a longer-term investment holding.
Technical Analysis
On the chart, Solana recently broke structure (BOS) to the downside, indicating a growing bearish momentum. However, price found support and bounced off after recording a low of $95. Currently, the price is trading towards a high at $147. If it breaks above the the resistance, the price could extend toward $180, with potential continuation. Alternatively, if the breakout fails, a retest of the $110 zone may follow. The volume remains moderate, signaling cautious participation.
The recent bullish activity aligns with institutional accumulation and ETF exposure. Key levels to watch include $110 as support and $147 high as near-term resistance. A sustained move, break and close above $147 may confirm the next bullish leg for Solana.

Many bullish signs for Solana longSolana is starting to look like building bullish momentum.
Bullish signs:
Daily:
The price broke out of a prolonged descending parallel channel, retested the top trendline of the channel and started to move up.
The price broke and closed above EMA21 (first hurdle of many!) and has been above it for several days.
The price is above the major support zone around 117.
RSI and MACD are both still in the bear zone, however, they are clearly pointing up and about to enter the bull zone.
4H:
MACD and RSI are both in the bull zone.
The price is above EMA 22.EMA 21 is above EMA55.
EMA 200 is traveling horizontally across the recent price range, but the latest candle was strongly bullish and closed above all EMAs.
While EMA200 is horizontally moving, the price will probably oscillate in the range bound. But once EMAs line up for the bullish set up (EMA21 > 55> 22) in 4H, I will consider open a long position based on the 4H chart.

Solana H4 | Rising toward a swing-high resistanceSolana (SOL/USD) is rising towards a swing-high resistance and could potentially reverse off this level to drop lower.
Sell entry is at 144.76 which is a swing-high resistance.
Stop loss is at 154.00 which is a level that sits above a multi-swing-high resistance.
Take profit is at 122.98 which is an overlap support.
High Risk Investment Warning
Trading Forex/CFDs on margin carries a high level of risk and may not be suitable for all investors. Leverage can work against you.
Stratos Markets Limited (tradu.com):
CFDs are complex instruments and come with a high risk of losing money rapidly due to leverage. 63% of retail investor accounts lose money when trading CFDs with this provider. You should consider whether you understand how CFDs work and whether you can afford to take the high risk of losing your money.
Stratos Europe Ltd (tradu.com):
CFDs are complex instruments and come with a high risk of losing money rapidly due to leverage. 63% of retail investor accounts lose money when trading CFDs with this provider. You should consider whether you understand how CFDs work and whether you can afford to take the high risk of losing your money.
Stratos Global LLC (tradu.com):
Losses can exceed deposits.
Please be advised that the information presented on TradingView is provided to Tradu (‘Company’, ‘we’) by a third-party provider (‘TFA Global Pte Ltd’). Please be reminded that you are solely responsible for the trading decisions on your account. There is a very high degree of risk involved in trading. Any information and/or content is intended entirely for research, educational and informational purposes only and does not constitute investment or consultation advice or investment strategy. The information is not tailored to the investment needs of any specific person and therefore does not involve a consideration of any of the investment objectives, financial situation or needs of any viewer that may receive it. Kindly also note that past performance is not a reliable indicator of future results. Actual results may differ materially from those anticipated in forward-looking or past performance statements. We assume no liability as to the accuracy or completeness of any of the information and/or content provided herein and the Company cannot be held responsible for any omission, mistake nor for any loss or damage including without limitation to any loss of profit which may arise from reliance on any information supplied by TFA Global Pte Ltd.
The speaker(s) is neither an employee, agent nor representative of Tradu and is therefore acting independently. The opinions given are their own, constitute general market commentary, and do not constitute the opinion or advice of Tradu or any form of personal or investment advice. Tradu neither endorses nor guarantees offerings of third-party speakers, nor is Tradu responsible for the content, veracity or opinions of third-party speakers, presenters or participants.

SOLANA LONG? SOLANA is setting up for some potential good buying opportunities
- 122.00 is a STRONG Support & Resistance area
- We have a potential inverted H&S pattern seen on the daily and 4h
- Will be looking for a Higher High on the daily and a Higher Low
using my fibs for an entry.
- Ideally I would like the H&S to play out and take a trade once price
breaks the neckline.
- Plenty of Cryptos look similar but this looks like the cleanest IMO.

SOL - Longs on the Horizon!Hello TradingView Family / Fellow Traders. This is Richard, also known as theSignalyst.
📈 Medium-Term : SOL has been overall bearish and it is currently trading within the flat wedge pattern marked in red.
📍 As it retests the lower bound of the wedge — which perfectly intersects with the $100 round number — I’ll be looking for short-term longs.
🚀 In parallel, for the bulls to take over in the long term and kick off the next bullish phase, a breakout above the $147 previous daily high is needed.
Which scenario do you think will happen first — and why?
📚 Always follow your trading plan regarding entry, risk management, and trade management.
Good luck!
All Strategies Are Good; If Managed Properly!
~Rich

SOL/USD – Targeting $86 as Breakdown ContinuesSOL is in a clear downtrend. After breaking below the key support at $120, price tried to bounce but failed around $110. Sellers remain in control. The market is pushing lower, and we are looking at the next support level at $86.
Key Points:
Trend: Downtrend is strong, with lower highs and lower lows.
Failed Bounce: Price could not recover above $110, confirming weakness.
Next Levels:
First checkpoint: $96
Main target: $86
Plan:
Looking to stay with the trend toward $86.
If price moves back above $110, the plan is off — time to recheck.
Watch price reaction at $96, but main focus stays on the lower target.
Risk Reminder:
Stay patient, follow the plan, and always manage your risk properly.

Solana grows the fastest, will the growth continue ?Marked the important levels in this video for this week and considered a few scenarios of price performance
Local resistance at 135$, local support should be at 115$
Write a comment with your coins & hit the like button, and I will make an analysis for you
The author's opinion may differ from yours,
Consider your risks.
Wish you successful trades! MURA

Monitor Price action with Trendlines / Gan Fan*And over here, Sir/Madam, we have the 3.5L six-cylinder, 800-horsepower, 95-cubic feet
truck with a diesel engine. It goes 0 to 60 in 0.5 seconds and comes fully equipped with an 18-foot lift kit and did I mention the 80 inch strobe lights.”*
Some days, wave counting feels exactly like that—like you’ve been dragged to a dealership and hit with a barrage of numbers you didn’t ask for.
Information you have to painstakingly puzzle through.
All you really want to know is: Does it drive? *Where will it take me?*
That’s the heart of my wave counts. I don’t care about the extra fluff. I want clarity, direction, and purpose.
But doing the two-step between multiple asset classes—forex, indices, FANG stocks—feels like a dangerous tango. One where my precious money is on the line.
* *
There’s a Chinese proverb that sums it all up:
**“Life is really simple, but we insist on making it complicated.” — Confucius**
In this quick article, I’ll show you a dead-simple concept that can clear up your charts and your thinking. A quick read. Quick to understand. So for one night, you don’t have to do a dirty tango with crazy numbers.
**Cue: Gann Fans and Trend Lines.**
You’ve seen trend lines.
But have you seen *three*?
When you use three trend lines, you’re not just capturing the obvious. You’re measuring *acceleration*, *deceleration*, and *breakout momentum*. One line to show the base trend. One to catch the slowdown. And one to anticipate the breakout.
Pair that with s&r levels and suddenly you’re seeing *speed* and *time* like never before. A break of a key level or a sharp lift off your trend line isn’t random—it’s often the market shifting gears.
You didn’t think I’d drop all this without sprinkling in some wave counts, did you?
Welcome to the fiesta.
- Tango intensities*
Here’s where it ties in:
A **double bottom** formation near the end of a trend often isn’t just a reversal—it’s a *setup*.
What you’re likely seeing is a **Wave 3-4-5** squeeze into completion. That double bottom is the market catching its breath.
And when it breaks the trend line on the upside? That’s often the beginning of a brand new wave structure in the opposite direction.
If this breakout fails it is just as easy to exit the position with easy to identify stop out points.
It doesn’t have to be complicated.
Just structured.
Best,
Coi

Canada Approves First Spot Solana ETFs, Launch Set For 16th AprThe Ontario Securities Commission (OSC) has approved the world’s first spot Solana (SOL) exchange-traded funds (ETFs), marking a major step forward for crypto investment products in North America. Beginning April 16, 2025, several asset managers—Purpose Investments, Evolve ETFs, CI Global Asset Management, and 3iQ—will offer direct exposure to SOL on Canadian exchanges.
Unlike derivatives-based products, these ETFs will hold physical SOL tokens, giving both institutional and retail investors a regulated way to invest in the Solana blockchain ecosystem. Each provider will track a separate index, allowing for a range of strategies. In addition, these funds will feature staking options, providing a potential yield advantage over other crypto ETFs.
With this approval, Solana becomes the third cryptocurrency to receive spot ETF approval in Canada, following Bitcoin and Ethereum. The news has sparked increased whale activity and fresh speculation that the United States could follow with its own Solana ETF approvals in the future.
Technical Analysis
Solana’s price has been trading below $150, consolidating within a wider range. The key technical level to watch is $147, which marks an internal structure lower high. A strong break and close above $147 could signal a bullish shift in market structure, potentially triggering upward momentum. On the other hand, if the price fails to close above this level, it may drop below $120, reinforcing bearish pressure.
The ETF launch could become a catalyst for either outcome, depending on how the market reacts to the new inflows. At present, Solana continues to trade just below the critical threshold, awaiting a decisive move as April 16 approaches.

Solana (SOLUSD) at Pivotal Weekly Zone – Uptrend or Downtrend?Summary:
COINBASE:SOLUSD Solana is currently consolidating at a high-impact decision zone on the weekly chart, around the $125–130 range. This level has historically acted as a strong support-turned-resistance zone and now forms the basis of a technical inflection point where market pressure is building.
Price action has consolidated around this region multiple times since 2023, and we are now seeing compression within a broader market structure. This is the ideal equilibrium level where bulls and bears will fight to gain control — making this a prime zone to either build long positions or prepare for a short swing, depending on which side breaks out first.
Technical Analysis:
Entry Zone: $125–130 — former support and now a pivotal area for direction.
Outlook: Neutral until confirmation — expecting significant moves in either direction.
Uptrend Target: $180 (next major supply zone)
Downtrend Target: $85 (next major demand zone)
Green Zone Capital Insights:
This is a time to reconsider sitting sidelined in cash, prepare for positioning. Whether long or short, Solana’s current level is one of the cleanest setups we've seen this quarter. As soon as we see clear confirmation on the weekly close and fundamental alignment — we’ll be deploying capital accordingly.
Follow Green Zone Capital for real-time updates, execution plans, and chart analysis.

SOL USD LONG IdeaBased on a fibonacci speed fam from the all time low to all time high along with a fibonacci retracement both point out that the price has retraced down to the golden pocket areas. Based on the supoort holding, along with other indicators I'm using points out a very likely move to the upside of ~20%.

$SOL Bullish Engulfing Candle on Weekly CloseBig Bullish Engulfing candle for Solana on the weekly close.
Needs to breakthrough EMA9 and claim as support.
If not, we could see an inverse head and shoulders reversal pattern formed ~$112 before the next leg up.

SOLANA (#SOLUSD): Bullish Outlook & BreakoutSOLANA formed an inverted head and shoulders pattern on both daily/intraday charts.
Following the release of last Friday's fundamentals, the market experienced a significant surge, breaking through its neckline and a strong falling trend line.
This led to a consequent strong bullish movement and change of character CHoCH. These broken structures now form an expanding demand zone.
I will be looking for a buying opportunity in this zone, anticipating a bullish reversal towards the 150 support level.

Solana Rises Over 18% In Last 7 Days as ETF Talks Fuel OptimismSolana has gained strong upward momentum, trading around $130 in the last 24 hours. The token reached a new weekly high, outperforming many altcoins during the broader crypto market recovery. Growing speculation around the possible approval of a Solana Exchange-Traded Fund (ETF) has fueled this bullish movement.
Investor attention turned sharply after Bloomberg ETF analyst James Seyffart clarified that the U.S. Securities and Exchange Commission (SEC) has until October 10 to issue a final decision on the proposed Solana ETF. However, he also pointed out that early approval is still possible, though unlikely. Under the leadership of Paul Atkins and with input from Hester Peirce's Crypto Task Force, the SEC may fast-track decisions related to digital assets.
A Solana ETF could bring institutional capital into the ecosystem, similar to what happened with Bitcoin and Ethereum after their respective ETFs gained approval. Analysts believe that updated regulations, especially regarding asset custody and digital definitions, will be key in shaping the outcome. If progress continues, early approval remains a possibility, although most market watchers still expect a final decision closer to the October deadline.
Technical Analysis
On the chart, SOL has found support at a major demand zone around the $110–$115 range. The price is now trading above this area after reading below $100 at some point, marking an internal bearish break of structure. If the bullish momentum can sustain to trade and close above the recent lower high at around $147, that move would suggest a shift in trend.
If the price fails to maintain momentum and break above $147, bearish momentum will continue, with a potential retest of the support zone below $100.

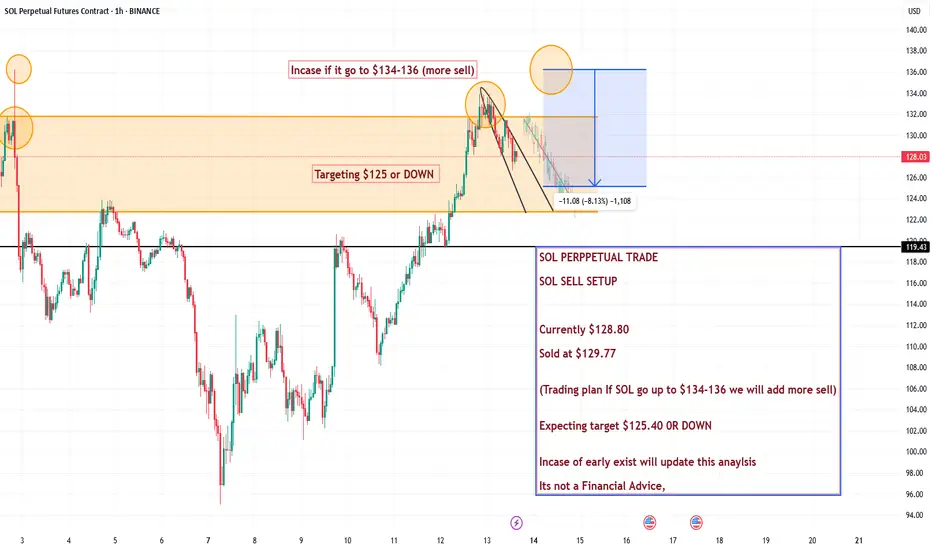
SOL PERPPETUAL TRADE , Sold from $129.77SOL PERPPETUAL TRADE
SOL SELL SETUP
Currently $128.80
Sold at $129.77
(Trading plan If SOL go up to $134-136 we will add more sell)
Expecting target $125.40 0R DOWN
Incase of early exist will update this anaylsis
Its not a Financial Advice,

SOL - Bottom 2025COINBASE:SOLUSD
95USD SOL is a good deal for long term hold
This looks like a bottom on 1 minute chart :-)

Solana preparing for launch to the moon!Fundamental is strong and technically right now is it time to get in. What do you think?
