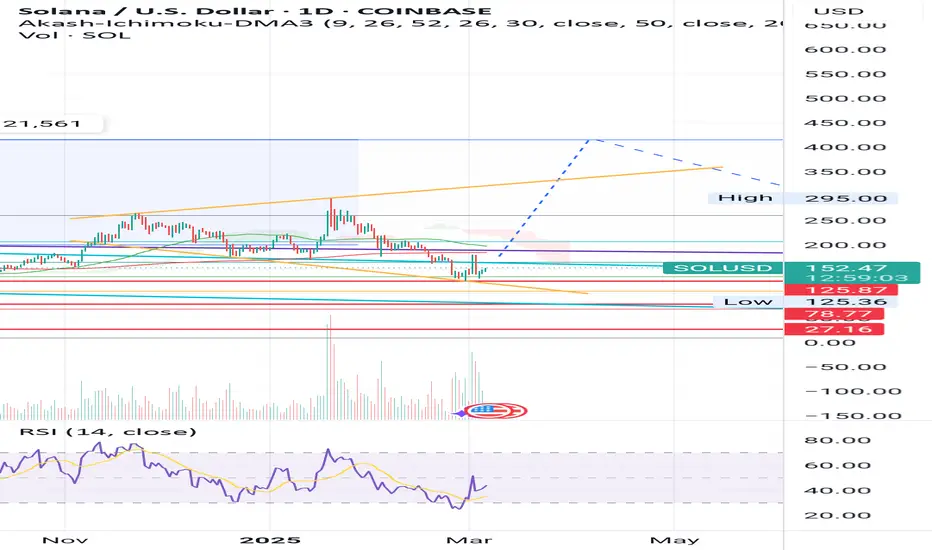
SOL initial target 400 USDCrypto being crypto I do not know how it will progress afterwards.
Note on weekly it hasn't closed beneath the light blue bull flag. Therefore still valid on that time frame. I expect NFP will be the trigger. Weak jobs?
Not financial advice
SOLANA trade ideas
SOLANA: watch out for $160 & $174 zonesSOLANA: watch out for $160 & $174 zones.
The first-ever White House crypto summit hosted by President Donald J. Trump will likely act as a catalyst to pump crypto/Solana in the interim.
$160 may be achieved before or on that day. Also, there is the possibility of this asset hitting $174 to $180.
Trade with care as the whole markets are volatile.

PLAN FOR THE TOP 20 COINS (95% OF TOTAL MARKET CAP)PLAN FOR THE TOP 20 COINS (95% OF TOTAL MARKET CAP)
BTC’s steadily climbing into the 9x range—so where’s SOL headed?
The market’s green right now, but this green flags an adjustment coming soon, likely mid-to-late March. Let’s break down the plan for the top 20 coins, which hold 95% of the total cap. Starting with SOL:
SOL’s current trend is downward, tracking the weekly (W) cycle. Once the bottom’s signaled, it’ll resume growth on the monthly (M) cycle.
The recent pullback brought SOL close to its target zone at 115 USD—but the W hasn’t fully bottomed out yet.
Over the next 1-2 weeks, the W will kick off another decline.
SOL’s potential zones: a high of 186 USD, a lower 164 USD—watch here for the next downward trigger on the W cycle.
Stay tuned, fam!
What’s next: ADAUSDT

SOLUSD SELLThis analysis is based on the provided image and must not be taken as financial advice. Trading involves risks, so conducting your own research and consulting with a financial advisor before making any trading decisions is crucial.

Will SOL start growing now that Trump has announced the reserve?Hi everyone, let's look at the 1D SOL to USD chart, in this situation we can see how the price is moving in an ascending channel where it is currently struggling to stay in the lower part of the channel.
Let's start by defining the targets for the near future that the price has to face:
T1 = 172.96 USD
T2 = 202.57 USD
Т3 = 223.84 USD
Т4 = 250.58 USD
Now let's move on to the stop-loss in case the market continues to fall:
SL1 = 139.90 USD
SL2 = 114.89 USD
SL3 = 94.76 USD
SL4 = 74.35 USD
It is worth looking at the MACD indicator where we can see how low we have gone much lower than during the previous declines, which could potentially indicate that the price will try to go up if the ongoing bullish trend is maintained.

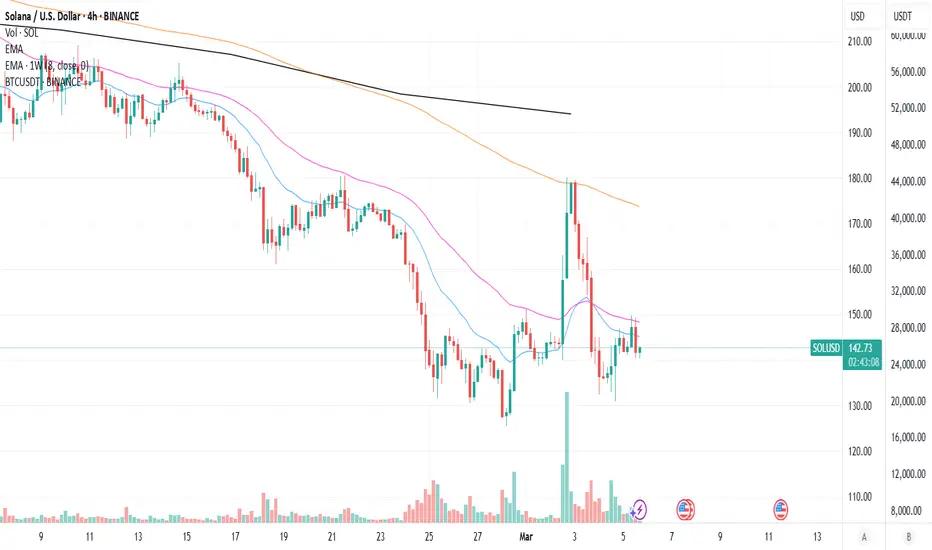
analise gpt SOL/USD Technical Analysis – 4H Chart 📊
Currently, SOL/USD is testing a strong support zone around $140, which has previously acted as a key level for price reactions. This area is crucial for determining the next move in the market.
🔹 Current Market Overview:
Support: $140
Resistance Levels: Next key resistance at $150-$155
RSI: Monitoring if it enters the oversold region (<30)
Moving Averages: Checking interaction with the 21/50 EMAs
🔥 Possible Scenarios:
1️⃣ If the $140 support holds 📈
A bullish reaction could push the price towards $150-$155.
Best entry if we see strong rejection and increasing volume.
2️⃣ If $140 support breaks 📉
The price might seek lower liquidity zones, potentially testing $135 or even $130.
In this case, waiting for a new confirmation would be safer.
🎯 Trading Strategy:
📍 Entry: If there is a strong rejection at $140 with rising buying volume.
📍 Stop Loss: Below $138 to minimize risk.
📍 Target: $150-$155 in the short term.
Monitoring volume and market strength is crucial to confirm the best entry. Interesting opportunity, but caution is needed in case of a support breakdown!
Updated SOLUSDT Analysis March 06, 2025 (Based on Latest Data)Using data from Hyblock Capital, Exocharts, Volume Profile, and Order Flow, I've identified key liquidity zones and market behavior shifts.
🔹 Updated Resistance Levels (Short Zones)
1️⃣ $145 - $147 → Strong sell absorption, reduced bids, high-risk zone for longs.
2️⃣ $158 - $162 → Prior high volume area + liquidation cluster.
3️⃣ $178 - $184 → Breakdown point, potential shorting opportunity.
4️⃣ $198 - $205 → Critical area where liquidity may be absorbed for a larger drop.
🚨 If SOL fails to break these levels with strong volume and positive CVD, shorts remain the safer option.
🔹 Updated Support Levels (Long Zones)
1️⃣ $139 - $141 → Buy absorption detected in footprint data.
2️⃣ $134 - $136 → Key point of control (POC), bids still active.
3️⃣ $128 - $130 → Last strong defense before deeper downside risks.
4️⃣ $120 - $122 → Historical liquidity area with significant past volume.
5️⃣ $100 - $105 → Long-term support, strong liquidity concentration.
✅ If absorption occurs and CVD turns positive at these levels, long entries could be favorable.
📊 Technical Confirmations
🔹 CVD & Delta → Sellers are still dominant, but buy absorption is forming around $139 - $141.
🔹 Footprint & Volume Profile → Buying activity has increased at $134 - $136.
🔹 DOM (Order Book) → Strong selling pressure defending $145 - $147, making it a tough resistance.
📌 If SOL holds above $139 and CVD turns positive, we might see a retest of $145-$146. If it loses $134, $128-$130 is the next downside target.
📈 Updated Trade Setups
🔻 SHORT at $146 (Strong Resistance)
📍 Pair: SOLUSDT
📍 Direction: SHORT
📍 Estimated Success Rate: 82%
🎯 Entry:
🔴 $144
🟠 $145
🟢 $146
🎯 Take-Profit Targets:
✔️ TP1: $139 (+4.79%)
✔️ TP2: $134 (+8.21%)
✔️ TP3: $128 (+12.32%)
⛔ Stop Loss: $150 (-2.73%)
🔺 LONG at $136 (Strong Support)
📍 Pair: SOLUSDT
📍 Direction: LONG
📍 Estimated Success Rate: 80%
🎯 Entry:
🔴 $134
🟠 $135
🟢 $136
🎯 Take-Profit Targets:
✔️ TP1: $141 (+3.67%)
✔️ TP2: $146 (+7.35%)
✔️ TP3: $158 (+16.17%)
⛔ Stop Loss: $130 (-4.41%)
⚠️ Final Conclusion
🔹 $145 - $147 remains a key resistance, and $136 is absorbing well based on fresh liquidity data.
🔹 Losing $134 could trigger a move towards $128 - $130 support.
🔹 Order flow still favors shorts, but a reversal attempt is possible if absorption continues.
📌 This setup is ready to be automated with limit orders. 🚀📊

SOL/USD WHICH WOULD U PREFER?Price didnt make new LL's and returned...so we will be looking for a buy trade but with caution!! dont make decisions too quick! wait for confirmation, and enter AFTER the market tells you its okay! dont rush, wait for right confirmations and than enter. And never forget trend is your friend and always check higher TF's.

Solona "Support & Resistance Levels"Support & Resistance Levels:
Immediate Support: 140.00 (psychological level) and 136.28 (lower support).
Resistance: Levels cluster between 150.00–175.00, with 158.42 and 152.09 as intermediate hurdles.

SOL/USD Potential Upside ContinuationThe price made an explosive move up and then fully retraced. Now, the price is at our buy zone, where we can expect a continuation to the upside, but we must be cautious of a potential false breakout.

Monthly CLS, Key Level 50% of MOB, Model 1 Monthly CLS, Key Level 50% of MOB, Model 1
you are welcome to comment with your thoughts and share your charts or questions below, I like any constructive discussion.
What is CLS?
This company is trading for the biggest investment banks and central banks. They trade over 6.5 trillion daily volume. They are smart money of the all markets.
CLS operates in the specific times which will give you huge advantage and precisions to you entries. Focus on that. Its accuracy is amazing.
Good luck and I hope this educational post helps to become better trader
“Adapt what is useful, reject what is useless, and add what is specifically your own.”
Dave FX Hunter ⚔

$SOL smashes through the EMA9 and SMA20 above $170CRYPTOCAP:SOL smashes through the EMA9 and SMA20.
Looking for the cross for confirmation.
As previously mentioned, that green box was critical to clear $170.
Need a cluster of closes above this.
My 4x LONG is happy rn 🥳

SOLANA is struggling with 2021 ATHSOLANA is struggling with 2021 ATH.
In 2021, we saw TRADENATION:SOLANA hit $160 zone. If you zoom in on your chart like mine, you will realise why this baby is fighting tooth and nail to break that barrier.
It has pushed above that $260 zone X3 but has been closing below.
Should we expect this asset to fall back to the $222 zone?
My thoughts are on my chart.
Trade with care

BTFDF - Last Chance To Buy ALTS Before 2025 MOON SZN2017 + macro bull environment
*4 years later*
2021 + macro bull environment
*4 years later*
2025 + macro bull environment
#JustTrustMeBro I been doing this for a long time.

SOL/USD SELLThis analysis is based on the provided image and should not be considered financial advice. Trading involves risks, and it is essential to conduct your own research and consult with a financial advisor before making any trading decisions.

SolanaSolana/USD is consolidating with mixed signals. Traders should monitor:
Bullish Scenario: Break above 144.53 targeting 145.15 resistance.
Bearish Scenario: Drop below 144.09 testing 142.16 support.

Solonaolana/USD is consolidating with mixed signals. Traders should monitor:
Bullish Scenario: Break above 144.53 targeting 145.15 resistance.
Bearish Scenario: Drop below 144.09 testing 142.16 support.

SOLUSD BUY ANALYSIS SMART MONEY CONCEPTHere on Solusd price has form a demand around area of 132.48 and is likely to continue going up as more buy likely to come and push the price up so trader should go for long with expect profit target of 164.66 and 198.11 . Use money management

Tariffs and Unlock Continue Bearish Pressure? Thoughts?Thoughts on these entries for long-term ?
Uncertainty of tariff's effect on risk assets and recent token unlock have me feeling bearish, could see a little more to the downside I think before upper move. Or is the corrective move done with? Thoughts?

solan for the next mouths Solana (SOL) is trading at its lowest price level since September 2024, as the entire crypto market struggles with fear and intense selling pressure. Solana has lost over 55% of its value in less than six weeks, erasing the gains from its post-election rally and raising concerns among investors about a potential prolonged downtrend.
Panic has taken over the market, and traders are growing fearful that Solana’s correction may continue into lower price levels. Despite multiple attempts to reclaim momentum, bulls have been unable to defend key demand zones, allowing bears to maintain control.
Top analyst Ali Martinez shared a technical analysis on X, stating that Solana appears to be experiencing a macro trend shift from bullish to bearish. If SOL fails to recover key levels soon, it could signal a deeper downtrend and further selling pressure in the coming weeks.
For now, investors are closely watching Solana’s next move. If SOL can reclaim key resistance levels, it could stabilize and possibly trigger a recovery. However, failure to hold above current prices could lead to an extended bearish phase, increasing the risk of further declines.
Solana Facing Serious Selling Pressure
Solana is trading below crucial daily support levels, invalidating the bullish structure thesis that many traders were holding onto. The price action has been weak, with Solana now caught in a high time frame range between $120 and $220. If bulls fail to defend the lower end of this range, Solana could face the risk of a prolonged bear market.
The current price breakdown suggests that bears remain in control as selling pressure continues to mount. Solana has struggled to reclaim momentum, and the once-strong uptrend that started in July 2023 is at risk of collapsing. Analysts are now monitoring whether SOL can hold above the $120 support level, as a failure to do so could trigger a deeper correction.
Martinez’s technical analysis states that Solana appears to be experiencing a macro trend shift. Martinez explains that the bullish trend that started in mid-2023 is on the verge of breaking, and if SOL continues to lose key demand levels, it could confirm a long-term bearish phase.

SOL Potential Bullish MovementWith all of those reasons on chart, I hope SOL can go higher as expected, even more.

SolonaThe chart suggests uncertainty in SOL’s price movement. A break above key resistance (around $160–$170) could confirm a bullish trend, while failure to hold above $120 may lead to further decline.

$SOL Epic 18% Rally to End the Month!What an epic day for CRYPTOCAP:SOL today with an 18% rally!
Closed the month outside of that accumulation zone I mentioned in previous TA, which is very promising.
Looking for SOL to build a cluster this next week outside that range, and then make another leg up into the green zone to reclaim the EMA9.
Take it level by level 👍
