Solana - *Bullish* Macro Count EW-Analysis#SOL
This is my preferred and most bullish scenario for Solana. We're currently in a higher-degree Wave 2 correction following a completed Wave 1. The micro count remains unclear for now, further price action should bring more clarity. It’s possible the X-wave has already completed, suggesting additional downside ahead. The only problem I see with this scenario is that, unlike Solana, other coins like XRP and BTC do not appear to be undergoing a larger corrective phase.
Disclaimer: This analysis is for informational and educational purposes only and should not be considered financial or investment advice. All trading involves risk, and you should perform your own due diligence before making any trading decisions. The author is not responsible for any losses that may arise from reliance on this content. Always trade at your own risk.
SOLANA trade ideas

SOL Short Trading Setup: The Alligator Awakens!
Wave 4 wedge forming — watch for breakdown. Neely rules and Alligator indicator confirm setup.
SOL Trading Setup: The Alligator Awakens! 🐊
The Chart Breakdown
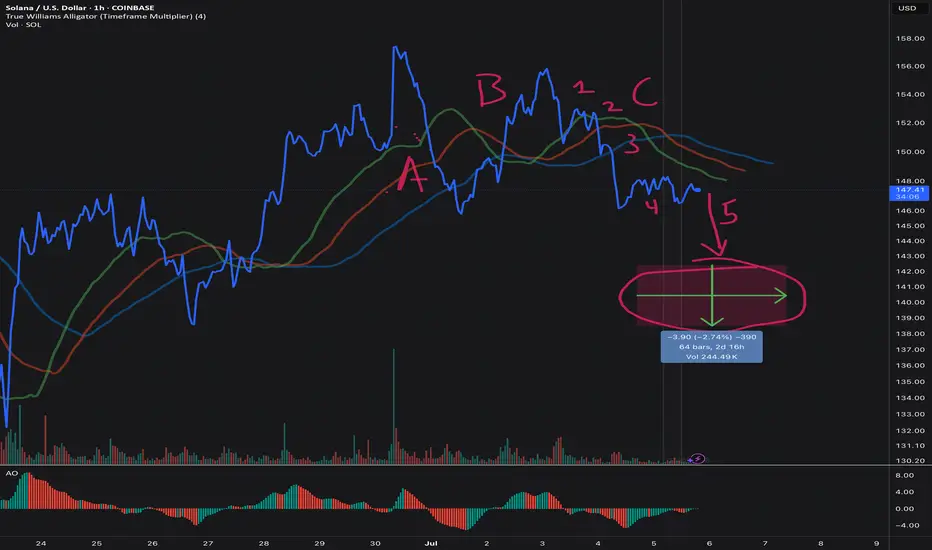
Looking at this SOL/USD hourly chart, we’ve got a textbook Elliott Wave setup using the Williams Alligator and Neely’s NeoWave rules .
The Wave Count Story
ABC : That larger three-wave rally? Done and dusted. ✅
1-2-3-4-(5) : We're now in a five-wave decline, currently sitting in wave 4.
Neely Rules Check ✔️
Price & Structure:
Wave 3 is not the shortest: travels farther than wave 1 and exceeds projected wave 5 → ✅
Alternation: Wave 2 was a sharp ABC; Wave 4 is a flattening wedge/triangle → textbook alternation ✅
No overlap: Wave 4 doesn’t enter wave 1 territory → clean as a whistle ✅
Equality guideline: The green box shows −2.74 %, mirroring wave 1 → picture-perfect ✅
Time Rules (Neely’s most overlooked):
Wave 4 has taken ~25 bars vs. wave 2’s ~15 bars → passes the time-ratio test ✅
Wave 5’s projected end falls within the vertical marker from wave 4’s high → on schedule ✅
Alligator & AO Confirmation 🐊
Alligator lines compressing during wave 4 → energy is building
AO divergence: red bars deepen in wave 3, shrink in wave 4 → classic wave 5 setup
The Trading Plan 🎯
Entry Strategy:
• Stop-limit sell just below wedge support (~$147)
Risk Management:
Stop Loss: One ATR above wave 4 high — protects against a throw-over
Time Stop: Exit at market if not in profit after 70 bars
Profit Targets:
TP-1: 100 % of wave 1 length (green arrow)
TP-2: Trail stop if AO shows bullish divergence near target zone
The Caveat ⚠️
If wave 4 drags on much longer (>2× its current length), it could evolve into a complex correction. Time is key — watch that clock.
Bottom Line
This setup checks all the NeoWave impulse boxes. The structure is clean. The Alligator is asleep. And we’re approaching a wedge break.
Short the break, target the equality zone, and respect your time stop.
Good traders follow rules. Great traders follow Neely rules. 😉
Agree or disagree? Drop a comment or share your chart!
SOL – Compression at Resistance IISolana remains locked in a corrective sequence, unwinding from the mid-June $164 high. Price has now respected a clearly defined descending trendline, recently validating it with a third consecutive rejection—establishing it as dominant short-term resistance. Compression is now occurring just above a well-tested 2H order block near 144–139, where bulls must respond or risk cascading into inefficiency zones.
Structural and Momentum Breakdown:
Descending Resistance Structure: Three clean rejection wicks off the same trendline establish this as firm structural resistance. The latest failed bounce confirms this diagonal as active seller control.
Fib Cluster Rejection: Price has struggled below the 50–61.8% retracement (152–155 zone) from the June high, marking that cluster as distribution resistance.
Volume Profile (VRVP): Sitting atop a low-volume pocket between 144.88 and 139.71; below that lies high-acceptance around 132.
Volumized OB Zones: 2H OB between 144–139 overlaps with key support shelf—any breakdown from here opens path to 132–129 range sweep.
RSI: Persistently sub-40 with no bullish divergence—momentum continues to degrade.
PVT: Flat-to-declining, showing no inflow response to support retests—suggests buyers are stepping back even at local lows.
Example Trade Strategy:
Bullish Reclaim Setup:
Entry: Only with breakout and 2H close above 152–153 (above OB and breaking descending resistance).
SL: Below 144.50 (reclaim invalidation).
TP1: 158–160 (Fib 78.6%)
TP2: 164 (100% retrace)
Confirmation Criteria: RSI >50 + breakout volume + PVT uptick.
Bearish Continuation Setup (If OB breaks):
Entry: 2H close under 144.88, confirming OB loss and trend continuation.
SL: Above 148.
TP1: 140
TP2: 138
TP3: 132–129 (macro demand + HVN)
Confirmation Criteria: Momentum stays sub-40 RSI, increased sell volume, and continued PVT drop.

SOLANASolana market Structure:
how the next move
I think solana will going down, potential to short if not break strong high

SOL – Compression at ResistanceAfter retracing up toward the 50% Fib level (around 154.3–154.4 on the daily chart), SOL/USDT has now stalled beneath key resistance and is rolling back into the reaction range. A close look at both the 1D and 2H charts reveals a clear case of a failed swing high rather than a trend reversal.
1. Structural Context
SOL remains inside its broader downtrend channel (green lines). The bounce off the June low carved out a higher low, but the subsequent rally ran into:
The daily descending trendline (red) from the June high
The 50% Fib retracement of the June down-leg (154.3–154.4)
A sell-side order block (red volume bars on the left VPVR)
The daily 20-period SMA and upper Bollinger Band
Because price could not clear these layers, the move shows the characteristics of a lower high inside a downtrend rather than a genuine breakout.
2. Multi-Timeframe Confirmation
Daily (1D) Chart
Retracement: Peaked at 50% Fib then reversed.
Volume Profile: Thick VPVR node at 154–156 acted as a supply shelf.
Bollinger Bands: Upper band contained the rally.
RSI: Pulled back from ~55 and printed a lower high as price challenged 50%.
PVT: Flat, indicating no real net buying during the bounce.
2-Hour (2H) Chart
Trendlines: A shorter-term red downtrend line capped the local rally near 154.
Order Blocks: Green buy-block around 137–140 held the low; red sell-block around 154–157 limited upside.
RSI: Printed a lower high on the second leg up, even as price revisited prior highs.
Volume: Tapered off on the approach into the 50% Fib zone, then increased on the pullback — a sign of distribution.
3. Key Levels & Next Moves
Immediate Support:
152.2–152.5 (38.2% Fib)
151.1–151.9 (23.6% Fib & daily BB midline)
Structural Support Zones:
146.1–144.6 (prior consolidation & lower Bollinger band)
141.5–140.9 (secondary order block)
134.0–137.0 (major demand cluster)
Immediate Resistance:
154.3–154.4 (50% Fib + daily trendline + SMA)
156–158 (78.6–100% Fib band + higher-timeframe supply)
If SOL fails to hold 152.2–152.5, look for a retest of the 146–144 zone. A breach below 144 opens the path back toward the 137–134 order block. Conversely, a sustained reclaim of 154.4 on volume would be needed to shift the short-term bias neutral.
4. Conclusion
This sequence—bounce into 50% Fib, capped by overlapping resistance, followed by divergence in momentum and rising volume on the pullback—confirms another lower high in SOL’s downtrend. Until price can clear 154.4 with conviction, the path of least resistance remains downward.

Give me 3 reasons not to be bullish on SolanaSolana’s Total Value Locked (TVL) expanded from $396M on Dec 26, 2022 to $8.69B by July 4, 2025, a 2,094% increase (~22x growth) across 80 weeks . This translates to a weekly geometric growth multiplier of ~1.089, or an 8.9% compound weekly rate .
This rapid TVL expansion reflects capital inflows, increased DeFi participation, and regained trust in Solana’s infrastructure following the FTX collapse.
————————————————
LST Ecosystem Expansion :
Liquid staking derivatives (JitoSOL, mSOL) accounted for a significant share of inflows, as yield-seeking capital returned with Ethereum-style primitives on Solana.
MEV Monetization & Compression Tech :
Validator-side MEV solutions and data compression (via Firedancer and ZK-state) improved scalability and trust in Solana’s low-latency environment.
Resurgence of DeFi-NFT Hybrids :
Protocols like Tensor and HadeSwap blurred lines between DeFi and NFTs, generating sticky liquidity and reinforcing Solana’s unique narrative.
Restored Institutional Confidence :
Post-FTX reforms and a more diversified validator ecosystem helped re-attract institutional capital, supported by enhanced wallet infra (e.g., Backpack, Phantom) and custodianship.
This pattern, paired with the geometric growth trend, suggests Solana’s DeFi ecosystem is entering a new structural bull phase, underpinned by both technical confirmation and fundamental evolution.
Anyways, let me know in the comments 3 reasons not to be bullish on Solana as we speak.
(PS: QC-resistant issues don’t apply only for Solana but for all major crypto assets!)

solusdtThe breakout area has been successfully tested and we will see the next step, the drop to the shaded area.
*In principle, I am not a supporter of any direction, but I am only giving my point of view, which may be right or wrong. If the analysis helps you, then this is for you. If you do not like this analysis, there is no problem. Just ignore it. My goal is to spread the benefit. I am not one of the founders of the currency.

Sol searching, for an entry. If you find this information inspiring/helpful, please consider a boost and follow! Any questions or comments, please leave a comment!
The Elliottician’s Paradox: 12-12 or Zigzag? Bias Is the Key
Ever stare at a chart and ask, “Is that a 12-12 or a classic zigzag?” Yeah… welcome to the paradox we Elliotticians live in. Pattern recognition’s a blessing and a curse because context is everything, but confidence can get you wrecked.
This one’s got me on the edge.
What’s Happening Here
We’re currently watching a move that could be either:
- A corrective zigzag (5-3-5), or
- A 1-2, 1-2 setup, gearing up for a blastoff
That’s the core dilemma — two valid options, both technically legal. So what tips the scales? Bias.
The Line in the Sand: 152
Here’s what I’m watching for:
Key Level: 152
- That’s the bull/bear line for me.
- A strong impulsive reclaim above 152 flips the script. I’d reconsider the bearish view if price surges with intent.
- But if we return to 152 in a sluggish, corrective way? I’ll be eyeing continuation lower, aligned with a more traditional zigzag structure.
Elliott View
This is where the paradox plays out:
If we’re looking at a 1-2, 1-2 setup, expect:
- A powerful Wave 3 soon (should not be shy)
If it’s a Zigzag ABC:
- Then we should expect a corrective internal retracement and continuation to the down side, at minimum past the origin of the initial move.
The chart will speak loudest. But structure and strength of this next leg will confirm the story.
Final Thoughts
Trading isn’t about being right. It’s about managing scenarios — and this one’s a classic fork-in-the-road moment. I’ve got a plan for both directions.
152 is my trigger. Stay below it and fade the rally. Break above it impulsively, and I’ll flip my bias with it.
The Elliottician’s paradox isn’t a trap — it’s an invitation to stay sharp.
Your Turn
How are you reading this structure? Do you favor the zigzag or the 1-2 setup? Drop a comment and let me know.
Trade safe, trade clarity!

Solana Bullish Outlook Above $140.0Solana's decline from 163.9 eased near the $148.4 support. However, this demand zone expands to $140.0, which is backed by the high volume node.
From a technical perspective, the outlook is bullish as long as Solana trades above $140.0. In this scenario, we expect the price to target at least 50.0% of its previous range, which is approximately $155.38.


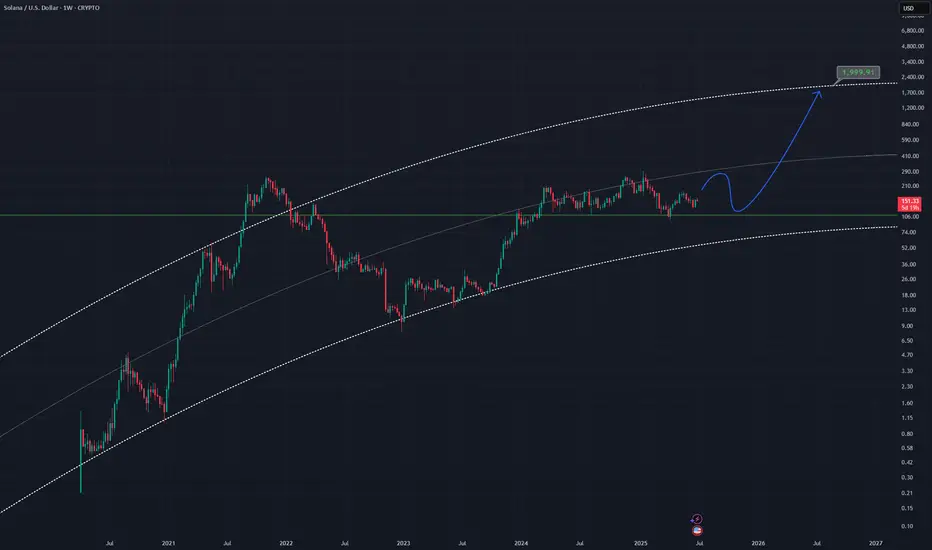
SOLUSD - Bull Ideaan idea for the bulls showing a curved channel rising
Once the bulls kick in price may push up to the top of this channel as it has before, putting price at around 2k
SOLUSD is a good altcoin pick imo
Weekly chart
Getting close to go long!
Solana bullish momentum is building up from both technical and fundamental perspectives.
Daily chart:
1) A daily candle decisively moved and closed above EMA21 on Sat 28th June.
2) RSI and MACD are still in the bear zone but the lines are crossed and now moving upwards.
3) RSI line is now above 50. When the RSI line moves above 50 and EMA21 closes above 21 at the same time, it is often (not always) an early sign of bullish momentum (see blue vertical lines in daily chart).
4H chart:
1) EMA21>EMA55, but EMA200 is still moving horizontally.
2) All momentum indicators have entered the bull territory. However, when the candle finally broke outside the descending parallel channel and broke and closed above EMA200, momentum indicators reached the overbought territory. It means the price is likely to consolidate first before taking off.
I plan to open a long position when:
1) Wait for the momentum indicators to come down and flip to the upside in the 4H chart.
2) A candle to retest, either EMA 21, 55 and/or 200 and forms a strong green (bullish) candle in the 4H chart.
3) A candle stays above EMA 21 in the 4H chart.

SOLUSD IH&SHi Everyone. Sol USD Looks ready. IH&S Breakout in play. Not financial advice. Please do your own research.

SOL Ready To Breakout?SOL had a decent move this weekend overcoming descending resistance and now testing as support.
Price appears to have a completed a wave (2) at the .618 Fibonacci retracement and S1 daily pivot and a larger degree wave 2 at the channel bottom, High Volume Node support and .618 Fibonacci retracement.
If a wave (3) of 3 is underway then we should expect a strong move sooner rather than later with an initial target of the swing high resistance a/ R2 daily pivot $208-$216 range
Safe trading.

hellohello I think market is bullish now seeing the curve lines and specially ema plus the rsi is in oversold area

$SOL Bullish Engulfing On WeeklyCRYPTOCAP:SOL closes the week with a Bullish Engulfing candle.
50WMA at $170 next target to smash.

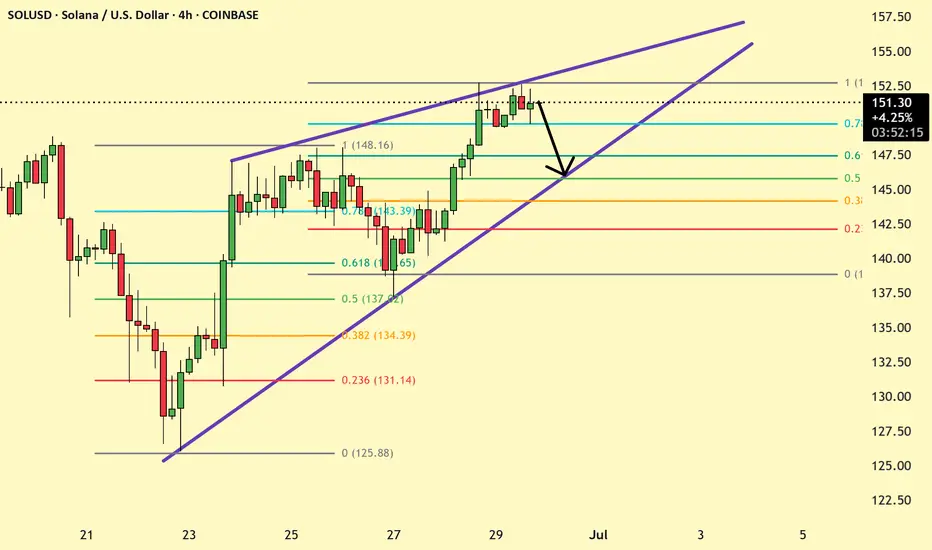
SOLANA 4 hr pullback on play SOLANA had recently high rally reached resistance around 152 , before it Resume bullish pullback to 145-147 is possible with 153 stop loss.
SOLANA Weekly Chart pull back from 0.382 Fib Bullish engulfing The Swing low and high indicate the bullish trend ahead for solana after forming a bullish engulfing candle More growth coming.

Solana coin Long setupIn this video I go through the current price action and talk about how the 126$ target level was recently reached for a clean long entry and on the daily timeframe we printed a higher low .
I expand on my thoughts for a continuation to the upside and to retest some higher levels of resistance 180$s and time will tell if we print a higher high at the 180$s before retesting the $200 zone .

Solana Heading to 112 or 330+Hey fam
So for Solana if we hold under 148 then a drive down to 112 makes sense. However if we drive above 148 then we can possibly hit weekly targets of 330
Make sure you adjust accordingly in a smaller time frame to ensure your in the right move
Happy tradings folks
Kris Mindbloome Exchange
Trade Smarter Live Better
Under 148 we go to 112 if we break 148 we can see a drive up to 338

SOL/USDT - Visible double top formationAfter hitting the projected reversal zone near 144–145, SOL/USDT has now formed a clean double top, reinforcing the bearish thesis initially outlined by the harmonic pattern. The second peak failed to break the macro descending trendline, and the price is now trading back below the 100% Fibonacci retracement of the XA leg.
This double top adds structural confirmation to the harmonic C-point rejection:
Volume remained lower on the second peak
RSI on the 30m chart printed a lower high while price matched previous highs — a textbook bearish divergence
PVT continues to flatten despite price volatility, suggesting a lack of bullish conviction
Price is now slipping below 143, and bearish momentum is building.

SOL/USDT – Bearish Harmonic Completion Near 144–145The 2H chart shows an extended X‑A‑B‑C‑D harmonic structure (an extended Bat/ABCD). Leg XA was the initial down-leg (from the recent swing high down to A), AB was a corrective pullback, and BC retraces sharply into the 88.6–100% zone of XA (around $144–$145). In a classic Bat/ABCD, the CD leg often completes near an 88.6% retracement of XA, so this C zone is a potential reversal point (PRZ). Importantly, C also sits on the chart’s long-term red descending trendline – a confluence of fib and trendline. A break below this level would “validate the bearish harmonic pattern,” with the downtrend line amplifying selling pressure. The projected D-point is ~$122.63 (late June/early July), which coincides with the lower green channel support on the chart.
Harmonic pattern (2H SOL/USDT): XA and AB moves set up a deep BC up into the 88.6–100% fib zone (around $144–145) at C. This confluence of fib levels and the macro descending trendline makes C a strong Potential Reversal Zone (PRZ). The CD leg targets ~122.63, aligning with lower channel support (green). Across timeframes the momentum is waning into point C. RSI is rolling over – price made a lower high while RSI failed to confirm (a classic bearish divergence). Meanwhile, the PVT (Price Volume Trend) line has flattened even as price crept higher, indicating the rally is not supported by volume.
Volume patterns also signal distribution: rallies into C have occurred on declining volume, a textbook sign that buying interest is drying up. Wyckoff distribution theory notes that as a top forms, “rallies during this stage often show lower volume” and ensuing drops on higher volume. In short, weakening RSI, a flat PVT, and thinning volume all confirm the selling pressure around $144–$145, consistent with a bearish reversal at C. Momentum and volume (15m SOL/USDT): RSI has peaked lower while price nears $145, and PVT has flattened (highlighted). Rallies into C come on lower volume, matching Wyckoff distribution cues. These divergences suggest the upward move into C is exhausted.
Trade Plan & Risk Management
Entry: Short initiated at $145.00 (near the PRZ around C).
Stop Loss: $146.20 (just above the red trendline and invalidation of point C).
Take Profit Targets:
TP1 : $129.00 (minor fib support, ~61.8% retrace of the last swing).
TP2: $122.63 (harmonic D projection and channel support).
TP3: $120.00 (extension to lower channel boundary).
Confirmation: Watch for a break of the short-term support at ~$139.50 for added conviction before letting profits run.
Note: A short position was opened at $145. This outline is for informational purposes – it is not financial advice. Trade with proper risk management.
Each target corresponds to technical levels (fib retracements and channel support). The first target aligns with a ~61.8% retracement (common fib TP level), and the final targets sit on the longer-term channel floor. If price breaks under $139.50, it would further confirm the bearish thesis.

Possible retest of 130$ support line incomingLooking at the downtrend (shown in orange) the 130$ support line will probably be retested again. When we hold the same support line, we can expect another retest of 146$. Hopefully with a good result 🚀! Anyway, I am buying some more if this will happen (going long from 130$) because there was enough volume at that level.
