Short term SHORTS ON SOLANAAs price is approaching Supply(1hr FTR), I'm anticipating a sell right to the next DEMAND
SOLANA trade ideas

SOL/USD "Solana vs U.S Dollar" Crypto Heist Plan (Day/Swing)🌟Hi! Hola! Ola! Bonjour! Hallo! Marhaba!🌟
Dear Money Makers & Robbers, 🤑 💰💸✈️
Based on 🔥Thief Trading style technical and fundamental analysis🔥, here is our master plan to heist the SOL/USD "Solana vs U.S Dollar" Crypto Market. Please adhere to the strategy I've outlined in the chart, which emphasizes long entry. Our aim is to escape near the high-risk Yellow MA Zone. Risky level, overbought market, consolidation, trend reversal, trap at the level where traders and bearish robbers are stronger. 🏆💸"Take profit and treat yourself, traders. You deserve it!💪🏆🎉
Entry 📈 : "The heist is on! Wait for the MA breakout (156.00) then make your move - Bullish profits await!"
however I advise to Place Buy stop orders above the Moving average (or) Place buy limit orders within a 15 or 30 minute timeframe most recent or swing, low or high level for Pullback entries.
📌I strongly advise you to set an "alert (Alarm)" on your chart so you can see when the breakout entry occurs.
Stop Loss 🛑: "🔊 Yo, listen up! 🗣️ If you're lookin' to get in on a buy stop order, don't even think about settin' that stop loss till after the breakout 🚀. You feel me? Now, if you're smart, you'll place that stop loss where I told you to 📍, but if you're a rebel, you can put it wherever you like 🤪 - just don't say I didn't warn you ⚠️. You're playin' with fire 🔥, and it's your risk, not mine 👊."
📍 Thief SL placed at the nearest/swing low level Using the 4H timeframe (130.00) Day / Swing trade basis.
📍 SL is based on your risk of the trade, lot size and how many multiple orders you have to take.
🏴☠️Target 🎯: 175.00 (or) Escape Before the Target
🧲Scalpers, take note 👀 : only scalp on the Long side. If you have a lot of money, you can go straight away; if not, you can join swing traders and carry out the robbery plan. Use trailing SL to safeguard your money 💰.
💰💵💸SOL/USD "Solana vs U.S Dollar" Crypto Market Heist Plan (Swing/Day) is currently experiencing a bullishness,., driven by several key factors. .☝☝☝
📰🗞️Get & Read the Fundamental, Macro, COT Report, On Chain Analysis, Sentimental Outlook, Intermarket Analysis, Future trend targets... go ahead to check 👉👉👉🔗🔗🔗
⚠️Trading Alert : News Releases and Position Management 📰🗞️🚫🚏
As a reminder, news releases can have a significant impact on market prices and volatility. To minimize potential losses and protect your running positions,
we recommend the following:
Avoid taking new trades during news releases
Use trailing stop-loss orders to protect your running positions and lock in profits
💖Supporting our robbery plan 💥Hit the Boost Button💥 will enable us to effortlessly make and steal money 💰💵. Boost the strength of our robbery team. Every day in this market make money with ease by using the Thief Trading Style.🏆💪🤝❤️🎉🚀
I'll see you soon with another heist plan, so stay tuned 🤑🐱👤🤗🤩

SOLUSD Breaks Down from Supply – Are $163 and $143 the Next StopCOINBASE:SOLUSD just got rejected hard from the $183 supply zone, where high-volume sellers stepped in (Visible Range). The rejection aligns with overall crypto weakness as macro uncertainty builds.
Key Levels to Watch:
Supply Zone: $180–$183 – strong seller territory
Support Areas:
$163 – immediate support zone
$143 – major demand zone with heavy volume interest
Market Structure:
Lower highs forming after rejection. If $163 fails to hold, expect swift downside toward $143. Short setups below $170 could be ideal with risk managed above supply.
Macro Pressure:
Three U.S. red folder news events coming up—prepare for unexpected volatility around those dates.
Quick Trade Idea:
Wait for retests of broken levels. Enter short if rejection holds below $180. Longs may wait until confirmation from $143 demand.
Question for You:
Would you buy the dip at $143 or ride the bear momentum?
#Solana #SOLUSD #CryptoAnalysis #PriceAction #SupplyAndDemand #VolumeProfile #CryptoTrading #Altcoins #BearishBias

SOL on 1 Month Time FrameIn 1 month time frame the SOLANA chart looks in clear uptrend ascending triangle pattern.
First target is ATH
Charts for educational purposes only!!

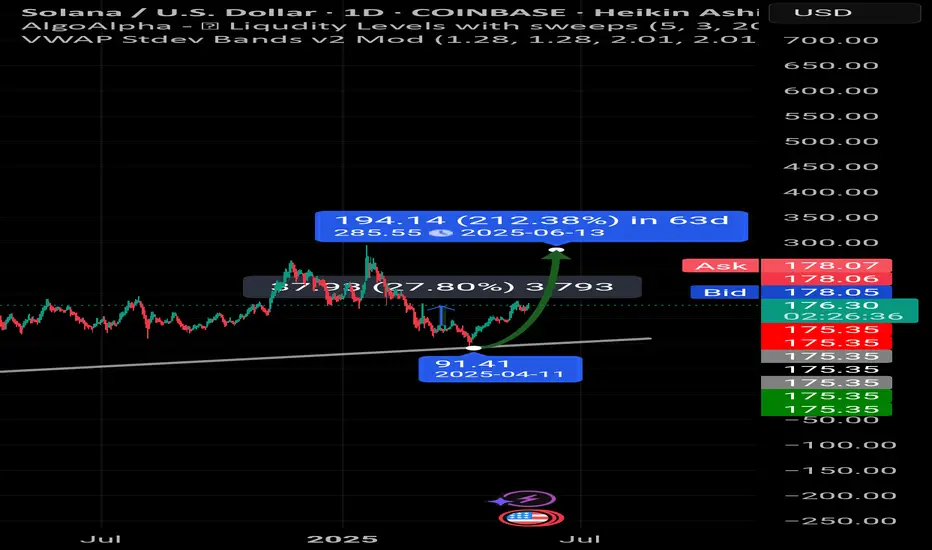
Solana will be king again. Solana's fate will be decided this summer. The only coin rising in a giant triangle will either go to $ 400 or leave us like ETH. 274 and then $ 400 is very likely.

The good news for solana lovers According my estimated forecast at 13 Jon 2025 solana will reach to 285 $ of price.
Powerfully potentially it's happening to new alt season and all of the chain tokens getting the same upward percentage.
According to the last wether of solana chain upwards it's maybe happening very faster than the others alt coins.
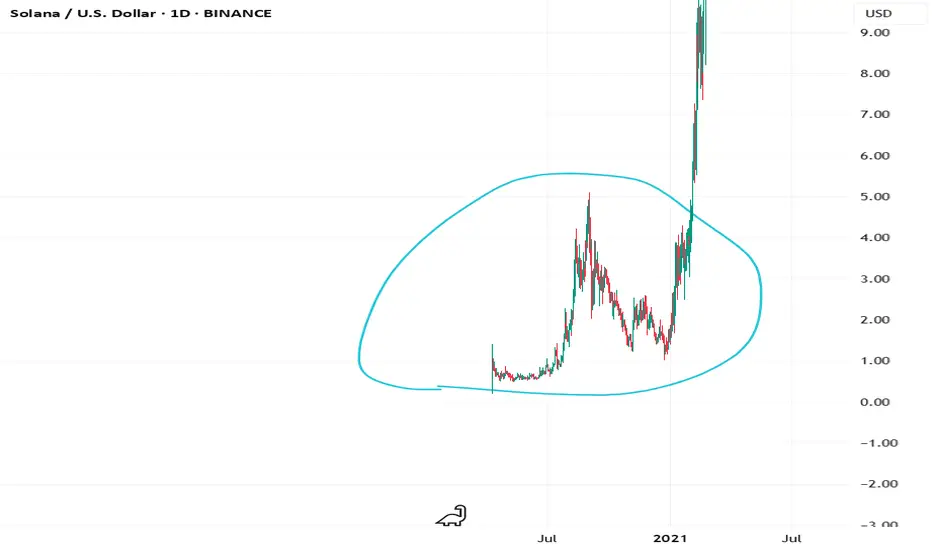
What if you could bought Solana at 3$ again?! Hello traders, of course you need to DYOR, but im here to recommend on one of the best investments in crypto currently, its called HYLX HyperSwapAI,
an AI-powered DEX, that gives the best rates and speed. support 30 chains, and you can swap coins from different network on it. example, buy BTC using USDT(SOL) , or sell SOL using USDC (ETH).
This is a SEED_TVCODER77_ETHBTCDATA:1B potential worth coin, currently setting around $1M marketcap. of course it depends on future developments, progress, partnerships,etc.. but this innovative DEX has a huge space for growth.
if the solana whales wanna buy and belive in something, this is it.
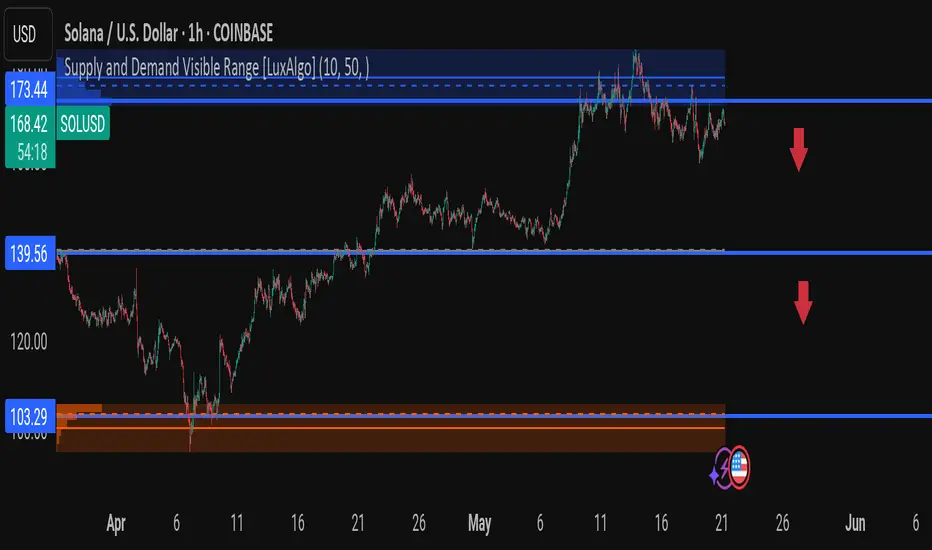
SOLANA Ready for a Drop? Smart Money Already Left Clues…Solana is currently trading around $168.46, struggling to break and hold above the $173.44 supply zone. The recent price action suggests that buyers may be losing steam after a strong bullish run.
Key Levels to Watch:
$173.44 Supply Zone – Strong rejection zone. Multiple rejections hint at institutional selling or large profit-taking.
$139.56 Support Zone – This is my first downside target if we lose momentum.
$103.29 Demand Zone – Major demand and high-volume area. If SOL dips this low, bulls may defend hard.
Current Outlook: After forming a lower high, price is consolidating under resistance—a potential bearish setup. If we break below the current range with volume, it could trigger a cascade towards $140 and possibly lower.
Trade Plan:
Looking for short entries below $165 on confirmation (break + retest or bearish engulfing).
Buy zones around $139 and $103, depending on how price reacts.
What’s your Solana play from here? Are we heading for $200 or crashing back to $100?
Let’s discuss in the comments!
#Solana #SOLUSD #CryptoAnalysis #PriceAction #SupplyAndDemand #FrankFx #LuxAlgo
SOLUSD Long1D Analysis:
SOLUSD is in a strong uptrend with a second Higher High (HH) in place. A bullish divergence is visible, and price has retraced into the golden zone (0.5–0.618 Fib) — signaling a high-probability long setup. Instant buy is Suggested.
Bull Score: 2 vs 0 (Uptrend (Dow Theory, Bullish Divergence vs 0)
🛡 Risk Management
📍 Entry (EP): 170.50 (Instant Buy)
🛑 Stop Loss (SL): 140.55
🎯 Take Profit 1 (TP1 - 1:1): 199.40
🎯 Take Profit 2 (TP2 - 1:2): 228.78
💰💸 Trade smart, manage risk, and let the trend print

DAILY CHART SOLDaily SOL chart, just tracing out the supprot and resistance zones that are important for potential entry positions on a LONG as we are in a bullish uptrend.
Retest zones are marked at 155-17 area and 181+ for a LONG

Weekly plan for Solana In this idea I marked the important levels for this week and considered a few scenarios of price performance
Write a comment with your coins & hit the like button and I will make an analysis for you
The author's opinion may differ from yours,
Consider your risks.
Wish you successful trades ! mura

Solana driving to 176 ??? Or can we go Higher? Hi everyone
This is what I am seeing currently, let me know what you think ?
Kris/Mindbloome Exchange
Trader Smarter Live Better

Solana – Speculative Long Trade Setup Ahead of Narrative CatalysDespite BTC and ETH rallying, SOL has lagged, making it a potential rotation play as capital moves across majors. With attention building around the Internet Capital Markets narrative, SOL may soon attract speculative inflows, especially given its historical performance during sector-wide momentum shifts.
🔹 Entry Zone:
$152 – $154
🎯 Take Profit Targets:
🥇 $172 (local resistance / prior rejection zone)
🥈 $181 (next HTF resistance and possible momentum breakout zone)
🛑 Stop Loss:
$144 (invalidates current short-term bullish structure)

A weak start for SolanaSOL starts the week trading below local support around $165. Continued weakness could lead to a retest of $155.
Failing to hold $155 could signal further weakness and the possibility of entering it's previous range with support around $142.
If prices reclaims $155, it could signal strength and potential to turn local resistance around $182 into support, reclaiming the 1D 200MA, setting the stage for the next leg up.

Solana price action in May - June 2025 : Bear and Bull Case COINBASE:SOLUSD
Watch the arrows and key levels like 164 and below for downside and 174.50 above for upside to $203-$205 and eventually to 260 and eventually to 450.

Looking at a handle here :-)We’re looking at the cup’s handle here. My guess is that we’re going a bit more down from this status in the upcoming 24h and then go up again. If it does not go further down the 160 then we will probably break through the 180 resistance and hit 200. Let me know your thoughts about it! :-)

Solana possible reject off the 21 smaThis is just an observance that I've made. The last time we rejected off this 21 sma, we dropped 93% to the bottom. I am by no means a bear, but I like to read what the charts are telling me. Bitcoin rejected in the same exact way last cycle but blew through it this cycle. Maybe this will change things. Let's just keep on eye on it.

$SOL and Most Major Alts Get Hard Rejection from 200DMAMost of your favorite Alts such as CRYPTOCAP:SOL had hard rejections from the 200DMA.
If this trend breaks into the red box we should see a retest around the .236 Fib and 50DMA ~$140
RSI also looks McDonald's toppy
Not a good time to FOMO.
PS. Normally i dont post TA this late in the night from the US but I'm gonna consider doing more if i get some decent engagement.
Lmk if you think i should post more at these midnight hours 🎃


SOL at a key resistance area - Bullish or Bearish?SOL at $180 is at a key resistance area.
The last time we had the same pattern repeating from the trendline support that turned resistance which gave a prolong bear season. (April '22)
We need to see SOL break out past this wall of resistance above $180 to be bullish.
For now, I am not allocating capital into SOL until I see that break of resistance.

SOLUSDT Daily CandleSOLUSDT SPOT MARKET
Here's the analysis for Solana on the daily candle:
Everything depends on Bitcoin.
The market is currently deciding its direction, so please be cautious.

POTENTIAL Dead Cat Bounce Baking...COINBASE:SOLUSD SOL has recovered nicely after it's 67% loss, and is one of the strongest large cap coins this run up.
It's currently right below the 0:0.618 of the previous wave down and forming a broadening wedge on a smaller time frame.
So, the question arises...is this a true recovery or is it a dead cat?
It can be challenging to discern the difference, but there could be clues that strengthen the TA.
1) The broadening wedge (Which could morph into a diamond top) below the 0.618 is suspicious. On the 1day chart it is getting rejected by the 200 SMA and RSI bearish divergence is starting to show.
2) Volume has been decreasing since the beginning of the recovery.
3) There is a potential doji candle in the making on the 1W time frame, with 2days and 8 hours until closed.
4) USDT.D came short of a LTF 1:1 3 wave correction, so there is a chance that it could come back and try to reach that target. It is printing a potential doji on the 0:0.618 retracement with increased buying volume.
To void the dead cat, we would have to see a higher or equal low of retracement to the downside if this is a wave top. Or at least a 0.85 retracement to the upside if price continues up.
So, this could be wave X of a WXY correctional pattern. On a larger time frame it appears the ABC pattern is complete, but could form a deeper C wave bottom.
If the dead cat does bounce, how far could price continue downwards? There is a strong ratio band of support, the 1:2.272 on higher TF (around 67.00).
This TA is not meant to scare, nor is it recommended to take action in re-organizing your assets. It is intended for educational purposes only.
Calling a dead cat is a gutsy move, so often, most of those calls don't always play out. But analyzing real time price action and historical data is all we can do to help determine those potential moves.
I will try my best to keep this publish updated, and provide potential clues. So, when you do see other traders provide constant updates, please hit the BOOST button, as this requires a lot of dedication and time, and it shows that they care.
Key Take Away: Look for higher local highs to the 0.85 to void the dead cat, or a higher/equal low.
Thanks, and Good Luck!
- Not Financial Advice -

Solana: Below ResistanceOur primary scenario for Solana is that the coin is already close to the top of the green wave 4. Therefore, we expect a bearish trend reversal below the resistance at $192.33, followed by a move toward our blue Target Zone (coordinates: $56.56 – $29.87) with the green wave 5. Down there, we see an opportunity for long trades with the low of the blue wave (ii), which should be followed by a fresh upward impulse. According to our alternative scenario (probability: 38%), however, we may have already seen the low with wave alt.(ii) in blue prematurely. To validate this alternative scenario, the price would have to rise directly above the resistance at $192.33 from here and extend the blue wave alt.(iii) .
