SOL-USD 12h Chart ReviewHello everyone, let's look at the 12h SOL to USD chart, in this situation we can see how the price came out sideways from the downtrend line, then formed a downtrend channel, the exit from which gave a strong rebound creating a new uptrend.
Let's start by defining the targets for the near future that the price must face:
T1 = 172 USD
T2 = 195 USD
Т3 = 218 USD
Т4 = 252 USD
Now let's move on to the stop-loss in case the market continues to fall:
SL1 = 151 USD
SL2 = 130 USD
SL3 = 115 USD
SL4 = 96 USD
It is worth paying attention to the Stoch RSI indicator, where you can see how the current correction has strongly reacted on the indicator, which may give room for another stronger uptrend.
SOLANA trade ideas

$SOL rejecting resistance $50-75 targetSol looks to be rejecting resistance here, which sets it up for a large move lower.
I think it's likely that unless price can flip the resistance above as support, that we revisit the support levels.
Pretty simple chart. All of crypto looks the same, look out below.

SOLUSD: Can it hit $1000?Solana is heavily bullish on its 1D technical outlook (RSI = 67.130, MACD = 11.423, ADX = 35.600) and just last week only crossed over its 1W MA50 again. This rebound started exactly on the 1W MA200, after holding the HL trendline of the Bull Cycle. Last time SOL crossed above its 1W MA50 after a HL, was on September 25th 2023 and a +1,122% rally unfolded. If macro and fundamentals assist, SOL can repeat this and reach the 1k mark (TP = 1,000).
## If you like our free content follow our profile to get more daily ideas. ##
## Comments and likes are greatly appreciated. ##

Solana can we hit 186 from this correction ? Hey everyone
currently Solana made a nice correction and looks like if price action can confirm it making a higher high this could be a nice spot for everyone to possibly look at taking a nice long position to 186-191
Let me know what you think
Kris/Mindbloome Exchange
Trade Smarter / Live Better

Solana Potential UpsidesHey Traders, in today's trading session we are monitoring SOL/USDT for a buying opportunity around 157 zone, Solana is trading in an uptrend and currently is in a correction phase in which it is approaching the trend at 157 support and resistance area.
Trade safe, Joe.

Solana - This just faked out literally everybody!Solana - CRYPTO:SOLUSD - just faked out literally everybody:
(click chart above to see the in depth analysis👆🏻)
Over the course of the past 25 days, Solana dropped a significant -30% and wiped out a ton of bulls before creating a complete reversal. Especially with the current horizontal support level, bulls are taking over again, offering us another major crypto trading opportunity.
Levels to watch: $120, $250
Keep your long term vision!
Philip (BasicTrading)

SOL/USD At Key Resistance – Rejection in Play? Watch These LevelSolana is currently reacting to a major supply zone around $174 – $176, with signs of price exhaustion at the top.
Key Technical Zones:
Supply Zone: $173.44 – $176 (previous distribution zone)
First Support: $139.56 (prior breakout level)
Major Demand Zone: $103.29 – $116.41 (confluence of structure and demand imbalance)
Market Context:
Price formed a consolidation block below the supply before a fakeout.
The recent wick rejections indicate strong seller presence.
Upcoming U.S. economic data releases (marked with icons) could be the catalyst for volatility.
Trade Idea:
Bearish bias short-term if SOL fails to close above $176 with volume.
Short setup: Look for bearish confirmation and target $139.56 first, then $116.
Long re-entry zone: Consider buying only around $116–$103 zone, where institutional demand is likely.
Watch For:
Momentum shifts on the 1H/4H.
Strong red candle closure below $173.
Volatility spikes around upcoming news events.
Are you bearish or bullish on SOL this week? Drop your view below!

Solana (SOL) Rallies Above $162 Zone: Technical and FundamentalSolana (SOL) Rallies Above $162 Zone: A Technical and Fundamental Analysis of Its Path to $180 and Beyond
Solana (SOL), the high-performance blockchain network known for its lightning-fast transactions and scalable infrastructure, has once again captured the attention of cryptocurrency markets. After a fresh surge above the $162 psychological level, SOL price has entered a consolidation phase near $175, hinting at a potential breakout toward $180 and even $200. This article delves into the technical indicators, fundamental catalysts, and market sentiment driving Solana’s recent rally, while offering a balanced perspective on its short- and long-term prospects.
Technical Analysis: Rising Channel and Key Resistance Levels
1. Recent Price Action and Consolidation Phase
Solana’s price trajectory in recent weeks has been marked by volatility, but the broader trend remains bullish. On , SOL initiated a fresh upward move above the $155 and $162 zones, fueled by renewed investor confidence and macroeconomic tailwinds. The rally, however, faced resistance near $165, causing a temporary pullback.
SOL is trading near $175, consolidating gains after a 22% intraday surge. This consolidation phase aligns with the formation of a short-term rising channel on the hourly chart (data sourced from Kraken), with immediate support at $172. The channel’s upper boundary currently resides near $176, a critical resistance zone that, if breached, could trigger a fresh rally toward $180 and beyond.
2. Key Technical Indicators
• 100-Hourly Simple Moving Average (SMA): SOL price is currently trading below the 100-hour SMA, suggesting short-term bearish sentiment. However, a close above this level could signal a resumption of the uptrend.
• Relative Strength Index (RSI): The RSI on the hourly chart hovers near 50, indicating neutral momentum. A move above 60 would confirm bullish dominance.
• Volume Profile: Recent price spikes have been accompanied by elevated trading volumes, reinforcing the strength of the rally.
3. Bullish Scenario: Breaking $176 and Targeting $180
If Solana successfully clears the $176 resistance, the next immediate target would be the $180 psychological level, which coincides with the 200-day moving average. Analysts note that a sustained close above $180 could open the door to $200, driven by momentum traders and institutional inflows.
4. Bearish Scenario: Support at $172 and $165
Conversely, a breakdown below $172 would invalidate the rising channel pattern, exposing the $165 support zone. Further weakness could retest the $155 level, though this outcome appears less likely given the current bullish momentum.
________________________________________
Fundamental Drivers: 1inch Integration and Memecoin Frenzy
1. 1inch Network Integration: A Catalyst for Growth
One of the key fundamental catalysts behind Solana’s rally is its integration with 1inch Network, a decentralized exchange (DEX) aggregator and liquidity protocol. This partnership enhances Solana’s ecosystem by:
• Improving Liquidity: 1inch’s aggregation algorithms optimize trade execution on Solana-based DEXs, attracting traders and liquidity providers.
• Expanding Use Cases: The integration enables seamless cross-chain swaps, positioning Solana as a hub for multi-chain DeFi activity.
• Boosting Developer Activity: Increased infrastructure support could accelerate the launch of new decentralized applications (dApps) on Solana.
2. Memecoin Surge: The Role of Speculative Capital
Solana has emerged as a preferred platform for memecoin launches, driven by its low transaction fees and high throughput. Projects like SEED_DONKEYDAN_MARKET_CAP:BONK and NASDAQ:WEN have gained viral traction, drawing retail investors and creating a “fear of missing out” (FOMO). This speculative frenzy mirrors Ethereum’s memecoin boom in 2021–2022, with Solana’s faster and cheaper network offering a competitive edge.
3. Institutional and Retail Adoption
• Institutional Interest: Grayscale and other asset managers have added Solana to their crypto investment products, signaling growing institutional confidence.
• Retail Participation: On-chain data reveals a surge in small-cap wallet creations, indicating grassroots retail adoption.
________________________________________
Market Sentiment and Analyst Predictions
1. Bullish Outlook from Analysts
Technical analysts and on-chain experts have highlighted several factors supporting Solana’s bullish case:
• Accumulation by Whales: On-chain analytics firm Santiment reported a spike in large whale transactions, suggesting institutional accumulation.
• Network Activity Metrics: Solana’s daily active addresses and transaction volume have surged to 3-month highs, reflecting heightened network usage.
• Rare Chart Pattern: A “cup-and-handle” pattern on the daily chart implies potential for a 30–40% rally if resistance at $180 is cleared.
2. Skepticism and Risks
Critics argue that Solana’s rally is overextended, citing:
• Overbought RSI on Weekly Charts: The RSI currently resides near 75, signaling overbought conditions that could precede a correction.
• Competitive Pressure: Ethereum’s Layer 2 solutions (e.g., Arbitrum, Optimism) and rivals like Sui and Aptos continue to challenge Solana’s market share.
• Regulatory Risks: The SEC’s ongoing crackdown on crypto exchanges and tokens could dampen investor sentiment across the sector.
________________________________________
Future Projections: Path to $200 and Beyond
1. Short-Term Target: $180–$200
If Solana sustains its rally above $176, the next resistance zones to monitor are:
• $180: Psychological barrier and 200-day SMA.
• $190: Fibonacci extension level from the recent rally.
• $200: Historical resistance-turned-support from late 2023.
2. Long-Term Potential: $300+ in Q4 2024
Bullish scenarios envision SOL reaching $250–$300 by year-end, driven by:
• Spot SOL ETF Approvals: Regulatory greenlights in the U.S. could unlock billions in institutional inflows.
• AI and Web3 Integration: Solana’s partnership with AI projects (e.g., ChatGPT integration on Solana-based apps) could drive mainstream adoption.
• Bitcoin’s Bull Run: A broader crypto market rally, spurred by Bitcoin’s potential breakout above $80,000, would likely lift Solana’s price.
________________________________________
Risks and Challenges
1. Market-Wide Volatility
Cryptocurrencies remain highly correlated with macroeconomic factors, including U.S. interest rates and equity market performance. A sudden Federal Reserve pivot toward hawkish policy or a stock market crash could trigger a sector-wide sell-off.
2. Network Downtime and Security Risks
Solana has experienced periodic network outages and congestion during high demand. While the team has addressed these issues through upgrades, any future disruptions could erode trust.
3. Regulatory Uncertainty
The SEC’s classification of SOL as a security (vs. commodity) remains unresolved. Adverse regulatory rulings could impose restrictions on trading and staking.
________________________________________
Conclusion: Is Solana a Buy Ahead of the Next Leg Up?
Solana’s recent rally above $162 and consolidation near $175 underscores its resilience and growing appeal among traders and developers. Technical indicators, coupled with fundamental catalysts like 1inch integration and memecoin adoption, paint a bullish picture for SOL’s trajectory toward $180 and $200. However, investors must remain cautious of overbought conditions, competitive pressures, and regulatory risks.
For those considering exposure, a dollar-cost averaging (DCA) strategy could mitigate volatility risks, while close monitoring of on-chain metrics and macroeconomic trends will be critical. As with all investments in crypto, thorough research and risk management are paramount.
Disclaimer: This article is for informational purposes only and does not constitute financial advice. Cryptocurrency markets are highly volatile and speculative. Always consult a qualified professional before making investment decisions.

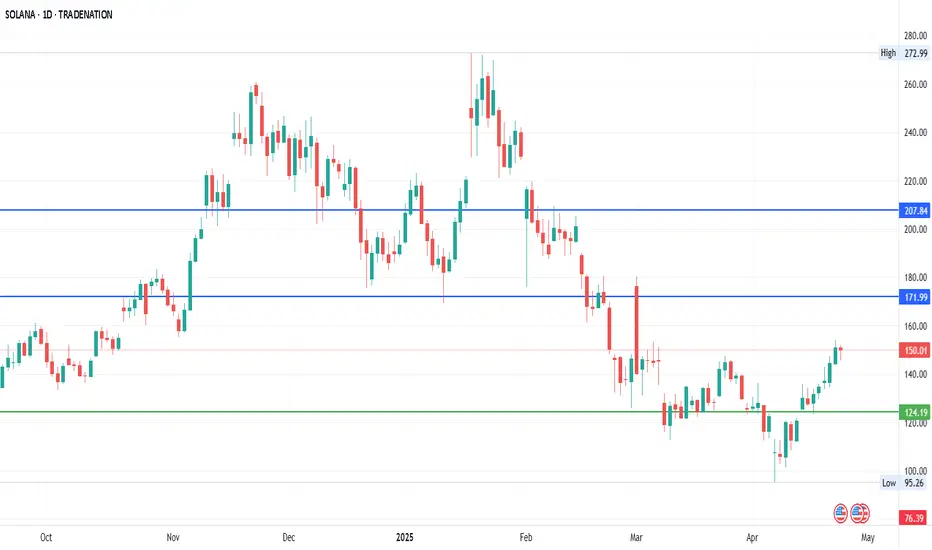
SolanaCurrent Price: 149
Upside Targets: 172 & 207.84
Downside Targets: 76.39 & 40.54
Resistance: 136.82 (It's already above this level)
Stop loss: 111.68
Weekly trading plan for SolanaIn this idea I marked the important levels for this week and considered a few scenarios of price performance
Locally, it is worth to consider risks in the $168-$169 zone
Write a comment with your coins & hit the like button and I will make an analysis for you
The author's opinion may differ from yours,
Consider your risks.
Wish you successful trades ! mura

Solana Found support at $169.0FenzoFx—Solana found support at $169.0, consolidating after its recent gains on Friday. The primary trend remains bullish above this level. Furthermore, the uptrend will likely resume if the price exceeds the immediate resistance level at $179.5. In this scenario, the next bullish target could be the $200.0 psychological level.
Please note that the bullish outlook should be invalidated if SOL/USD dips below $169.0.

SOLANA Hits Key Supply – Reversal or Rally? [Price Reaction ImmiSOL/USD | 1H Technical Outlook
Solana is trading inside a major supply zone (173.44 – 176), showing early signs of rejection. This level aligns with previous distribution activity. The question now: Will bulls absorb the sell pressure or get rejected hard?
Key Zones to Watch:
Supply Zone: 173.44 – 176 (current price range)
Immediate Support: 159.25 (recent breakout level)
Mid Support: 145.09 (price pivot + prior resistance)
Demand Zone: 131.33 – 126 (strong buy interest, heavy volume footprint)
Scenario Planning:
Breakout Traders: A solid close above 176 with volume could trigger an extended push higher.
Short Setup: Rejection candles or fakeouts in this range are prime short entries with targets at 159.25 and 145.
Buy the Dip: Strong reaction around 131.33 could offer a swing opportunity.
LuxAlgo Supply/Demand Zones are doing their job here—watch for a clean reaction. Plus, the U.S. economic calendar below could shake things up next week.

Solana (SOL) Breakout Alert: Technical UpdateSolana is currently confirming a bullish breakout on the 15-minute timeframe. Price action has decisively moved above the key resistance level at approximately $175.56, supported by strong volume and bullish momentum indicators.
Technical Context:
The breakout aligns with a broader macro rotation into altcoins, as indicated by declining Bitcoin dominance and a bullish ETH/BTC ratio.
On the 15-minute chart, price action is clearly above the Ichimoku Cloud, and the MACD indicator confirms bullish momentum.
RSI is currently in an overbought territory, suggesting caution and careful risk management despite the bullish breakout.
Trade Setup:
Entry: Confirmed breakout around current levels (~$175.94).
Stop-Loss: Set just below recent support at approximately $173.43 to manage downside risk effectively.
Take-Profit Targets:
Initial target at $180, corresponding to the next immediate supply zone.
Secondary extended target at the psychological resistance level of $200.
Risk Management Recommendations:
Given the overbought RSI, traders should closely monitor for potential bearish divergences or momentum exhaustion.
Consider moving the stop-loss to break-even once the price reaches the initial target ($180) to secure gains and manage risk.
This breakout presents a clear short-term bullish opportunity, but disciplined execution and vigilant risk management remain essential.
#SOL #CryptoTrading #TechnicalAnalysis #AltcoinSeason

$SOL just confirmed a perfect cup & handle breakout near $176.SOLANA: Best Setup Alert 🚨
CRYPTOCAP:SOL just confirmed a perfect cup & handle breakout near $176.
If history repeats, this could be the start of a massive rally.
Targeting $350–$500+ in the coming months.
Don’t sleep on this. ⚡📈


Very Bullish with a a clear Pullback incoming BINANCE:SOLUSDM2025
From the weekly chart we can clearly see that SOL has recovered quite nicely from the tariff scares the world markets have experienced in the last 2-3 months. We do have lowering Bullish volume over the last few weeks and we are approaching a weekly OB- (ICT Concepts) that was formed in the late February. I fully expect SOL price to spike into it, reverse for a good pullback to enter more longs and long term holdings and then continue higher from we clear $180.58 on the SOL/USD Binance chart 📈. Once that final level is cleared there is no stopping SOL until maybe the $250. If Bitcoin and the rest of the overall crypto markets remain Bullish for the rest of 2025 into January 2026 (seasonal tendency) SOL price could push to ALL Time Highs.

SOLANA... The next rising Star.Crossed the 38.2 Fib Rt . All cryptos flying. Lets see.
#Crypto
#Solana
#Bitcoin
#Trading

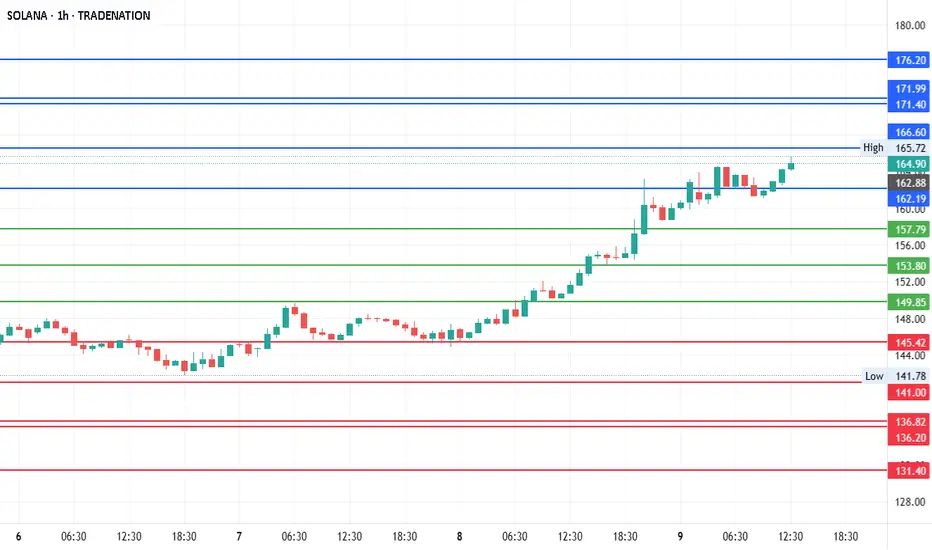
SOLUSD Ready for Pullback? Supply Zone Rejected Again!SOLUSD is currently trading around $171.91, testing a key supply zone marked by repeated rejections around $173.44. This area has acted as a strong resistance, and the recent wick rejection suggests potential exhaustion from buyers.
Key levels to watch:
Supply Zone: $171.50 – $173.50 (rejection zone)
Mid Support: $159.25 (potential bounce or consolidation zone)
Demand Zone: $140.50 – $145.50 (high-interest buy zone)
Bearish signs:
Price failed to close above supply range
Strong upper wick suggesting selling pressure
Momentum slowing as shown by recent candle formations
Potential Strategy:
Short from $172.50 with SL at $174.00
TP1: $159.50
TP2: $145.50 (demand re-entry zone)
Watch for a confirmed break of $159.25 with volume for stronger conviction.
This could be a short-term pullback in an overall bullish trend—trade carefully.
---
Chart Tags:
#SOLUSD #Solana #CryptoTrading #SupplyAndDemand #TechnicalAnalysis #PriceAction #TradingStrategy #BearishSignal #LuxAlgo #Crypto

$SOL - Long FractalCRYPTOCAP:SOL Fractal compared with CRYPTOCAP:BTC from 2024.
Do not fade Solana.
My top pick this cycle.
-@CryptoCurb

#Solana - Both Downside 1 and Up 1 target Hit!. What Next?
#Solana has achieved on both the sides of the initial targets and now it is moving towards the second target.
The levels marked in the chart is getting respected nicely.
Continue to watch this space.
Solana Wave Analysis – 9 May 2025- Solana is approaching the resistance level 177.50
- Likely to rise to resistance level 200.00
Solana cryptocurrency recently broke the resistance area between the resistance level 150.00 (which has been reversing the price from March) and the 61.8% Fibonacci correction of the downward impulse from the start of March.
The breakout of this resistance area accelerated the active short-term impulse wave c from the start of April, which belongs to wave B.
Solana can be expected to rise to the next resistance level 177.50 (previous monthly high from March) – the breakout of which can lead to further gains toward 200.00.

Solana: Another good buy opportunity on CryptoHello,
Another coin to look at keenly is the Solana. We see opportunity for this coin to rally also as investors begin getting the interest after the Bitcoin rally. From a technical view the coin is at the bottom of the correction as had been shown before. The MACD indicator is also close to 0 crossover further reinforcing our view.
Despite recent market volatility, Solana remains a fundamentally robust cryptocurrency. The recent announcement by President Donald Trump to establish official U.S. government cryptocurrency reserves has sparked intense discussion among industry experts. While this has contributed to short-term price fluctuations, it marks a pivotal moment for the crypto market. The formalization of U.S. crypto reserves signals growing governmental acceptance of digital assets, likely encouraging other nations to follow suit. This global shift is expected to drive substantial institutional capital into the market, boosting demand for high-quality assets like Solana.
For investors, now is the time to pay close attention to Solana. The combination of a fundamentally strong ecosystem, favorable technical indicators, and a shifting macroeconomic landscape creates a unique opportunity.
Disclosure: I am part of Trade Nation's Influencer program and receive a monthly fee for using their TradingView charts in my analysis.

Solana - Here Comes The Bullish Reversal!Solana ( CRYPTO:SOLUSD ) might head for new all time highs:
Click chart above to see the detailed analysis👆🏻
Just a couple of months ago, Solana perfectly retested the previous all time high and created an expected short term rejection. However, with the current major support area and a potential bullish reversal, Solana remains in a strong market, potentially heading for new all time highs.
Levels to watch: $120, $250
Keep your long term vision,
Philip (BasicTrading)
