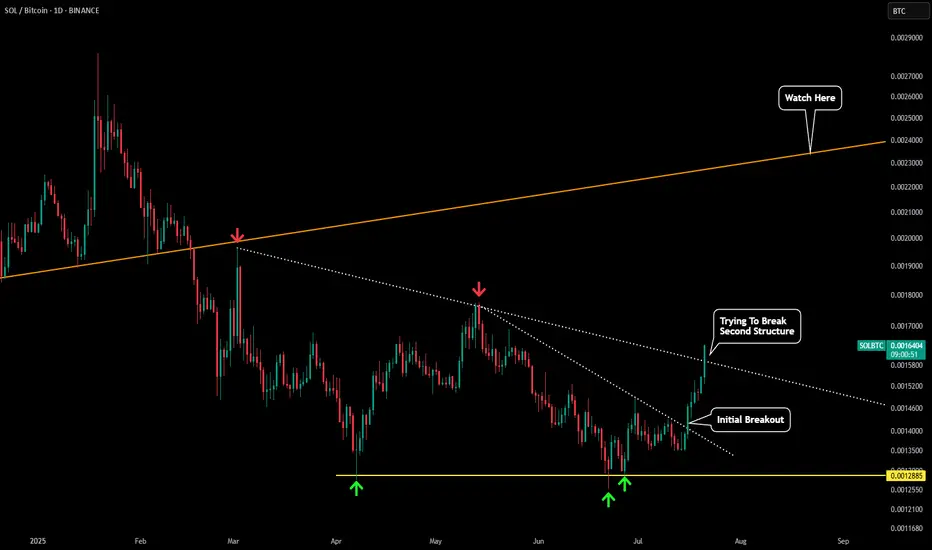
SOLBTC - Still Showing Strength Sol finally catching up to the recent momentum we have seen with other crypto assets such as BTC, ETH, and XRP.
Looking at the SOLBTC chart we can see that we are trying to breakout of the second resistance structure. As long as price does not close the daily below this trendline then it should act
Related coins
SOL/BTCI've been talking smack about SOL/BTC, because it has a gap below, and I just assumed that when BTC goes for $1M, Sol would get drained in sats. I have to admit though that it's holding up better than I thought. I've said in past posts that I predicted that about 20 coins will "hold in sats" whe

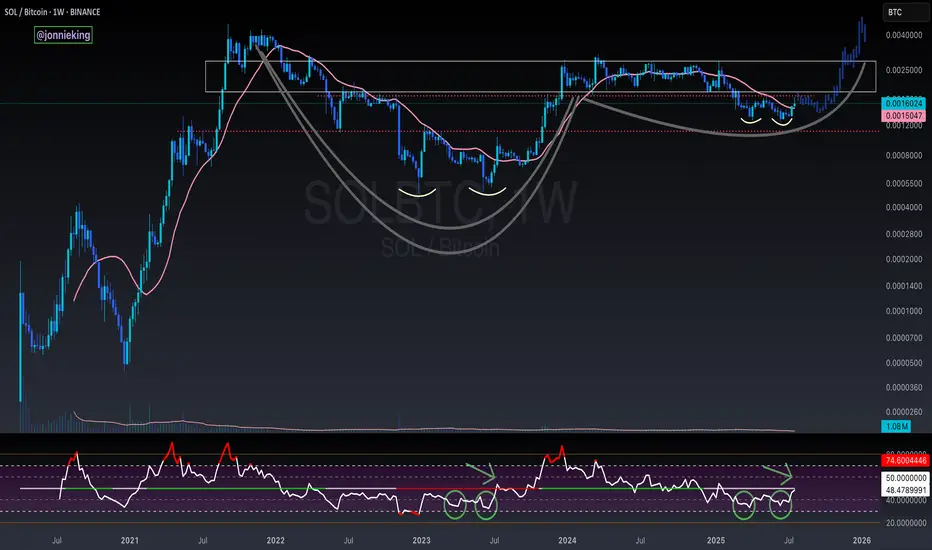
SOL / BTC Cup and Handle Weekly ChartBeautiful cup and handle on the SOL / BTC Weekly chart.
Need to break above the neckline and reclaim the POI.
Double bottom on the RSI matches just before the rip in July 2023.
$SOLBTC: Little strength to show for. In the crypto space we time and again regularly focus on the CRYPTOCAP:BTC and the CRYPTOCAP:BTC.D chart and we have time and again predicted that CRYPTOCAP:BTC.D will touch at least 66% in this Crypto cycle. This CRYPTOCAP:BTC Dominance can be interpreted not only as the CRYPTOCAP:BTC sup
Not clear path to SOLBTC but sqeeze higher more probableIt needs to break above 18000 for this to fulfill. Current QE scenario will help

SOL/BTC to All-Time-HighBTC dominance is over extended. Alt sentiment is bad. BTC sentiment is too high. Time for alt season and the best project in crypto, Solana, will win big.

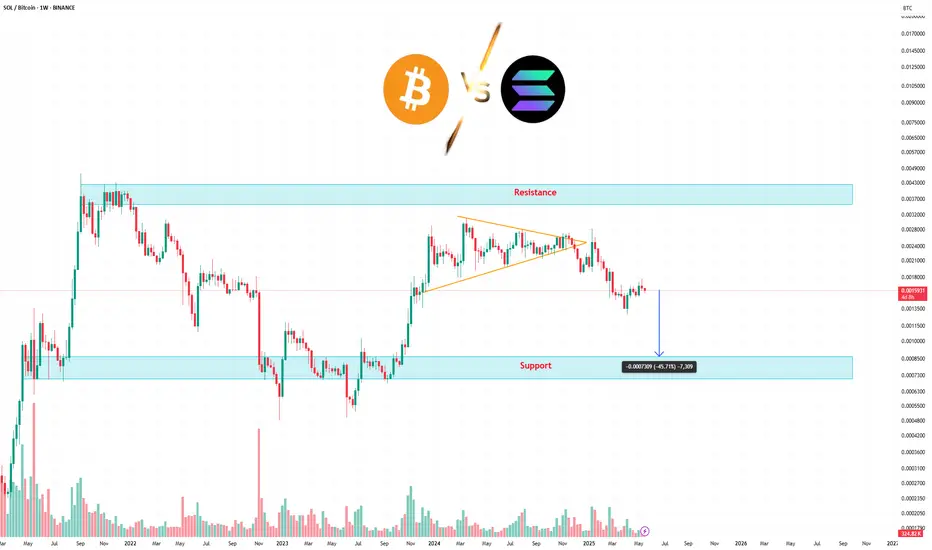
SOL losing strength vs BTC – bearish continuation?The chart shows a clear weakening of Solana against Bitcoin. After a prolonged sideways phase within a symmetrical triangle, price has broken down, signaling a potential bearish continuation.
🔻 Technical pattern:
Well-defined symmetrical triangle (orange lines) broken to the downside.
Breakdown o
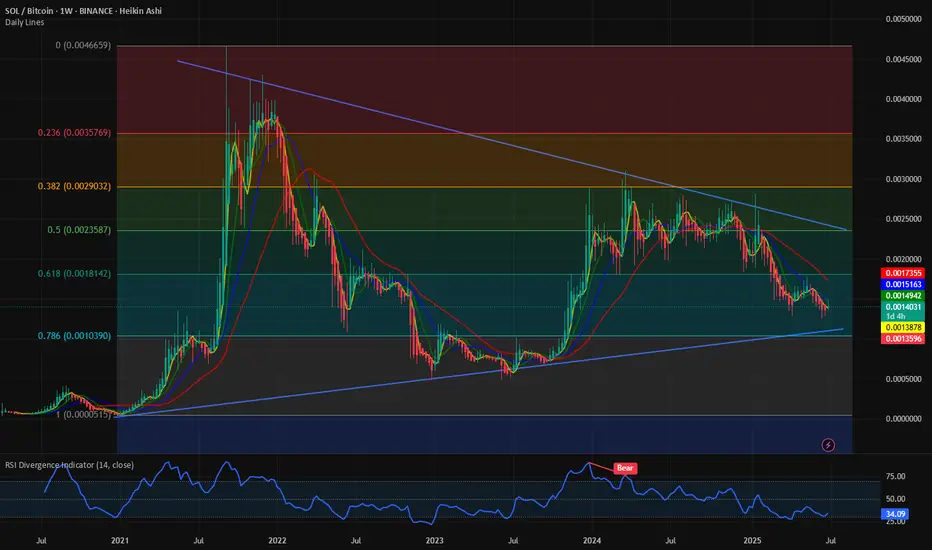
Sol Extremely Bullish FractalHi
Please click like
So this is as fractal from previous bull run in 2021, and used the same fibonacci targets for this bull run.
The chart here is SOLBTC, so if peak on this chart is 0.01BTC and BTC today is 100K =
SOL 1k.
If BTC peak is 200K -> Sol is 2K... etc.
----
This is a dreamy target

Solana Vs Bitcoin: New All-Time High In Late 2025Solana vs Bitcoin has not been bullish since March 2024 and is about to go bullish now after more than a year of no growth. It went sideways first and then it produced a crash but finally, the market found support.
What we have here is simply awesome because there is no better trade than to trade a

Sol/BTCHi, I wouldn’t want to be in Sol right now. It’s draining in sats. Janover wants to buy up Solano as a reserve asset, and become the “Strategy” of Sol. I think this is a major error in judgement, and the failure of such a ploy, a coin at #7 in the total marketcap, to put such a shitcoin up agai

See all ideas
Summarizing what the indicators are suggesting.
Oscillators
Neutral
SellBuy
Strong sellStrong buy
Strong sellSellNeutralBuyStrong buy
Oscillators
Neutral
SellBuy
Strong sellStrong buy
Strong sellSellNeutralBuyStrong buy
Summary
Neutral
SellBuy
Strong sellStrong buy
Strong sellSellNeutralBuyStrong buy
Summary
Neutral
SellBuy
Strong sellStrong buy
Strong sellSellNeutralBuyStrong buy
Summary
Neutral
SellBuy
Strong sellStrong buy
Strong sellSellNeutralBuyStrong buy
Moving Averages
Neutral
SellBuy
Strong sellStrong buy
Strong sellSellNeutralBuyStrong buy
Moving Averages
Neutral
SellBuy
Strong sellStrong buy
Strong sellSellNeutralBuyStrong buy
Displays a symbol's price movements over previous years to identify recurring trends.