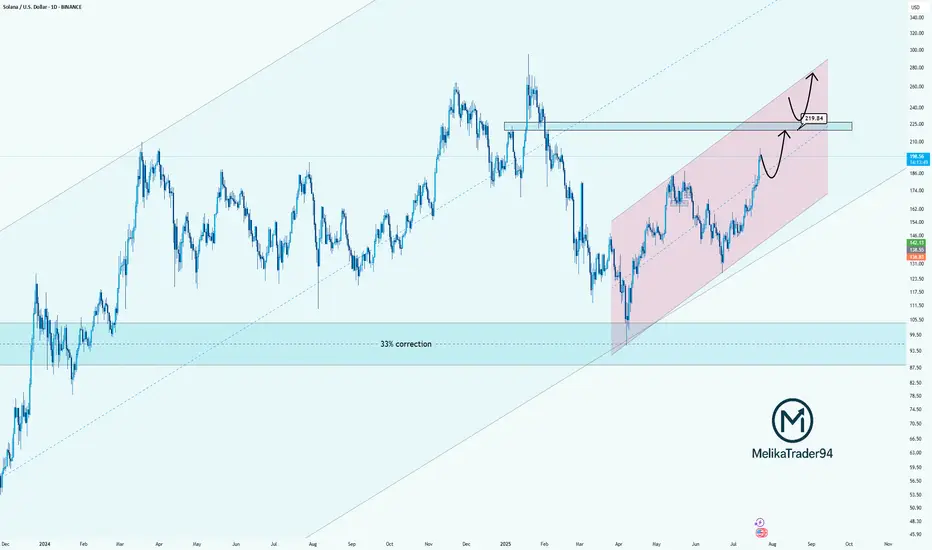
Solana Approaching Key Resistance: watch for $219Hello guys!
Solana has been trending strongly inside a rising parallel channel, recovering steadily after a significant 33% correction. The bullish momentum is clear, and the price is now approaching a key resistance zone near $219.84, which previously acted as a major turning point.
Here’s what I
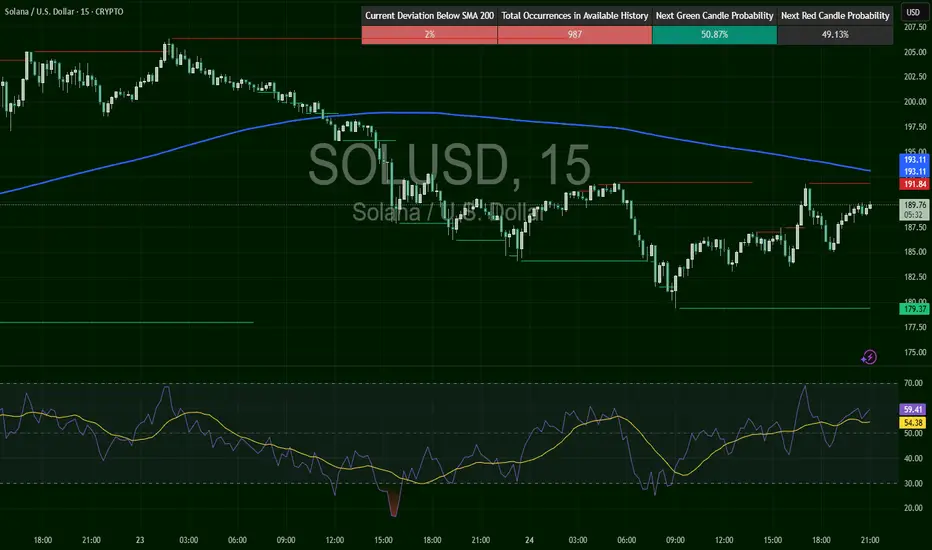
SOLUSD – Recovery Faces Wall at $193SOL broke below $198, hitting a low near $179, confirming the short trigger from the last setup. Since then, it’s building a grind-recovery, reclaiming $189 but stalling at a confluence zone ($191.84 resistance and SMA200 near $193.11). RSI at 59.41 still favors buyers — but SOL needs a clean break
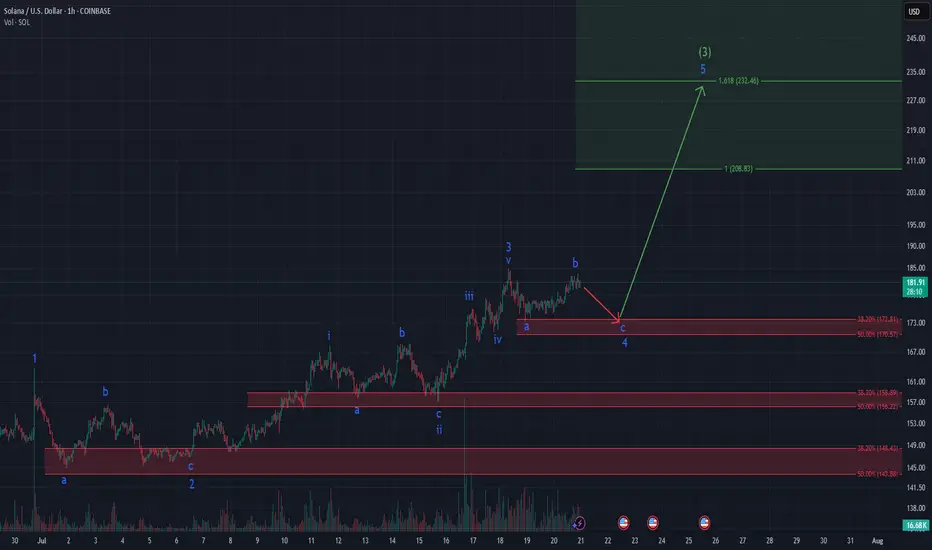
SOLANA ready for Explosion? Textbook Elliott Setup unfoldingSolana – Textbook Elliott Wave Structure Unfolding!
Clear impulsive fractals, textbook ABC corrections, and precise Fibonacci reactions – this 1h chart on CRYPTOCAP:SOL is a dream for any Elliottician.
We’re currently finishing wave C of (4) within a well-formed bullish impulse. Key support lies
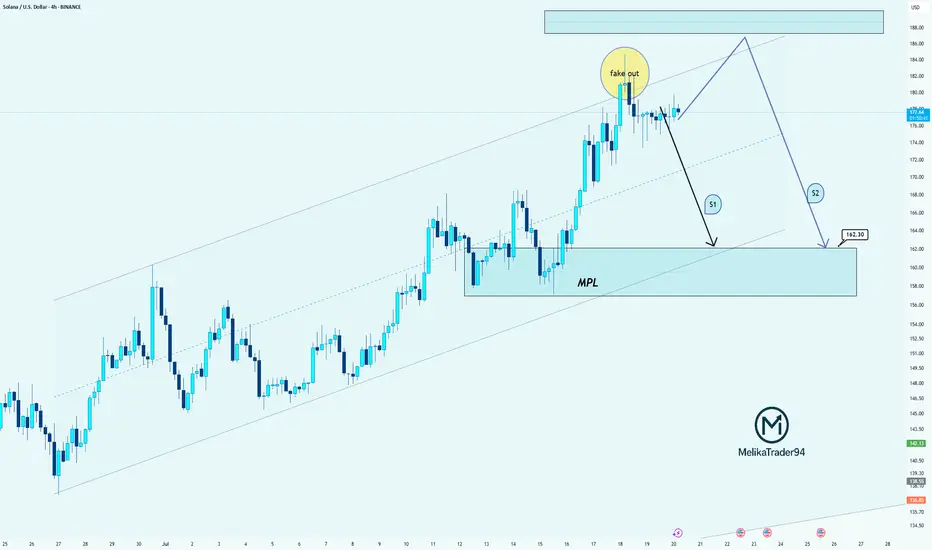
SOL: Clean Fakeout & Two Bearish Scenarios AheadHello guys!
Price just created a textbook fakeout above the resistance zone, grabbing liquidity and quickly dropping back into the range!
Here’s what the chart is showing:
Price is still inside the ascending channel, but the breakout attempt failed
The MPL (maximum pain level) around $162.30 is
Very Bullish!!
Solana chart looks very bullish. The price is currently dropping but I think it is a very healthy correction.
Weekly chart:
1) all momentum indicators just entered the bull zone.
2) The chart is forming higher highs.
Daily:
1) EMA55 finally crossed EMA200. The last time they crossed w

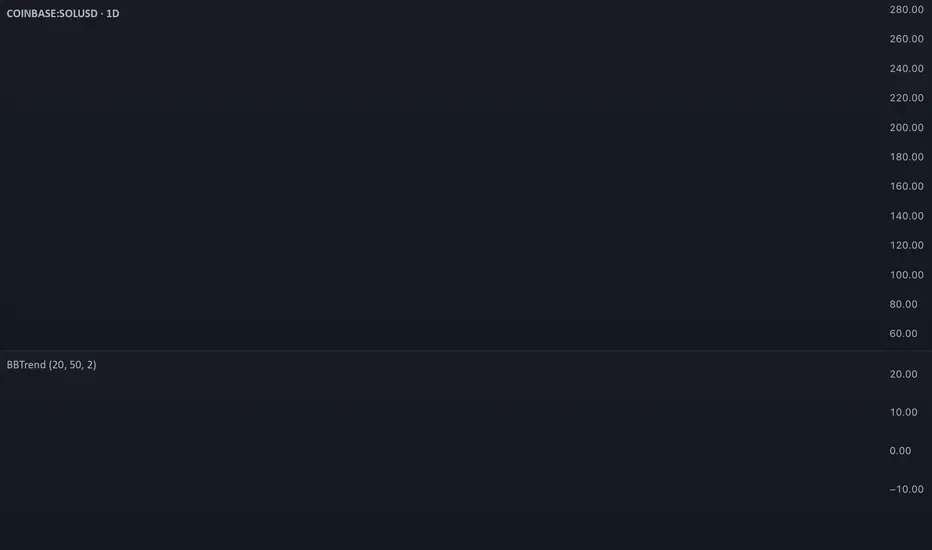
SOL Traders Begin Taking Profits Despite Bullish RallySolana (SOL) continues to climb, but under the surface, signs of selling pressure are starting to emerge. While price action has been bullish and on-chain activity remains strong, the BBTrend indicator is flashing red — literally. For the past three days, its histogram bars have turned red and gradu
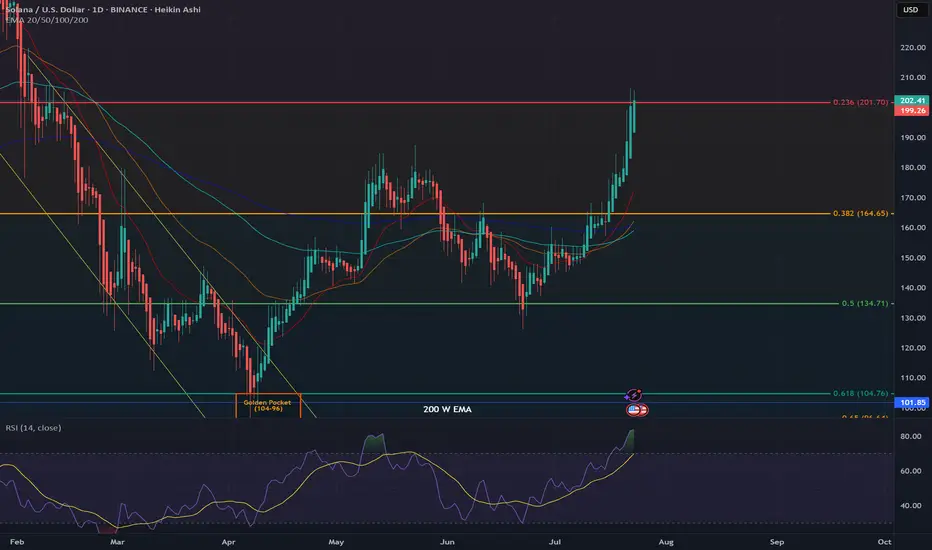
SOL key resistance 201We are reaching a key level in the fib retracement which sits at 201 USD. With the daily RSI being in the overbought area, I would expect a pullback to 180 or 165. DYOR, would love to hear your thought
SOLUSD at Strong SUPPORT SOLUSD was trading down trend the and is current at the support which was its resistance earlier and this is a strong support and expect further growth or up movement of for SOL. 2010-215.

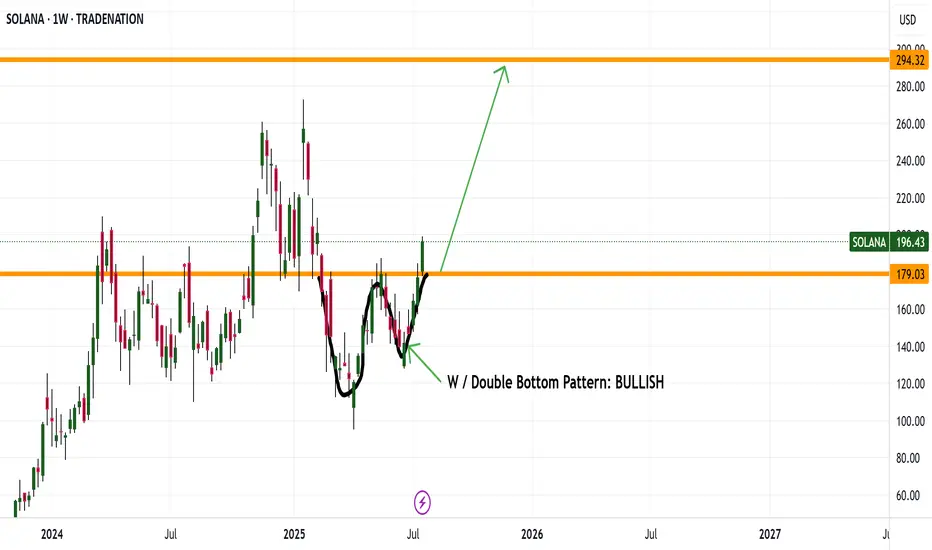
SOLANA DRIVING UP TO 294 Good evening everyone
It looks like SOL made a nice W pattern and now breaking its weekly high is driving up to 294
Enjoy happy trading this bull run
Kris/ Mindbloome Exchange
Trader Smarter Live Better
20:1 R:R for SolanaTaking a chance on this super high-risk setup with a 20:1 R:R before it takes off.
Entry: 177.78
Stop Loss: 173
Target: 260

See all ideas
Summarizing what the indicators are suggesting.
Oscillators
Neutral
SellBuy
Strong sellStrong buy
Strong sellSellNeutralBuyStrong buy
Oscillators
Neutral
SellBuy
Strong sellStrong buy
Strong sellSellNeutralBuyStrong buy
Summary
Neutral
SellBuy
Strong sellStrong buy
Strong sellSellNeutralBuyStrong buy
Summary
Neutral
SellBuy
Strong sellStrong buy
Strong sellSellNeutralBuyStrong buy
Summary
Neutral
SellBuy
Strong sellStrong buy
Strong sellSellNeutralBuyStrong buy
Moving Averages
Neutral
SellBuy
Strong sellStrong buy
Strong sellSellNeutralBuyStrong buy
Moving Averages
Neutral
SellBuy
Strong sellStrong buy
Strong sellSellNeutralBuyStrong buy
Displays a symbol's price movements over previous years to identify recurring trends.
Curated watchlists where SOLUSD.P is featured.

Gen 3 crypto: A new day dawns…
25 No. of Symbols

Smart contracts: Make the smart decision
36 No. of Symbols

Staking Coins: Pick up a stake
18 No. of Symbols

Top altcoins: Choose your alternatives carefully
28 No. of Symbols

Up-and-coming crypto: New kids on the block
30 No. of Symbols
See all sparks