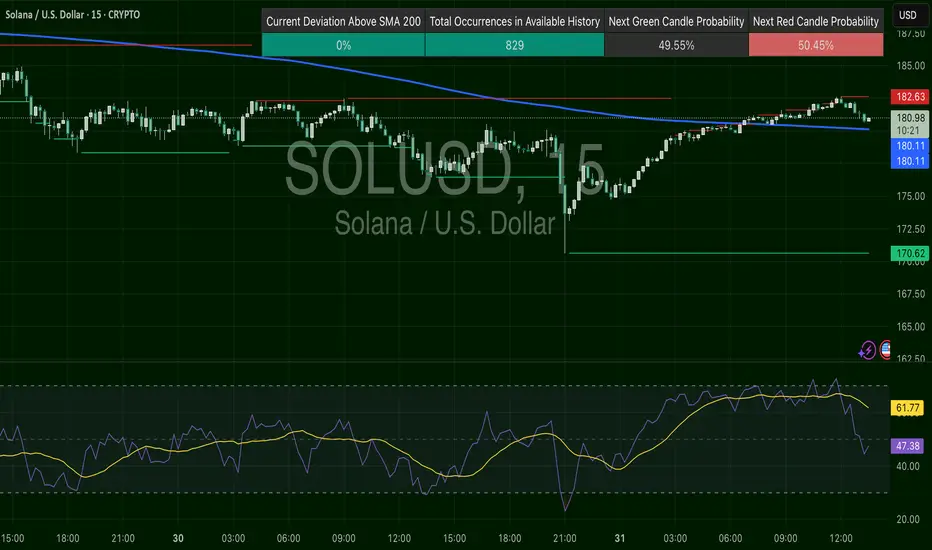
SOLUSD – Faded Highs, Now RetestingSOL recovered off the $170–172 lows and is now testing $182.63 resistance. RSI was high and now cooling off (~47), suggesting momentum is slowing. Still trading just over the 200 SMA, this is a breakout pullback zone. $180.13 is the key level to stay above.
Very Bullish!!
Solana chart looks very bullish. The price is currently dropping but I think it is a very healthy correction.
Weekly chart:
1) all momentum indicators just entered the bull zone.
2) The chart is forming higher highs.
Daily:
1) EMA55 finally crossed EMA200. The last time they crossed w

SOLUSD at Major support SOLUSD has reached major support from here we may see a good pullback. Let us see how it plays out.
Solana coin Long setupIn this video I go through the current price action and talk about how the 126$ target level was recently reached for a clean long entry and on the daily timeframe we printed a higher low .
I expand on my thoughts for a continuation to the upside and to retest some higher levels of resistance 180

SOL/USD Last Level before $143Using a simple fib retracement from June Low to July High, mid 150s is a good buy after we lost $165, but it all depends on BTC. If BTC loses 112k-110, we are going to $140s and potentially the June low. God Speed

SolSolana is currently in a correction phase, and a strong demand is forming near the 151 area.
As per the rules, the market should ideally start buying from here.

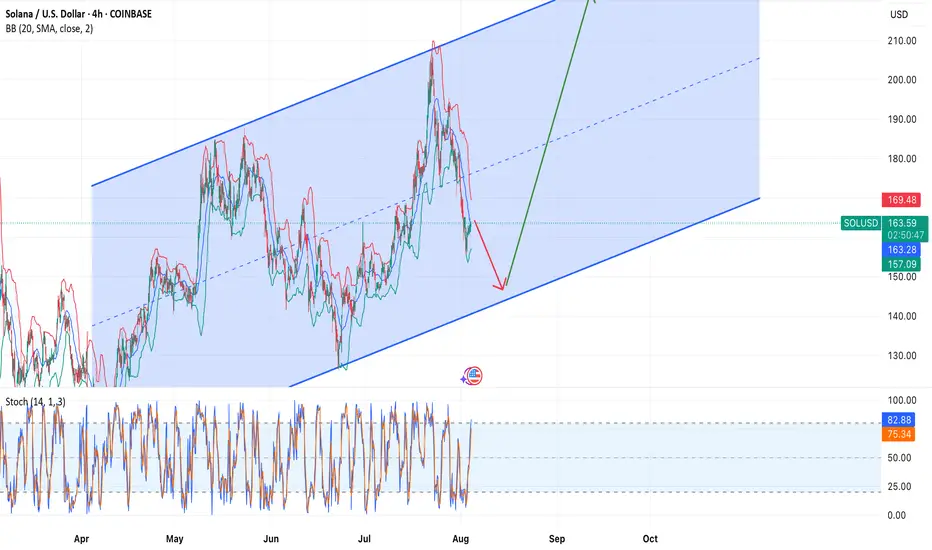
Solanawe can see price, going in perfect channels all price level are golden levels, So we look to buy dip between 137 and 145, next target will be 220$

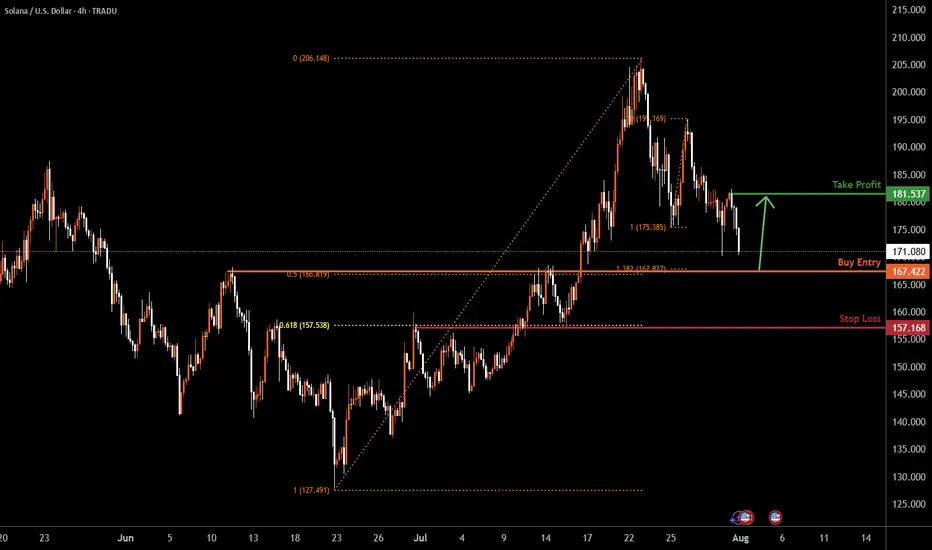
SOLUSD H4 | Bullish bounceBased on the H4 chart analysis, the price could fall to the buy entry, which acts as a pullback support that aligns with the 50% Fibonacci retracement and the 138.2% Fibonacci extension and could bounce to the upside.
Buy entry is at 167.42, which is a pullback support that aligns with the 50% Fibo
SOLANA BULLISH MEGAPHONE PATTERN LOADING! solana continues to move step by step towards higher levels within the bullish megaphone pattern, which will make movements towards ATH and more inevitable in the coming period

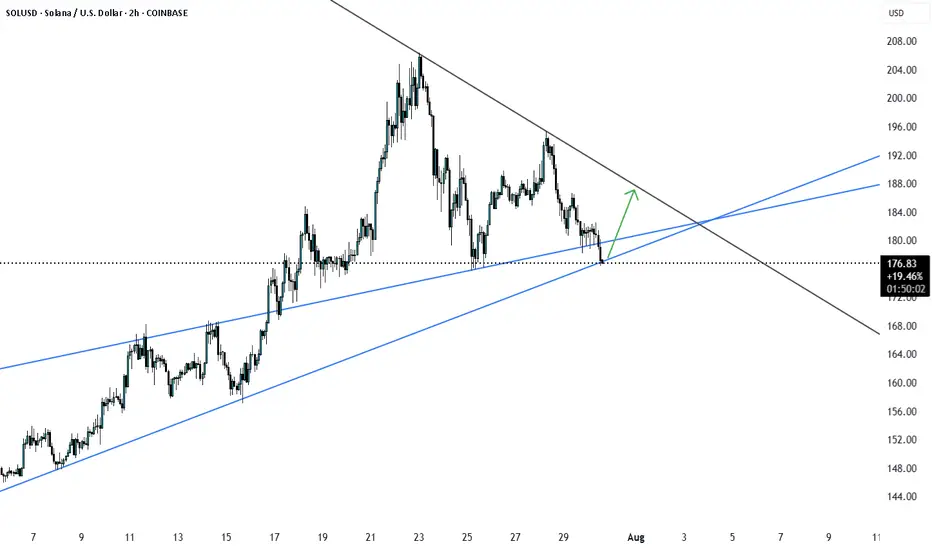
Solana — Buy Now or Wait for a Pullback to Channel Support?Overview:
The COINBASE:SOLUSD price is moving within a steady ascending channel. Currently, the asset is near the midline, and the trader faces a choice:
📌 Enter a long position now or
📌 Wait for a pullback to the lower channel boundary (~150–153) for a more optimal entry point.
Technical Setup:
See all ideas
Curated watchlists where SOLUSD.P is featured.

Gen 3 crypto: A new day dawns…
25 No. of Symbols

Smart contracts: Make the smart decision
36 No. of Symbols

Staking Coins: Pick up a stake
18 No. of Symbols

Top altcoins: Choose your alternatives carefully
28 No. of Symbols

Up-and-coming crypto: New kids on the block
30 No. of Symbols
See all sparks