SOL/USDT - Bullish setup signal (Multi-Timeframe-Confluence)Bullish bias for SOL based on falling wedge breakout potential supported by favorable multi-timeframe EMA alignment
Falling Wedge pattern detected on the weekly chart
✅ EMA (20) Levels
Daily EMA(20): 170.17
Weekly EMA(20): 162.80
Monthly EMA(20): 144.53
✅ RSI crossing/holding above 50 on daily
🎯 Trade Plan Idea:
Entry: Around 170.17
Stop-loss: Below wedge low or under 162.80 (Weekly EMA)
Target Zones:
179-180 — first key resistance
190.00–200.00 — wedge measured move target
Not financial advice.
SOLUSD trade ideas

Solana to the moonfor taday's position , i went long on soalana, as it shows a key level at this price 158 ;
the profit percentage for the TP1 is way begiier that my risk; willing to have a 5 to 1
and if the trend continue, i will raise the lot until 187 as a TP3

SOL/USD – Solana is Sitting on a Major Decision Point! Solana just tapped into a high-volume demand zone between $152 – $160, where buyers previously defended price. Volume is rising as we test this key area again. This could be the final flush before a move higher.
---
🔍 What’s Likely Next?
🔼 Bullish Outlook:
If SOL holds above $152.86, watch for a bounce to $168.51, followed by a potential break toward $183.18 where the supply zone is waiting.
🔻 Bearish Breakdown:
A close below $152.86 could trigger more selling, especially with USD-based volatility ahead (watch the macro events between June 3–7).
---
🧠 Market Psychology:
We’ve seen multiple rejections near $183, but also strong accumulation on dips. This looks like a textbook Wyckoff-style accumulation phase. Smart money could be loading up before the next leg.
---
🎯 My Trading Plan:
✅ Entering long at demand zone
🎯 Targets: $168.5 and $183+
❌ Stop loss: Just below $152
---
💬 Your Turn!
Do you see a bounce coming or will SOL drop further from here?
👇 Share your analysis in the comments!
🔁 Like & Follow @FrankFx14 for more powerful setups like this one daily!
---
#SOL #Solana #Altcoins #CryptoTrading #TradingView #TechnicalAnalysis #LuxAlgo #PriceAction #BuyTheDip #CryptoSignals

Weekly trading plan for SolanaIn this idea I marked the important levels for this week and considered a few scenarios of price performance
The situation is similar to BTC & ETH, not a big correction, but the RSI already shows a local bearish divergence. Therefore, it is possible to see a correction before further growth
Write a comment with your coins & hit the like button and I will make an analysis for you
The author's opinion may differ from yours,
Consider your risks.
Wish you successful trades ! mura

Quick Short expected until reaching the support areaHi Family. Here is a quick Short expectation from my perspective, until reaching the support area arount 165-164.
Please trade carefully using stop loss
Big up, no financial advice ! Make your own decision and risk management

SOLUSD : Update Using 30 min chart. 🔍 Solana (SOLUSD) – Confluence Analysis (30-Min Chart)
This chart represents a bullish confluence zone backed by Smart Money Concepts (SMC), Fibonacci levels, Fair Value Gaps (FVGs), and Order Blocks. Here's a detailed breakdown of the confluence logic:
🔑 Key Confluences:
1. FVG and OB Reclaim in Premium Zone
Price reclaimed a premium FVG zone (between ~$175.70 and $177.30).
This reclaim, combined with the Bullish CHoCH and BOS structure, signals institutional interest.
A retest of this zone is likely to act as a springboard toward the next premium levels.
2. Fibonacci Confluence
Multiple Fibonacci levels are stacked:
0.618 - 0.786 retracement zone aligned with equilibrium near $176–177.
1.618 extension target at $187.53.
2.618–4.236 long-term extensions project a move toward $205.06–$211.85.
This supports a measured move projection of:
🎯 Target 1: $184
🎯 Target 2: $205–211 (21.83% gain from current level)
3. Equilibrium & Discount Zone
Price bounced from the discount zone and retested the equilibrium.
Indicates ideal entry area from Smart Money Concepts (where institutions load up).
Yellow box ($168.51–$175.70) marks optimal risk-reward entries.
4. Volume Confirmation
Rising volume beneath the bullish candle structure adds validity to the breakout potential.
5. ORB (Opening Range Breakout) Bias
Label "ORB (15, 0930-0945)" implies a bullish ORB setup, likely used to structure intraday momentum.
If today’s open maintains above $175.70, the ORB bias confirms upside continuation.
🧠 Summary:
Component Value
Current Price $177.32
Entry Zone $175.70–$177.30 (Equilibrium/FVG)
Invalidated Below $168.51 (OB/SMC invalidation)
Target 1 (TP1) $184.00
Target 2 (TP2) $205.06–211.85 (Fib/SMC)
Reward:Risk (est.) 5.3R (if SL near 168.5, TP near 205)
✅ Trade Plan (Hypothetical)
Entry: $175.70–$177.30
Stop Loss: $168.00 (below OB + structural invalidation)
Take Profit:
TP1: $184
TP2: $205.06
TP3 (Fib 4.236): $211.85
📘 Macro Note:
If BTC maintains risk-on momentum and SOL holds above $175, this setup has high confluence for continuation into mid-$180s, with $200+ psychological magnet likely if macro liquidity improves.

Solana Long entry After a 100% move to the upside Solana is slowly cooling off its run and heading back down to some key areas of support .
In this video I highlight where I think those reaction zones are and what I expect to see Long term from Solana .
Set alerts and be sure to monitor BTC which will give you the additional confluence of understanding why the alt coins are behaving Bearish/bullish.
Tools used in this video TR Pocket / Fibs / Volume Profile /
Any Questions feel free to ask in the comments

Technical InsightsAnalysts have identified a potential "cup-and-handle" pattern in SOL's price chart, suggesting a possible rally towards $4,500 if the pattern completes successfully.

SOLUSD 162 TargetMACD histogram has flipped green → early strength. bearish divergence, 162-167 possible.

SolanaSol usdt Daily analysis
Time frame daily
Risk rewards ratio >3.5 👈👌
Target 248$
Green line is a historical up trend for solana

How low can Solana go?SOL is potentially creating a local low around $150. If buyers step in and price holds these levels, we could see a reversal, reclaiming previous support around $160.
A rejection from $160 and breaking this week's lows ($150) could signal a retest of previous levels from $130 - $140.
My personal instinct is still weary of the fact that price has been rejected twice from the 1D 200MA, potentially signaling even further weakness for SOL.

Red Sea as Sellers Overcomes Buyers pishing price downUS has been seeing momentum through this Trade War fueled by Trump,Solana Coin has fallen as Predicted 💯💰


Weekly trading plan for Solana In this idea I marked the important levels for this week and considered a few scenarios of price performance
The price is near the Pivot point, we can also see a trend line from which the price has already bounced, so if it is broken, we can expect a deep correction
Write a comment with your coins & hit the like button and I will make an analysis for you
The author's opinion may differ from yours,
Consider your risks.
Wish you successful trades ! mura

Solana(based on NEowave)I consider this as a triangle but under the price zone which is 139 it tells us its going to make a diamond diametrical.

Short term SHORTS ON SOLANAAs price is approaching Supply(1hr FTR), I'm anticipating a sell right to the next DEMAND

#SOLANA MAKE A CHANCE solusd give descending candlestick pattern, through the trand line. You just wait for confirmation for catching the trand.

Solana will be king again. Solana's fate will be decided this summer. The only coin rising in a giant triangle will either go to $ 400 or leave us like ETH. 274 and then $ 400 is very likely.

The good news for solana lovers According my estimated forecast at 13 Jon 2025 solana will reach to 285 $ of price.
Powerfully potentially it's happening to new alt season and all of the chain tokens getting the same upward percentage.
According to the last wether of solana chain upwards it's maybe happening very faster than the others alt coins.
SOLANA Fractal Solana is currently in a fractal consolidation. Once it double tops it'll drop down one last time to gain momentum and break to 418.

Open long when this happens...My bias for Solana is very bullish. But the current price set up is very similar to April 2022 when the price started to have a major downside move. (See blue vertical line in the chart)
Similarities between April 2022 and today's chart set up in the daily chart:
1) The price moved from the peak (Historical all time high) to trough in the descending parallel channel over four months.
2) The price finally moved out of the the channel and decisively moved up to the major support resistance line (see red horizontal line)
3) Both RSI and MACD have moved way above the overbought territory and the lines are crossed to the downside.
4) EMA21 has crossed above EMA 55, but the EMA200 is still above EMA21 and 55.5) The price has moved and closed above all EMAs but it is pulling back.
I have already finished spot buying at a much lower price point, but I am now looking for a long trading opportunity if the parabolic run is going to happen.
The set-ups for a long trade that I am waiting for are:
1) EMA 22 and EMA 55 are to move above EMA 200.
2) The price to pull back to EMAs and move up and close above EMA 21.
3) RSI and MACD to come back to at least 0 if not below 0 and start to move to the upside.
The set up where the orange vertical line in the chart is a good example of a sort of entry set up described above.

2 Year Pivot PongSOL and many other crypto coins often react at pivot points. I use 1-year (Thinnest), 2-year (medium), and 3-year (Thickest) pivot points for trade entries and targets.
For this trade, the negative linear regression trend on the 2-day is ending as the yellow line at the bottom of the linear regression trend has terminated as it approaches the middle moving average in the Fibonacci Bollinger band. Typically, I would enter trades in the bottom half of the Bollinger band area but SOL is in such demand it rarely ever gets below the mid point.
You can see that SOL heavily reacts to the 2-year pivots as indicated in the circled areas. I am using the current price for a long entry.
The target price is $267, which is the next resistance level of the 2-year pivot points. At $267, a trailing stop will trigger, which will allow the price to run further while locking in gains we've already made when there are retracements.
Risk management:
I am setting a stop loss at $150, just below the 3-year pivot and the Bollinger MA, which are both acting as support and should move the price upward on any retracement from current levels.

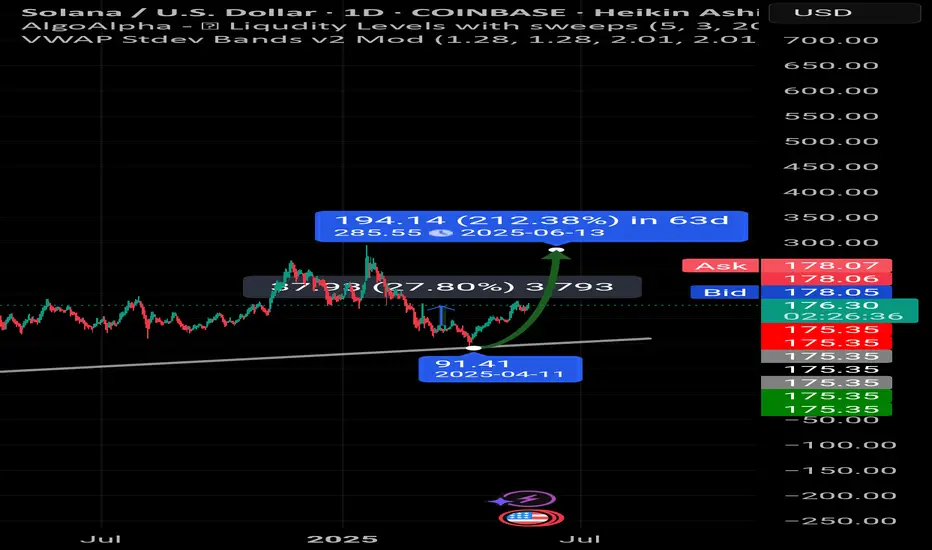
SOLUSD Trend Analysis DAY TF BUY The provided chart and analysis outline a bullish outlook for SOL/USD (Solana against the US Dollar) as of May 26, 2025. The current price is noted at **177.71**,
with a strong recommendation to look for long/buy entries, particularly on dips. The analysis emphasizes long-term holding for optimal results, with three key profit targets: **TP1: 194.00, TP2: 227.00, and TP3: 252.00**.
**Key Observations from the Chart**
1. **Long-Term Bullish Trend**: The analysis highlights that Solana’s long-run trajectory has significant upside potential. The suggested strategy involves accumulating positions gradually, especially during price retracements, to maximize gains over time.
2. **Green Zone as Critical Support**: The chart indicates a "green zone," which acts as a crucial support area. If the price crosses below this zone and closes a candle beneath it, the bullish setup becomes invalid, signaling a potential trend reversal or deeper correction.
3. **Risk Management**: Traders are advised to exercise caution by using smaller quantities on each dip and conducting due diligence before entering trades. This approach minimizes risk while capitalizing on upward momentum.
