Sol turning bearish!Sol swept the highs but failed (which was a short signal). Marked zones are the bounce levels, first zone has been tapped already with bounce, now it is showing weakness in the zone, next zones are untapped, so a bounce at marked levels is highly likely, however if first zone breaks, I will look for swing short.
In short, marked zones are good for long, if broken, we can look for short at the bounce.
SOLUSD trade ideas

W for the WIN!COINBASE:SOLUSD - Like BTC - Zoom out to the 4 HR and you see a CLEAR half W formation from November - election time- to now. With FEB being historically THE MOST BULLISH month but being total crap til now - and 14 days left as of tomorrow - I am thinking the rest of this W plays out. I think we see a sharp market wide reversal with SOL leading the way to revisit previous ATH of 265 and hopefully possibly 295 and beyond. We will see how it plays out. Good luck and trade smart folks. Total speculation here no advice.
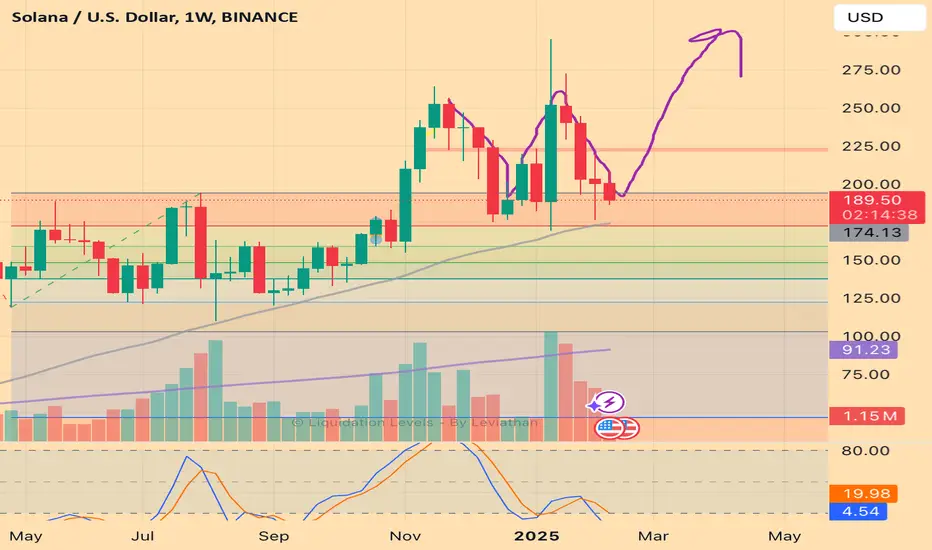
SOLANA outlook The Week Ahead 17th Feb 25SOLANA price action sentiment appears bullish, supported by the longer-term prevailing uptrend. The recent intraday price action appears to be a sideways consolidation towards the rising support trendline zone.
The key trading level is at 175.00 level, the previous consolidation price range and also the rising support trendline zone. A corrective pullback from the current levels and a bullish bounce back from the 175.00 level could target the upside resistance at 221.20 (20 Day Moving Average) followed by the 242.80 and 260.60 levels over the longer timeframe.
Alternatively, a confirmed loss of the 175.00 support and a daily close below that level would negate the bullish outlook opening the way for a further retracement and a retest of 155.50 support level followed by 136.99.
This communication is for informational purposes only and should not be viewed as any form of recommendation as to a particular course of action or as investment advice. It is not intended as an offer or solicitation for the purchase or sale of any financial instrument or as an official confirmation of any transaction. Opinions, estimates and assumptions expressed herein are made as of the date of this communication and are subject to change without notice. This communication has been prepared based upon information, including market prices, data and other information, believed to be reliable; however, Trade Nation does not warrant its completeness or accuracy. All market prices and market data contained in or attached to this communication are indicative and subject to change without notice.

SOLANA, NEED PUSH ? THEN WHAT WILL BE THE AVG. PRICE ?As per chart price hovering in support but between a range.
CRYPTOCAP:SOL buyers holding money. Need new buyer's ?

#Solana ! What do you think ?As per the chart price are struggling so far. Almost look sideways fo investors not for Intraday traders. Keep eye 👀 on SOLA-ANA.
🪙
#solana

Scalping & Mid-Term Analysis for SolanaMarket Overview:
Trend: Solana is holding above key support, but resistance remains strong.
Key Levels:
Resistance: ~$200 - $205
Support: ~$190 - $194 (weak), $180 (stronger)
Indicators:
MACD: Bearish momentum slowing, but no clear bullish reversal yet.
EMA: SOL is testing the 50 EMA – a breakout could push higher.
RSI: ~44, still in neutral zone, meaning price can move either way.
🔥 Scalping Strategy:
🩸 1. Range Scalping (Short-Term Play)
Why? SOL is consolidating between support and resistance with no clear trend.
How?
Buy near $190 - $194, scalp to $200 - $205.
Sell near $200 - $205, as resistance remains strong.
Stop-loss below $188, as a breakdown could accelerate.
🩸 2. Breakout Scalping (If Trend Resumes)
Trigger: Break above $205 or below $190.
Execution:
If SOL breaks $205, scalp long targeting $215 - $220.
If SOL drops below $190, scalp short to $180.
🩸 3. EMA Scalping
Why? SOL is hovering near the 50 EMA, meaning a strong move is coming.
Execution:
Buy near EMA (~$194 - $195) if price bounces.
Short only if SOL fails to reclaim $200 and drops below EMA.
🔥 Mid-Term Trend Forecast (1-3 Weeks)
Bias: Neutral → Bullish if $205 breaks
Why?
SOL is holding key support but needs volume to break higher.
A move above $205 could trigger a rally toward $215 - $220.
Failure to hold $190 will likely lead to a drop toward $180.
Only a strong breakout above $215 confirms bullish continuation.
🔥 News & Market Context:
Solana remains strong fundamentally, but price needs a catalyst for momentum.
Whales might push price below $190 before reversal to shake out weak hands.
Bitcoin’s trend will influence SOL’s direction significantly.
🔥 Decision: Enter or Stay Out?
🩸 Short-term: Scalping range is viable, but watch for breakout confirmation.
🩸 Mid-term: Bullish if SOL holds $195+ and breaks $205.
🩸 Ideal Play: Buy dips above EMA, short only if resistance holds.
👑 Final Verdict:
Solana needs to reclaim $205. If it breaks higher, expect $215 - $220. Otherwise, a dip to $190 - $180 remains likely. 🔥

The Hidden BullCOINBASE:SOLUSD The Hidden Bull…
SOL has been riding the 200 EMA (Yellow Ribbon) for a little while now. I have a key resistance zone set at the red horizontal line, a key liquidity point. If we can break above that resistance level and hold, this could suggest some bullish momentum for the next wave up.
There was a recent break-out attempt from the supply line, however it is looking a bit weak, and volume is not convincing yet. But it is holding rather well in this area.
Key note: There is some hidden bullish divergence that can be observed on a slightly higher TF. This is a clue that suggest some upward momentum could be in the mix, and that this wave down may be complete.
Solana is the ecosystem that drives those memes that are based off the Solana Network, so when this chart makes big moves, as do the memes.
Good Luck Traders!

SOLUSD Weekly Outlook: Bearish DivergenceOverview
On the weekly timeframe, BINANCE:SOLUSD has continued to print higher highs . However, the DMI Delta indicator is signaling lower highs , creating a notable bearish divergence . Meanwhile, price action is tapping into a significant demand zone but has yet to break decisively through it.
Why This Matters
- Bearish Divergence: When price moves higher but a momentum indicator lags or makes lower highs, it can indicate weakening bullish pressure. This often precedes corrections or trend reversals.
- Demand Zone Confirmation: Despite the divergence, SOLUSD is currently interacting with a recognized demand zone. If buyers step in here, we could see a bounce. However, if this zone fails, it could signal a more substantial downturn.
Key Considerations
Monitor the Demand Zone: A clear breach or strong bounce will shape the next directional move.
Validate Signals: While divergence suggests caution, confirm using volume or other momentum indicators.
Risk Management: Utilize stop-loss orders below the demand zone if you’re taking a long position.
Potential Reversal: A confirmed break below support could open downside targets, so remain vigilant.
"Bearish divergences are early warnings—combine them with clear support/resistance levels to form a complete trading plan."
Conclusion
The interaction between the bearish divergence and the current demand zone should be closely monitored. If buyers fail to hold this level, traders may look for short setups or hedge existing positions. Conversely, a successful defense of the zone, coupled with increased buying volume, could invalidate the bearish scenario and offer short-term bullish opportunities.
Disclaimer: The information provided is for educational purposes only and does not constitute financial advice. Always conduct your own research and manage risk appropriately.


$SOL looking to break out on the daily!CRYPTOCAP:SOL looking to break out on the daily! Measured move 280.00. BTC.D looking to roll over good for Alt Coins. Want to see BTC hold about 96,200 to remain overall market strength. A lot of hype about SEC acknowledging SOL, XRP, DOGE and ADA ETF’s could be a great catalyst.


SOLUSD BUY ANALYSIS SMART MONEY CONCEPT Here on Solusd price form a demand around level of 189.38 and is likely to continue moving up so trader should go for long with expect profit target of 201.52 and 214.99 . Use money management

SOL USD Support Zones and LL: Trading in a Sell TrendPrice has approached our support zone on the 30-minute timeframe and also our support on a higher timeframe. Now we can look for a buy entry up to the sell GWS, as we must be aware that we are still in a sell trend and need to have the trade on an appropriate timeframe. However, it’s also possible that the price breaks our LL, where, after a bounce off the LL, we can look for a continuation of the sell trend.

Solana Battle Plan Update 3: Price to reverse at Local HighThis is my 4th idea looking at Solana with Ethereum as a pattern, benchmark, or comparison. I used this pattern to identify downside targets and potential reversals and now I am using it to call a local high. This is basic and fundamental charting.
Both charts show a 5 impulse Elliot Wave to the upside. With such a clear pattern and impulsive move we don’t see a continuation pattern yet. We Solana does not show an ascending triangle, a cup and handle, or even a symmetrical triangle. Without a continuation pattern we must suspect price will stall at a previous support. Seeing where price flipping support to resistance and vise versa at key levels is one of the basics that can take years to master.
That previous support is the bear trap that was created at the beginning of the bear market. We can see on the right where it played out with Ethereum and I strongly suspect we are seeing the initial stages of that reversal in Solana.
Of course, there are some key differences in the two charts. We can see that when we look at other indicators. I don’t want this idea to become unmanageable so I will just look at one of the basics, the Monthly Bollinger Band. It is pretty clear that looking at the Bollinger Band it looks like Solana did a much better job than Ethereum. Solana has pushed its head above the monthly Bollinger band to reach the previous bull trap whereas Ethereum didn’t even reach the baseline. But either way, price being out of the monthly Bollinger band or near the middle with weekly bearish divergence at previous support still suggests reversal.
I do hope to see the lower limit of the monthly BB to snug up and flatten off to indicate a local low is in when I see Solana double bottom.
Solana Against Bitcoin, Ethereum and BNB
Solana also looks like it is in a dreadful position against Bitcoin. The zone of resistance is drawn, in part, due to the MACD oscillaton below zero and the amount of sideways action we needed to have that happen.
The bearish similarities with Solana and trading pairs continues with Ethereum.
BNB has a bit of a different set up. It does not have a clear bull trap like SOL has against BTC and ETH. Rather it had a descending triangle top and a return move to the support of the triangle. Price has returned to the base of the descending triangle and I think with the indicators so overbought we would assume another pull back.
Conclusion and my plan
Solana looks like it has hit a local high against USD, BTC, BNB and ETH. There are so many temptations to get out of Solana into a different larger, less volatile token that I don’t see most day or swing traders holding onto Solan for long. Especially margin traders. Timing the shortside can be a wee bit tricky but it can be done. I am staying away from that.
I suspect that Solana will be setting a higher low W pattern. If it does, I will basically be rotating everything I can into it as I expect it will be making a higher high. AS the main chart shows that higher high would be about 100x from the low. If it sets an equal low, then I will suspect it will roughly return to an all-time high. That would be about 25X. That is decent enough for crypto but in all honesty if Solana sets a lower low, I will be looking for a different token to rotate into. Right now, my biggest crypto bag continues to be Fantom as I really like the Big W pattern it is in.

Swing trade in 4H
Daily MACD is still deep in the bear zone and Solana hasn't even claimed the the previous week high. Therefore, the overall sentiment for Solana is still bearish to me, however, in the 4H chart, I can see some bullish momentum is building up and a potential swing opportunity might be coming up soon. The things I am seeing for a potential swing trade are as follows:
1) The price broke and closed above the descending treandline and now the price is consolidating (not dropping) in the range bound in the Fib 0.236 region.
2). When the price tries to move to the upside, the first barrier that it has to break is Fib 0.236. It doesn't guarantee it is the start of the bull, but it is the early sign of the bullish momentum. If the momentum is weak, the price starts to retrace to the downside when it hits 0.382 and 0.5. So, I need to wait and see the sideway consolidation ends and the price moves decisively (without a long top wick) above $203.
3) MACD needs to be properly crossed, point to the upside and enter the bull zone.
As I said, daily MACD is still in the bear zone. Therefore, 4H chart provides a good trade set up for a long, the upside momentum might be still limited to the Fib 0.5 -0.618 area. Therefore, if I open a long position based on 4H chart, I will be very cautious with position size and profit target.

An Opportunity to buy a great Crypto- SolanaHello,
Cryptocurrencies have been around for a while, and with a potential Trump presidency, it’s clear that the best projects will thrive over the next four years. Now is the time to take a strategic position in the strongest assets, and Solana (SOL) is one of them. U.S. President Donald Trump has ordered the creation of a cryptocurrency working group tasked with proposing new digital asset regulations and exploring the creation of a national cryptocurrency stockpile, making good on his promise to quickly overhaul U.S. crypto policy.
Why Solana?
Unmatched Speed & Low Fees
Solana is one of the fastest blockchains in the world, processing over 65,000 transactions per second (TPS) at near-zero costs. This makes it ideal for mass adoption, unlike Ethereum, where gas fees can be prohibitively expensive.
Explosive Growth & Developer Activity
Solana has one of the most active developer ecosystems, with thousands of projects building on it. From DeFi (Decentralized Finance) to NFTs and gaming, Solana continues to attract top-tier innovation.
Resilient & Battle-Tested
While it faced challenges in the past, Solana has emerged stronger, with improved network stability and institutional backing. The recent surge in activity and major partnerships signal growing confidence in its future.
Institutional & Retail Adoption
With increasing mainstream adoption, including interest from institutions and major investors, Solana is positioning itself as a top-tier blockchain that could rival Ethereum in the long run.
A Hedge Against Uncertainty
Cryptos are volatile, but in every cycle, strong networks with real-world use cases tend to outperform. Solana’s ability to process transactions efficiently makes it one of the best bets in a rapidly evolving digital economy.
From a technical point, Solana is currently at the bottom of a correction (Expanding triangle pattern) hence a reinforcement that buying at current point is a great idea. I will be buying with a target of $290 per coin. The MACD Zero crossover will also reinforce our bullish bias. You can buy this coin using the tradingview brokers here go.tradenation.com
Good luck

Solana (SOL) Critical Support! Will It Bounce or Break Down?📉 Technical Analysis (Weekly Timeframe)
Market Structure & Trendlines
* SOL has been consolidating within a rising trendline support while facing resistance at $210 - $220.
* The ascending trendline support from 2023 remains intact, providing a potential bounce level near $190 - $195.
* A break below $190 could trigger further downside, while a successful hold and bounce could retest previous highs.
Indicators Analysis
* MACD: Shows a bearish crossover, indicating downward momentum. The histogram is negative, suggesting a potential continuation of the pullback.
* Stochastic RSI: Currently oversold, sitting near 10.62, which means a bounce could be imminent if buying pressure emerges.
Key Support & Resistance Levels
* Immediate Support: $190 - $195 (Trendline support)
* Major Support: $165 - $170 (Next demand zone if trendline breaks)
* Resistance 1: $210 - $220 (Current rejection zone)
* Resistance 2: $250+ (Breakout target if the trend remains intact)
💡 Trade Scenarios
Bullish Outlook (If $190 Holds)
* Entry: Around $190 - $195
* Target 1: $210 - $220 (First breakout level)
* Target 2: $250+ (Full recovery potential)
* Stop Loss: Below $185 (Trendline failure)
Bearish Outlook (If $190 Breaks)
* Entry: Below $190
* Target 1: $170
* Target 2: $150
* Stop Loss: Above $200 (Reversal invalidation)
⚠️ My Final Thoughts
* SOL is at a make-or-break level near $190 - $195.
* Holding above $190 could trigger a bounce to $210+, while a break below may lead to $165 - $170 next.
* Oversold conditions suggest a possible rebound, but MACD remains bearish, so confirmation is needed.
⚠️ Disclaimer:
This analysis is for educational purposes only and does not constitute financial advice. Always conduct your own research and manage risk properly.

Franklin Templeton Joins Solana ETF Race: A Game-Changer for SOLThe race for a Solana ( CRYPTOCAP:SOL ) ETF is heating up, and Franklin Templeton has just thrown its hat into the ring. The global investment giant has filed documents in Delaware to register the Franklin Solana Trust, marking a significant step toward launching a spot Solana ETF. This move comes hot on the heels of similar filings by VanEck, Grayscale, and Canary Capital, signaling growing institutional interest in Solana. But with CRYPTOCAP:SOL ’s price down 3.34% in the last 24 hours and 9.99% over the past week, is this ETF momentum enough to reverse the bearish trend? Let’s break it down.
Institutional Adoption Heats Up
Franklin Templeton’s entry into the Solana ETF race is a major vote of confidence for the blockchain platform. Known for its high-speed transactions and low fees, Solana has become a favorite among developers and users alike. Now, with institutional heavyweights like Franklin Templeton, VanEck, and Grayscale vying for a Solana ETF, the cryptocurrency is poised to gain even broader recognition.
Key Developments:
1. Franklin Solana Trust:
Franklin Templeton’s filing in Delaware is the first step toward launching a spot Solana ETF. While the SEC has yet to approve any Solana ETF, the growing number of applications highlights the asset’s potential.
2. SEC’s Stance:
The SEC has acknowledged filings from Grayscale and Canary Capital, opening a 21-day public comment period. However, Solana’s classification as an unregistered security remains a hurdle. Analysts suggest that Litecoin and Hedera ETFs might have a better chance of approval due to their clearer regulatory standing.
3. Franklin’s Crypto Index ETF:
Franklin Templeton has also filed for a **Crypto Index ETF**, which initially tracks Bitcoin and Ethereum but could expand to include other altcoins like Solana. This shows the firm’s long-term commitment to the crypto space.
Technical Analysis
Despite the bullish news, Solana’s price action tells a different story. Here’s what the charts are saying:
CRYPTOCAP:SOL is currently trading at $195, down 2.36% in the last 24 hours. The token has struggled to maintain momentum, with a 9.99% drop over the past week.The Relative Strength Index (RSI) is in bearish territory at 41, indicating that selling pressure outweighs buying interest. This suggests that CRYPTOCAP:SOL could face further downside before finding support.
If Bitcoin dips to $90,000, CRYPTOCAP:SOL could test the $180–$160 zone, a critical support area. However, a breakout above $240 (38.2% Fibonacci retracement level) could reignite bullish momentum, potentially pushing CRYPTOCAP:SOL toward its all-time high of $270.
Solana’s 24-hour trading volume is down 14.03% to $3.81 billion, despite its $95.94 billion market cap. This divergence suggests that retail interest may be waning, even as institutional demand grows.
Conclusion
Franklin Templeton’s entry into the Solana ETF race underscores the growing institutional interest in the blockchain platform. While the current price action is bearish, the potential approval of a Solana ETF could be a game-changer, driving CRYPTOCAP:SOL to new heights. For now, investors should keep an eye on key support and resistance levels, as well as regulatory developments.
Will Solana break out of its slump and reclaim its all-time high? Only time will tell, but one thing is clear: the race for a Solana ETF is just getting started.

Scalping & Mid-Term Analysis for Solana 2-11Market Overview:
Trend: Solana is currently holding above the 200 EMA, signaling a potential support zone but struggling to maintain upside momentum.
Key Levels:
Resistance: ~$210 - $215
Support: ~$190 (EMA 200), ~$175 (stronger support)
Indicators:
MACD: Bearish crossover, indicating potential weakness.
RSI: At 42.7, showing no strong overbought/oversold signals.
Volume: Declining, suggesting market indecision.
🔥 Scalping Strategy:
🩸 1. Range Scalping (Short-Term Play)
Why? SOL is holding near the 200 EMA, making it a key liquidity zone.
How?
Buy near $190, targeting a bounce to $202 - $210.
Sell near $210 - $215, as resistance is strong.
Stop-loss below $188, as further downside could accelerate.
🩸 2. Breakout Scalping (If Trend Resumes)
Trigger: A breakout above $215 or breakdown below $190.
Execution:
If SOL breaks $215, scalp long targeting $225 - $230.
If SOL drops below $190, scalp short targeting $175 - $170.
🩸 3. EMA Scalping
Why? SOL is hovering around the 200 EMA, which is a critical pivot point.
Execution:
Short near EMA 9 (~$202 - $205) if price fails to reclaim it.
Go long only if price holds above $200 with strong volume.
🔥 Mid-Term Trend Forecast (1-3 Weeks)
Bias: Neutral → Bearish if $190 breaks
Why?
Failure to reclaim $210-215 resistance weakens bullish momentum.
Holding the 200 EMA ($190) is crucial for bulls. A breakdown opens the door to $175.
RSI is weak, showing no strong bullish confirmation yet.
If SOL breaks above $215, a run to $230-$240 is possible.
🔥 News & Market Context:
No major bullish catalysts, so Solana is dependent on Bitcoin's direction.
Whales may test liquidity below $190 before a stronger reversal.
Watch for increased volume as a confirmation trigger.
🔥 Decision: Enter or Stay Out?
🩸 Short-term: Scalping is viable within the range, but caution is advised.
🩸 Mid-term: Bearish unless SOL breaks and holds above $215.
🩸 Ideal Play: Look for a bounce from $190 or short resistance near $210.
👑 Final Verdict:
$190 is the battleground. Bulls must defend or risk a drop to $175. If $215 breaks, upside potential opens. 🔥

$SOLUSD has Clear (R)&(S) on Monthly&Weekly Love to see (R)(S) are clean and respected.
showing us obvious (R)(S) to take risk.
on Repeat:
either (S) bounce to target (R)
or (R) reject to test (S)
until bull turn (R) to (S)
or bear turn (S) to (R)
Current behavior:
Monthly formed (R) and reject to test prev (S) level &5ma(S).
Weekly testing (S) level & 20ma(S) from (R) level rejection.
=
sideway/Consolidation going on = could be pullback to (S) for bulls to avg up

SOLANA TRADE IDEA - LONG🚀 SOLANA LONG TRADE IDEA 🚀
📌 Entry: $200
🎯 Exit 75%: $218
🔹 Solid bullish structure forming
🔹 Targeting key resistance zones
📊 Watching for momentum confirmation—let’s ride this wave! 🌊🔥 #Solana #Crypto #Trading


Solana With Another Clear Long Signal Given!Trading Fam,
Not too much to say here other than the fact that my indicator has recently given us another very clear buy signal inside our liquidity block after hitting support. This alone is all we needed for entry but if you're not familiar with how accurate my indicator has been for us on these larger cap/large volume tokens, then you can see below we also have plenty of confirmation from the Heiken-Ashi, RSI, and MACD. Here we go!
✌️ Stew
