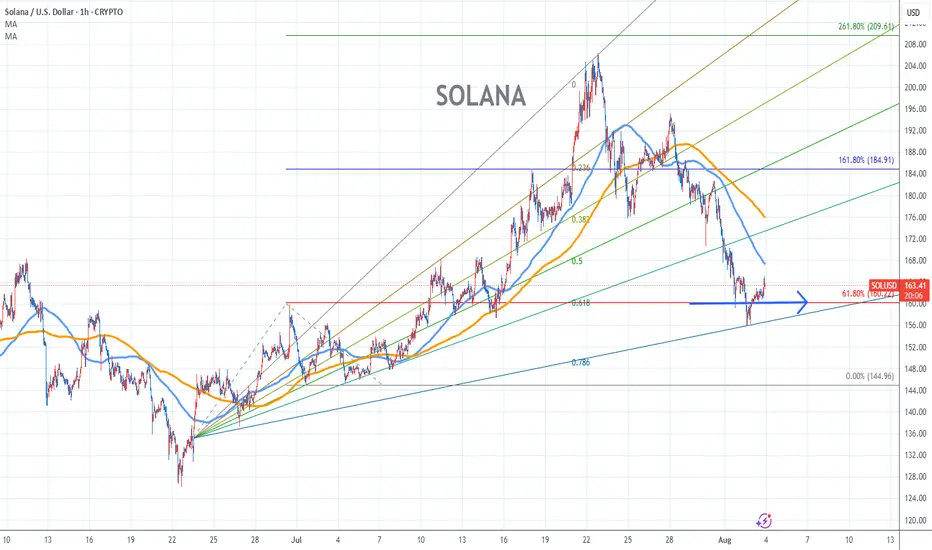
SOLANA Chart Fibonacci Analysis 080325Trading Idea
1) Find a FIBO slingshot
2) Check FIBO 61.80% level
3) Entry Point 160/61.80%
Chart time frame:B
A) 15 min(1W-3M)
B) 1 hr(3M-6M)
C) 4 hr(6M-1year)
D) 1 day(1-3years)
Stock progress:A
A) Keep rising over 61.80% resistance
B) 61.80% resistance
C) 61.80% support
D) Hit the bottom
E) Hit the top
Stocks rise as they rise from support and fall from resistance. Our goal is to find a low support point and enter. It can be referred to as buying at the pullback point. The pullback point can be found with a Fibonacci extension of 61.80%. This is a step to find entry level. 1) Find a triangle (Fibonacci Speed Fan Line) that connects the high (resistance) and low (support) points of the stock in progress, where it is continuously expressed as a Slingshot, 2) and create a Fibonacci extension level for the first rising wave from the start point of slingshot pattern.
When the current price goes over 61.80% level , that can be a good entry point, especially if the SMA 100 and 200 curves are gathered together at 61.80%, it is a very good entry point.
As a great help, tradingview provides these Fibonacci speed fan lines and extension levels with ease. So if you use the Fibonacci fan line, the extension level, and the SMA 100/200 curve well, you can find an entry point for the stock market. At least you have to enter at this low point to avoid trading failure, and if you are skilled at entering this low point, with fibonacci6180 technique, your reading skill to chart will be greatly improved.
If you want to do day trading, please set the time frame to 5 minutes or 15 minutes, and you will see many of the low point of rising stocks.
If want to prefer long term range trading, you can set the time frame to 1 hr or 1 day.
SOLUSD trade ideas
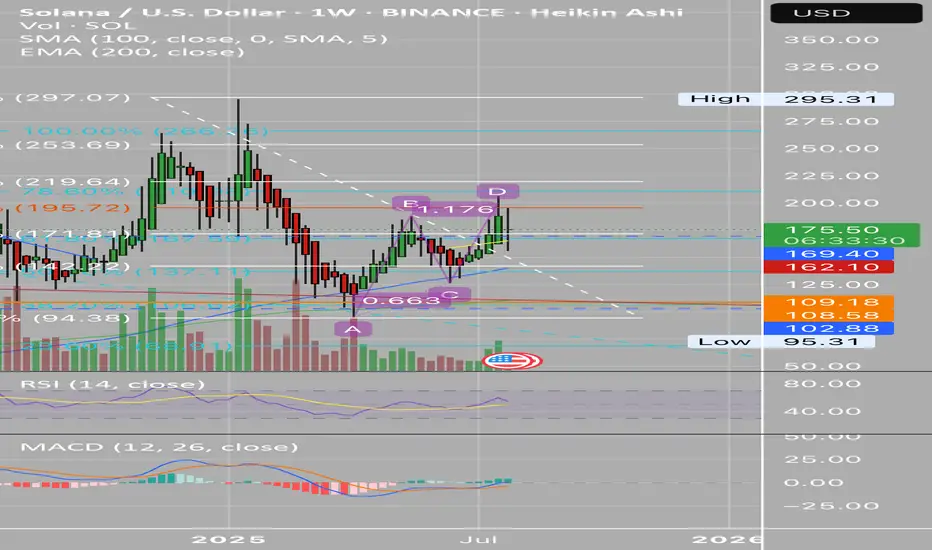
Weekly Chart RejectionRight now I’m seeing a rejection at 50% Fib
It also looks like it’s gonna to confirm it at week close.
I’m concerned this means we continue to drop $109 area as support.
Looks like most of the coins out there can keep dropping so likely the same with SOL
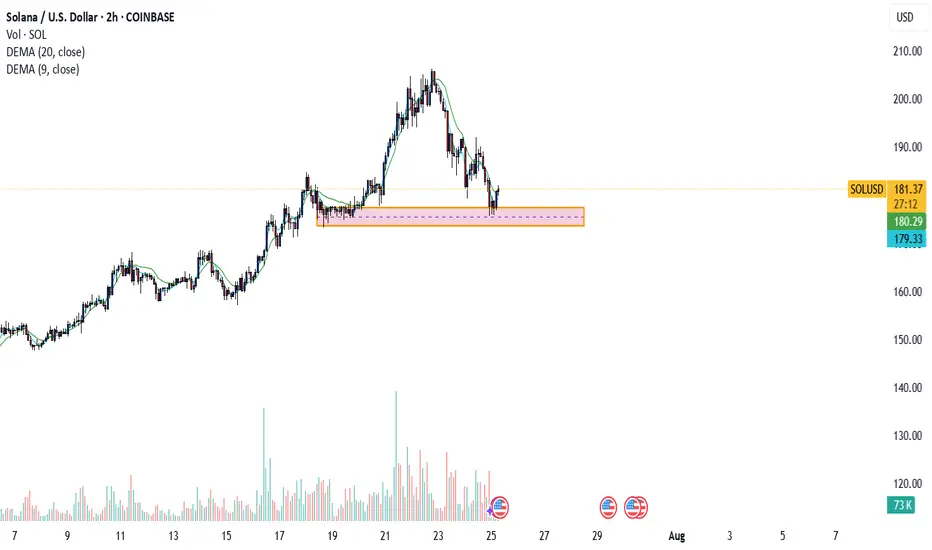
SOL/USD 4H📉 Price
Current price: approximately $183–$184
We see a decline from the resistance zone around $194.56. The price has broken through support at $187.31 and is heading towards lower support at:
🔴 $183.18 – local support (being tested now),
🔴 $175.58 – key support (potential target if current support breaks).
📊 Market structure
Short-term trend: Downtrend (lower highs and lower lows after a rebound from $194.56).
Volume: Increased volume on bearish candles – confirming supply pressure.
Previous trend: Uptrend with strong momentum from July 18th to July 21st.
🔁 Technical Levels
Resistance:
🟢 USD 187.31 – last broken support, now acting as resistance.
🟢 USD 194.56 – strong resistance (tested twice).
🟢 USD 206.43 – local high, strong resistance level from higher timeframes.
Support:
🔴 USD 183.18 – currently being tested.
🔴 USD 175.58 – stronger support from lower swing highs.
📉 Stochastic RSI
Located in the oversold zone (<20) and pointing down.
No upside crossover yet → no buy signal yet.
If a reversal occurs, a technical rebound is possible.
📌 Conclusions and Scenarios
🔻 Downside scenario (more likely currently):
Breakthrough of support at $183.18 ➜ further decline to $175.58.
Potential entry into a correction of the entire upward movement from July 18-21.
🔺 Upside scenario (alternative):
Support at $183.18 held + Stoch RSI signal ➜ rebound to $187.31.
If buying volume increases, a retest of resistance at $194.56 is possible.

SOL TO THE MOONthe solana has urged a retracement , going back to its key zone, the next bullrun will explode the price of solana, make sure you have enough sol in your wallet
Double bottomDouble bottom with RSI regular divergency. It seems that buyers a willing to buy at this level again.

SOLUSD at Strong SUPPORT SOLUSD was trading down trend the and is current at the support which was its resistance earlier and this is a strong support and expect further growth or up movement of for SOL. 2010-215.

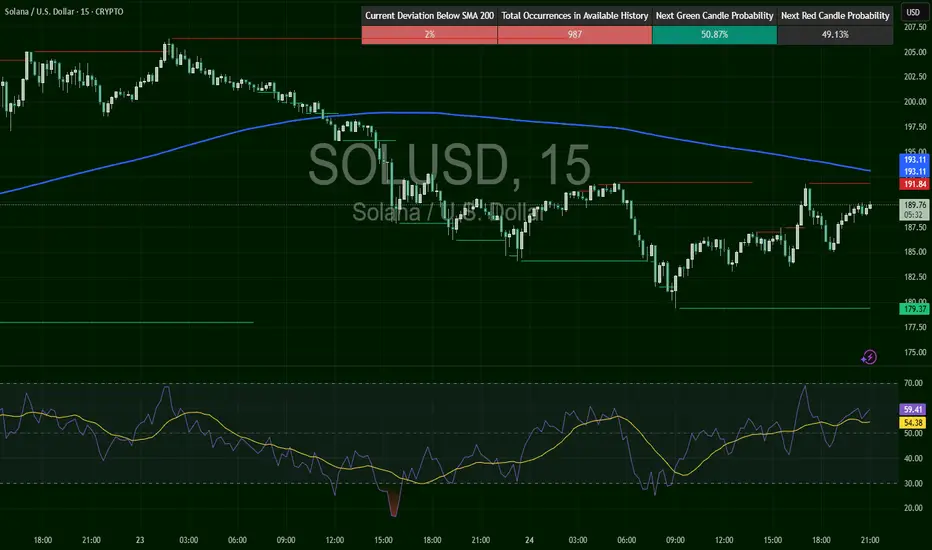
SOLUSD – Recovery Faces Wall at $193SOL broke below $198, hitting a low near $179, confirming the short trigger from the last setup. Since then, it’s building a grind-recovery, reclaiming $189 but stalling at a confluence zone ($191.84 resistance and SMA200 near $193.11). RSI at 59.41 still favors buyers — but SOL needs a clean break above $193+ to shift back into bullish territory.
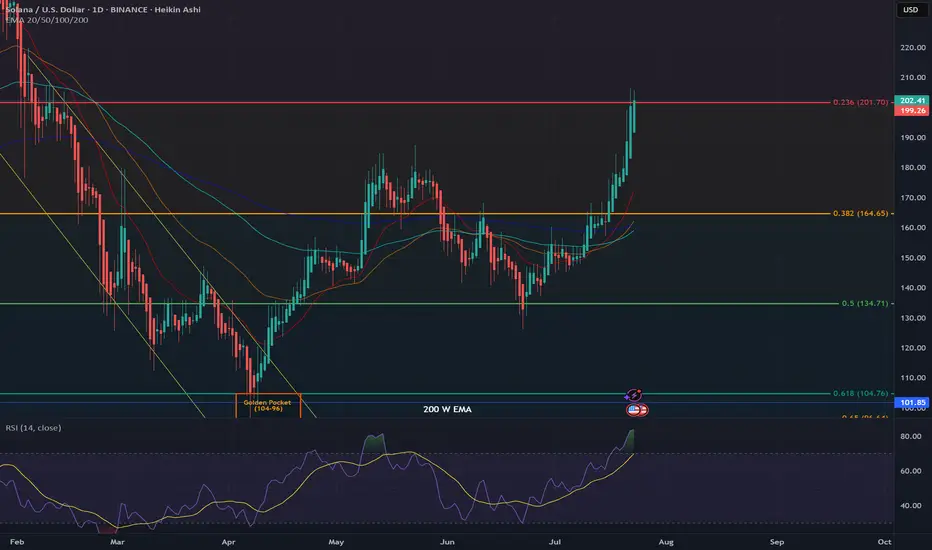
SOL key resistance 201We are reaching a key level in the fib retracement which sits at 201 USD. With the daily RSI being in the overbought area, I would expect a pullback to 180 or 165. DYOR, would love to hear your thought
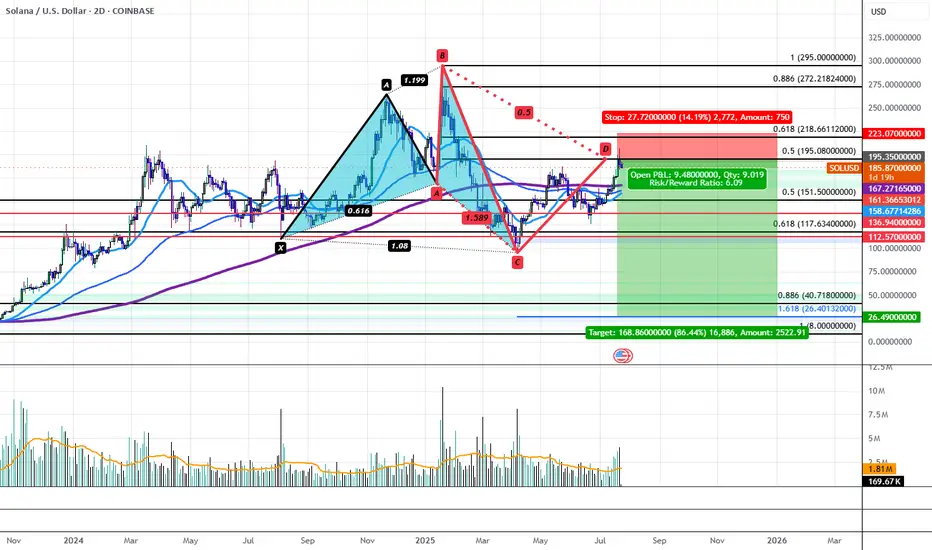
Solana's Bearish 5-0 is Locking in a Bearish Reversal to $26.40Solana has recently run up to Horizontal Resistance Zone of $195-$210 aligning with the PCZ of a Bearish 5-0 and has begun to impulse downwards with volume to back it. This could be the start of a greater move down that would take SOL back to the low of the distributive range at $95.16. If the level breaks, we would then target a drop down to the $40.72-$26.40 confluence area aligning with the all-time 0.886 retrace as well as the 1.618 extension from previous swing low to high. Only at these levels could we even possibly begin to consider Bullish Entries on Solana.
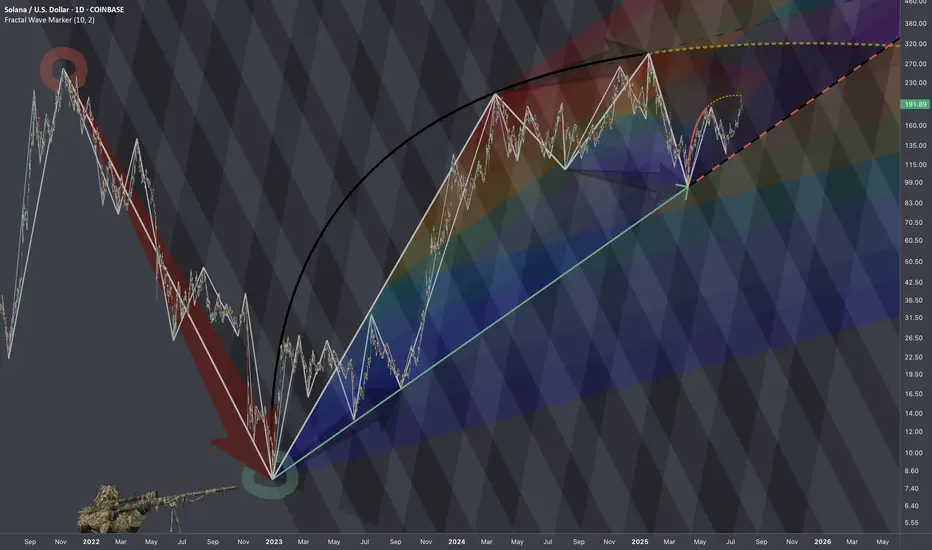
$SOLUSD: Scaling LawsResearch Notes
Progressions here are evident so I'll use the historic bits and organize them into structure that would determine the levels inside dark highlighted zone of the local scope.
If we scale back, it's hard to avoid the massive drop that structurally can serve as reference point.
SOLUSD – Topped Out or Holding ThinSOL topped out at $206 and now coils near the 200 SMA at $198. RSI at 36.38 is heavy but not diverging. Structure turning from trend to distribution unless $200+ gets reclaimed quickly. $198 is the last line of support. Break below and short trigger confirms.
SOL holding above the 204 on the daily could be a long positionSOL is respecting the 204 on the daily and if it holds above it, we could have a long position buying opportunity.
Upside could be too the 222 resistance line if it holds above the 204.
Sentiment seems to be good for Sol and other strong alt coins at the moment. This also supports and upside trajectory.

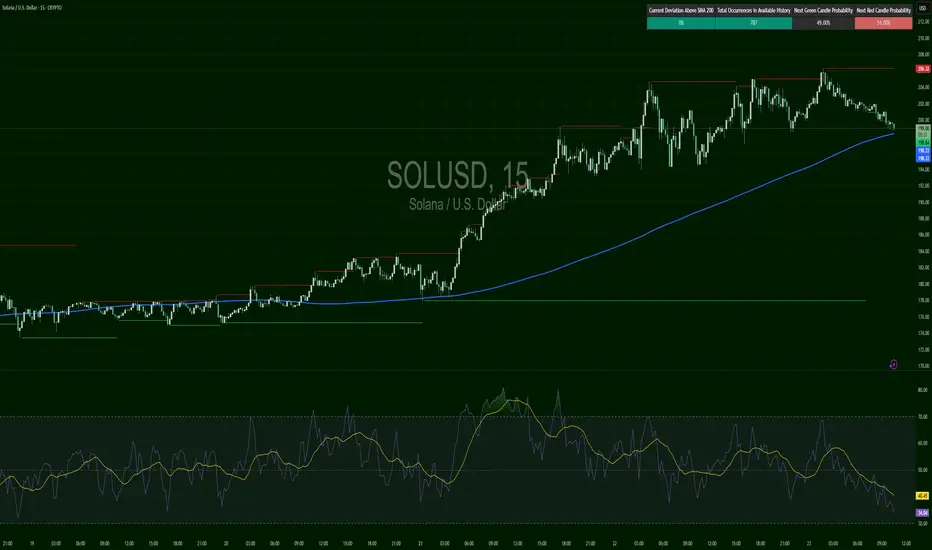
SOL Traders Begin Taking Profits Despite Bullish RallySolana (SOL) continues to climb, but under the surface, signs of selling pressure are starting to emerge. While price action has been bullish and on-chain activity remains strong, the BBTrend indicator is flashing red — literally. For the past three days, its histogram bars have turned red and gradually increased in size, signaling a rise in mild but persistent selling activity.
The BBTrend, which gauges trend strength using Bollinger Band behavior, shows that SOL is consistently closing near the lower band. This pattern suggests that despite the upward momentum, some traders are quietly taking profits — possibly positioning for a near-term pullback. The rally remains intact for now, but the growing divergence between price and BBTrend behavior hints at early signs of weakening confidence.
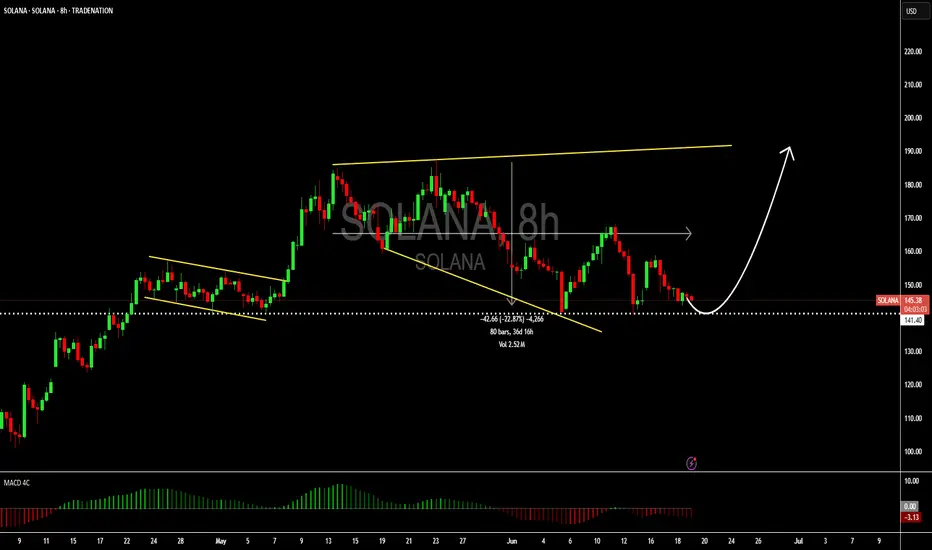
Solana: Still bullish about this cryptoHello,
I see the current price is at a great value price for Solana investors. The market has corrected by over 22% over the recent 36 days. The MACD is also showing signs of bullish zero crossover further reinforcing that the price is at a good place for bullish investors to begin coming in.
We urge investors who would like exposure to this coin to consider entering at the current price. Please have your stop loss below the trendline and your short-term target at $191.
Disclosure: I am part of Trade Nation's Influencer program and receive a monthly fee for using their TradingView charts in my analysis.
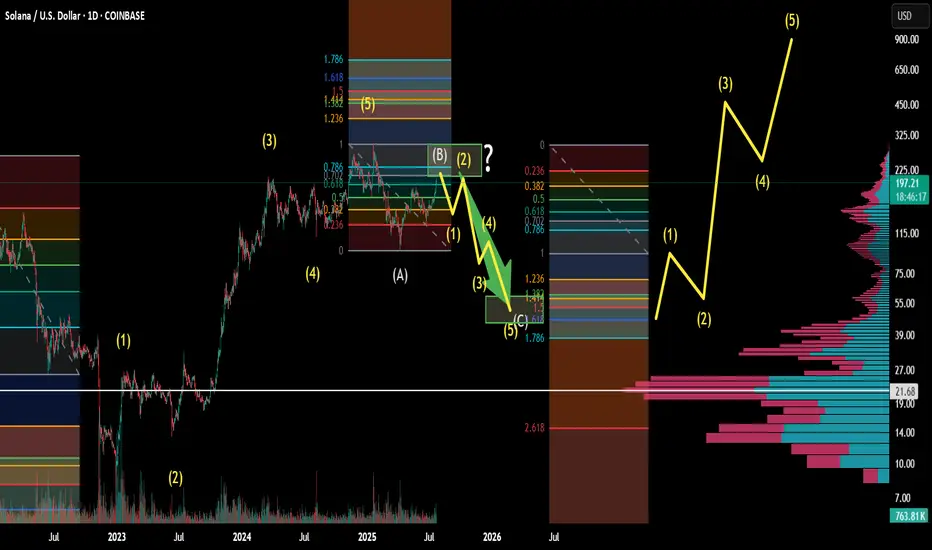
Solana Macro Cycle Elliotwave countTop has been in for solana since going back to ATH. We are in a bear market retrace rally. Looking to scoop between 50-40 about 1 year from now. Let me know what you think below.
Trading alts on solana right now during the retrace rally, then potentially looking to rotate into radix plays or other coins finishing their wave 2's
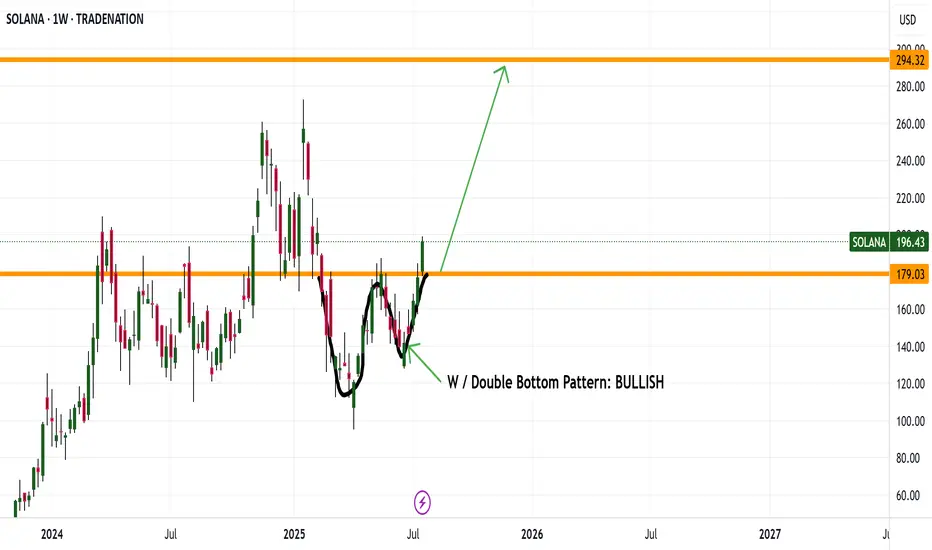
SOLANA DRIVING UP TO 294 Good evening everyone
It looks like SOL made a nice W pattern and now breaking its weekly high is driving up to 294
Enjoy happy trading this bull run
Kris/ Mindbloome Exchange
Trader Smarter Live Better
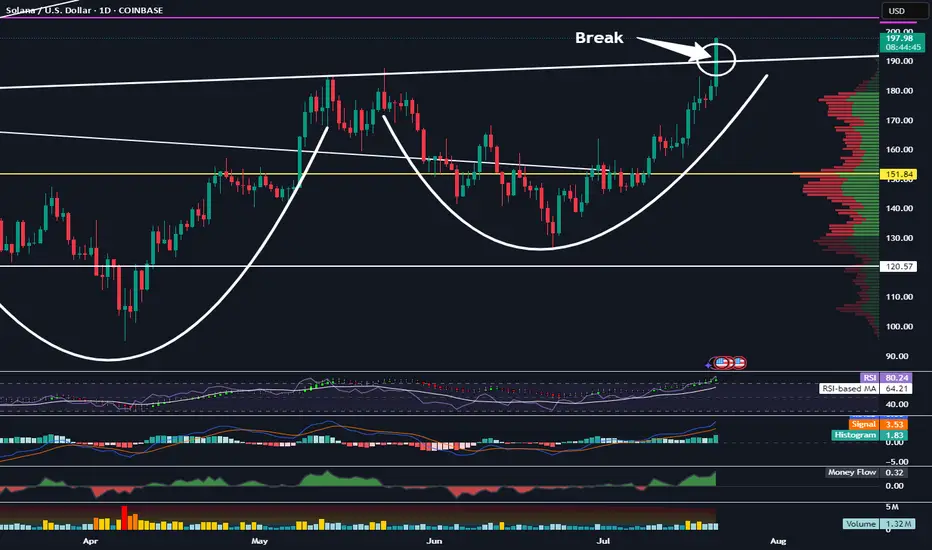
Solana Has Broken This Important Resistance LevelTrading Fam,
Things are definitely heating up in the altcoin space. Two big key movers are ETH and SOL. Right now SOL has broken a very important resistance level in the neckline of this inverse H&S pattern. Watch closely. If the body of our daily candle closes above this today and remains above it tomorrow, this pattern is in play and our target would be around $275.
✌️Stew
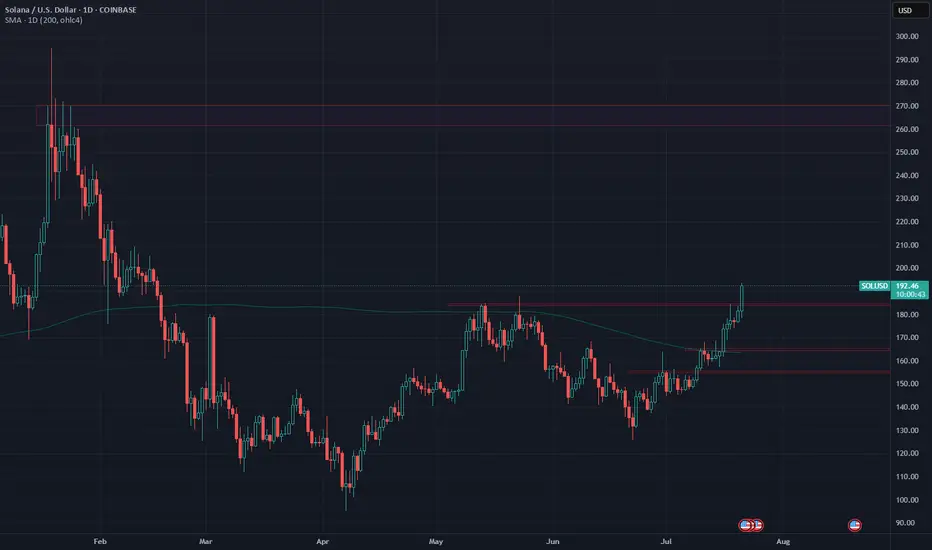
Solana Enters Bullish TerritorySOL has been showing strength since it reclaimed the 1D 200MA last week.
Currently trading around $192 - above May's highs - continued bullish momentum could see price test Jan highs around $270.
Until then, any retracement could be a buying opportunity.
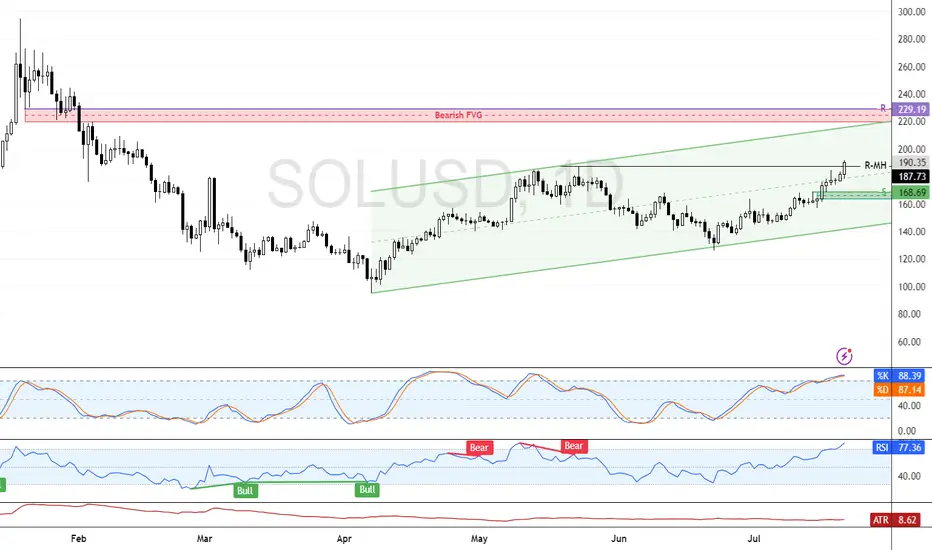
Solana Pullback May Offer Discounted Bull EntryFenzoFx—Solana exceeded the previous month's high at 187.7, while momentum indicators warn of an overbought market. The trend is bullish, but we expect a consolidation toward $168.6. This level can offer a discount price to join the bull market.
20:1 R:R for SolanaTaking a chance on this super high-risk setup with a 20:1 R:R before it takes off.
Entry: 177.78
Stop Loss: 173
Target: 260

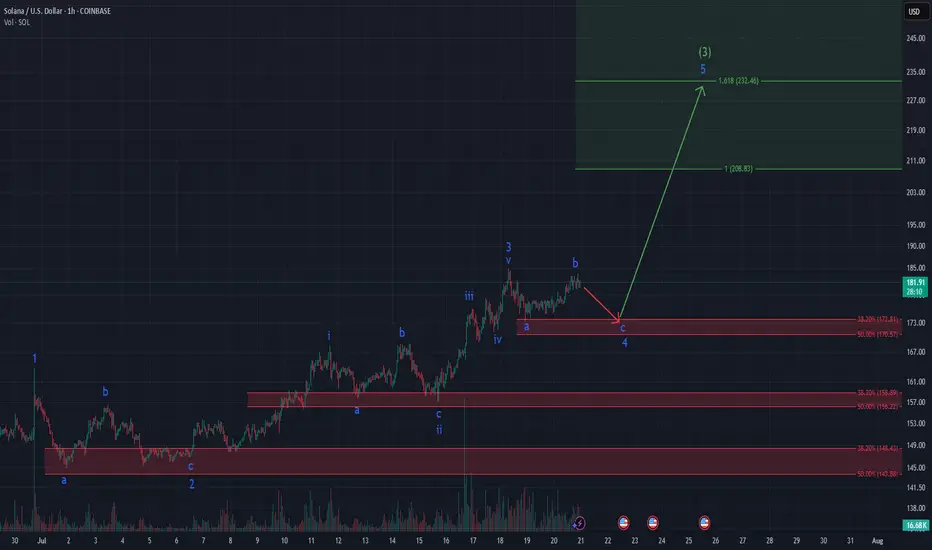
SOLANA ready for Explosion? Textbook Elliott Setup unfoldingSolana – Textbook Elliott Wave Structure Unfolding!
Clear impulsive fractals, textbook ABC corrections, and precise Fibonacci reactions – this 1h chart on CRYPTOCAP:SOL is a dream for any Elliottician.
We’re currently finishing wave C of (4) within a well-formed bullish impulse. Key support lies between $170–$173, aligning perfectly with the 38–50% retracement zone. From there, I expect wave 5 to launch, targeting $232.46 (1.618 extension), which would complete the green (3) wave.
Both RSI and MACD suggest we're approaching exhaustion – a healthy reset here could provide the perfect setup for the next breakout.
🔹 Are you bullish on Solana?
🔹 What chart would you like me to analyze next?
👇 Let me know in the comments and feel free to follow for more detailed Elliott Wave crypto setups.
#Solana #ElliottWave #CryptoTA #TechnicalAnalysis #Wave5 #Fibonacci #BullishSetup #Altseason #CryptoBreakout #SOLUSDT #TradingView
SOLANA - BULLISH & BAERISH
Hello everyone,
here is my current outlook on Solana (SOL):
Personally, I am currently only watching Solana as we may already be in a correction phase. Nevertheless, there is an interesting scenario where we could still be in a green wave 5, which could potentially reach prices above USD 300.
Possible course:
In April 2025, the bottom may have been found following an ABC formation.
Wave 1 (yellow) could be completed in May 2025.
Wave 2 (yellow) could end in June 2025.
We could currently be in wave 3 (yellow).
Important point to watch:
If the price does not make it sustainably above the yellow wave 1 (approx. USD 190), the probability increases strongly that we are still in a B wave.
This would mean that we are still in a major correction, which could theoretically take us back to around USD 60. In this scenario, wave 1 would have already ended in January 2025 and we would still be in the correction of wave 2.
Conclusion:
The indicators are particularly important in this phase. Keep a close eye on them to better understand the structure.
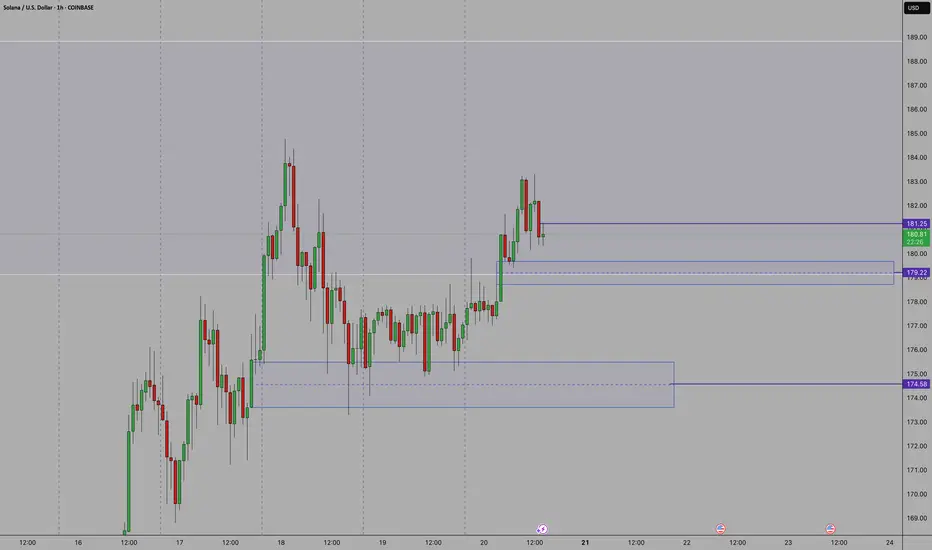
Bounce with meLooking to spring off the areas below
We are at a Major Top and playing in Supply. I don't recommend betting big here but I'll be looking to add positions based on median level bounces below. 15M and hourly bodys above median. If levels break and close I'll be looking to exit quickly.
The lower area has better odds of bounce off of a major level and I would expect more impact here.
I'm overly bullish and we could see a massive move come in so play smart.