$SOL Bullish Engulfing On WeeklyCRYPTOCAP:SOL closes the week with a Bullish Engulfing candle.
50WMA at $170 next target to smash.
SOLUSD trade ideas

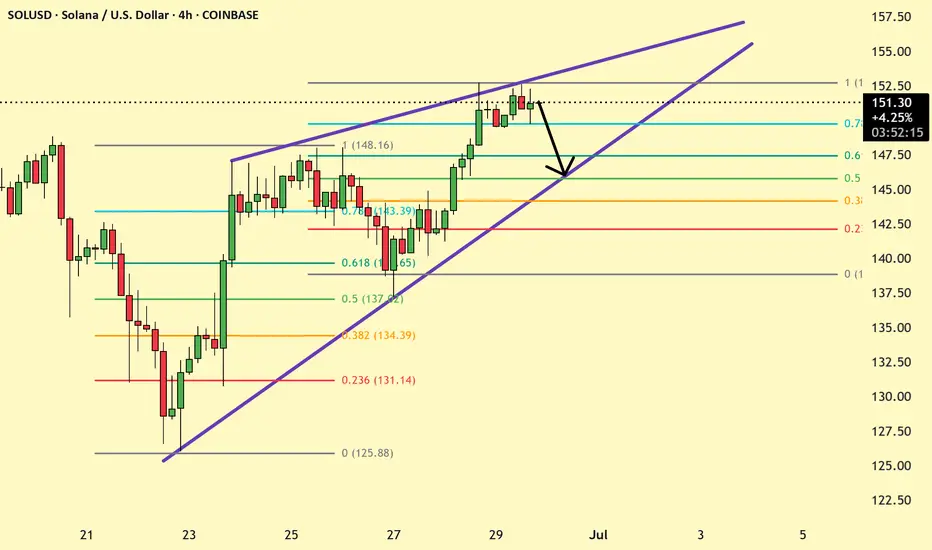
SOLANA 4 hr pullback on play SOLANA had recently high rally reached resistance around 152 , before it Resume bullish pullback to 145-147 is possible with 153 stop loss.
SOLANA Weekly Chart pull back from 0.382 Fib Bullish engulfing The Swing low and high indicate the bullish trend ahead for solana after forming a bullish engulfing candle More growth coming.

Solana Heading to 112 or 330+Hey fam
So for Solana if we hold under 148 then a drive down to 112 makes sense. However if we drive above 148 then we can possibly hit weekly targets of 330
Make sure you adjust accordingly in a smaller time frame to ensure your in the right move
Happy tradings folks
Kris Mindbloome Exchange
Trade Smarter Live Better
Under 148 we go to 112 if we break 148 we can see a drive up to 338

SOL/USDT - Visible double top formationAfter hitting the projected reversal zone near 144–145, SOL/USDT has now formed a clean double top, reinforcing the bearish thesis initially outlined by the harmonic pattern. The second peak failed to break the macro descending trendline, and the price is now trading back below the 100% Fibonacci retracement of the XA leg.
This double top adds structural confirmation to the harmonic C-point rejection:
Volume remained lower on the second peak
RSI on the 30m chart printed a lower high while price matched previous highs — a textbook bearish divergence
PVT continues to flatten despite price volatility, suggesting a lack of bullish conviction
Price is now slipping below 143, and bearish momentum is building.

SOL/USDT – Bearish Harmonic Completion Near 144–145The 2H chart shows an extended X‑A‑B‑C‑D harmonic structure (an extended Bat/ABCD). Leg XA was the initial down-leg (from the recent swing high down to A), AB was a corrective pullback, and BC retraces sharply into the 88.6–100% zone of XA (around $144–$145). In a classic Bat/ABCD, the CD leg often completes near an 88.6% retracement of XA, so this C zone is a potential reversal point (PRZ). Importantly, C also sits on the chart’s long-term red descending trendline – a confluence of fib and trendline. A break below this level would “validate the bearish harmonic pattern,” with the downtrend line amplifying selling pressure. The projected D-point is ~$122.63 (late June/early July), which coincides with the lower green channel support on the chart.
Harmonic pattern (2H SOL/USDT): XA and AB moves set up a deep BC up into the 88.6–100% fib zone (around $144–145) at C. This confluence of fib levels and the macro descending trendline makes C a strong Potential Reversal Zone (PRZ). The CD leg targets ~122.63, aligning with lower channel support (green). Across timeframes the momentum is waning into point C. RSI is rolling over – price made a lower high while RSI failed to confirm (a classic bearish divergence). Meanwhile, the PVT (Price Volume Trend) line has flattened even as price crept higher, indicating the rally is not supported by volume.
Volume patterns also signal distribution: rallies into C have occurred on declining volume, a textbook sign that buying interest is drying up. Wyckoff distribution theory notes that as a top forms, “rallies during this stage often show lower volume” and ensuing drops on higher volume. In short, weakening RSI, a flat PVT, and thinning volume all confirm the selling pressure around $144–$145, consistent with a bearish reversal at C. Momentum and volume (15m SOL/USDT): RSI has peaked lower while price nears $145, and PVT has flattened (highlighted). Rallies into C come on lower volume, matching Wyckoff distribution cues. These divergences suggest the upward move into C is exhausted.
Trade Plan & Risk Management
Entry: Short initiated at $145.00 (near the PRZ around C).
Stop Loss: $146.20 (just above the red trendline and invalidation of point C).
Take Profit Targets:
TP1 : $129.00 (minor fib support, ~61.8% retrace of the last swing).
TP2: $122.63 (harmonic D projection and channel support).
TP3: $120.00 (extension to lower channel boundary).
Confirmation: Watch for a break of the short-term support at ~$139.50 for added conviction before letting profits run.
Note: A short position was opened at $145. This outline is for informational purposes – it is not financial advice. Trade with proper risk management.
Each target corresponds to technical levels (fib retracements and channel support). The first target aligns with a ~61.8% retracement (common fib TP level), and the final targets sit on the longer-term channel floor. If price breaks under $139.50, it would further confirm the bearish thesis.

Possible retest of 130$ support line incomingLooking at the downtrend (shown in orange) the 130$ support line will probably be retested again. When we hold the same support line, we can expect another retest of 146$. Hopefully with a good result 🚀! Anyway, I am buying some more if this will happen (going long from 130$) because there was enough volume at that level.

SOLUSDTCryptocurrency Futures Market Disclaimer
Trading cryptocurrency futures involves high risks and is not suitable for all investors. Cryptocurrency prices are highly volatile, which can lead to significant gains or losses in a short period. Before engaging in crypto futures trading, consider your risk tolerance, experience, and financial situation.
Risk of Loss: You may lose more than your initial capital due to the leveraged nature of futures. You are fully responsible for any losses incurred.
Market Volatility: Crypto prices can fluctuate significantly due to factors such as market sentiment, regulations, or unforeseen events.
Leverage Risk: The use of leverage can amplify profits but also increases the risk of total loss.
Regulatory Uncertainty: Regulations related to cryptocurrencies vary by jurisdiction and may change, affecting the value or legality of trading.
Technical Risks: Platform disruptions, hacking, or technical issues may result in losses.
This information is not financial, investment, or trading advice. Consult a professional financial advisor before making decisions. We are not liable for any losses or damages arising from cryptocurrency futures trading.
Note: Ensure compliance with local regulations regarding cryptocurrency trading in your region.

Solana is ready to pumpYou can clearly see that in the monthly timeframe, SOL is holding macro support and is well-positioned to push to new ATH into 2026 as the Fed cuts rates, BTC trends higher, and we see an alt season of sorts. Solana is read to pump.

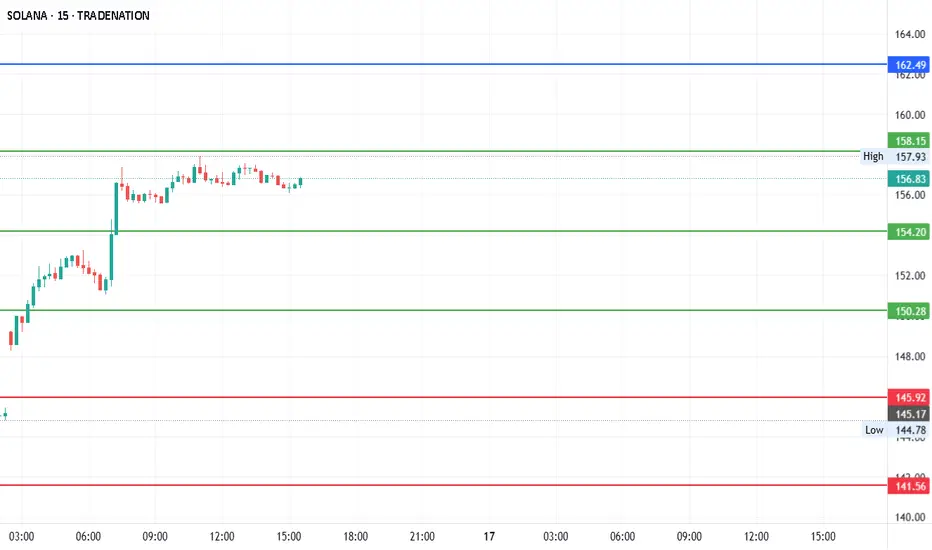
#SOLANA - Pivot Point is $154.20Date: 16-06-2025
#Solana Current Price: 156.37
Pivot Point: 154.20 Support: 150.28 Resistance: 158.15
#Solana Upside Targets:
Target 1: 162.49
Target 2: 166.84
Target 3: 171.58
Target 4: 176.32
#Solana Downside Targets:
Target 1: 145.92
Target 2: 141.56
Target 3: 136.82
Target 4: 132.08
$SOL Local Bottom FormingCRYPTOCAP:SOL closed the day back within the POI.
RSI oversold.
Should see a retest ~$136 to confirm the local bottom.

Solana looks scary. I don't like this rejection from the 1D 200MA.
Looking at the the weekly chart, it is very easy to see the similarity to 2022.
Maybe we should brace for impact?

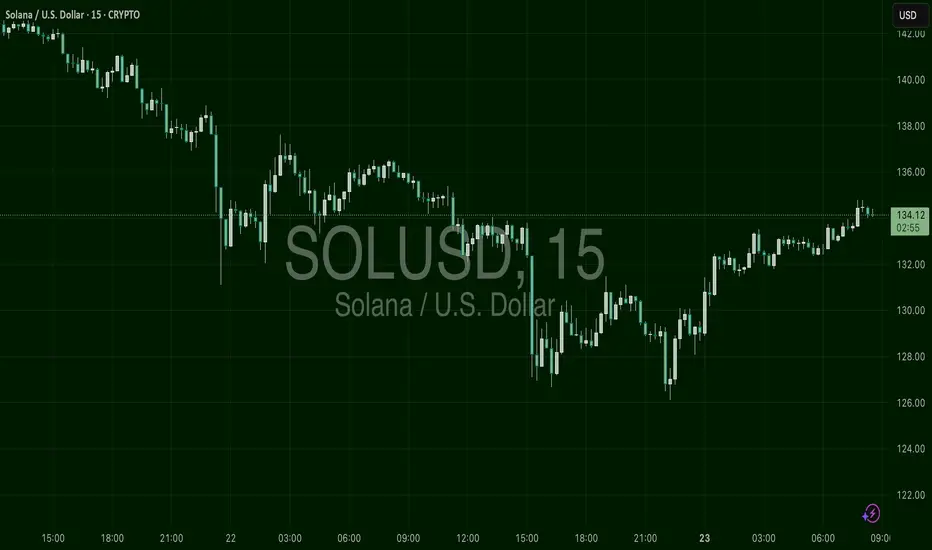
SOLUSD – Reversal Ignition ZoneSOL printed a textbook reversal. After getting slammed down to $126, it found strong support and printed a clean stair-step rise back into $134. Momentum is solid, and higher lows are stacking. The $132.50–$133.00 region now acts as demand. If price pulls back slightly and holds, expect a measured move toward $135.50–$136.50.
Solana Next Buying Zone on WatchCRYPTO:SOLUSD is correcting the 5 waves advance from April low within a 3 waves ZigZag structure and as price slipped to a new marginal low beneath last week’s support, signaling potential weakness toward equal legs area$122 - $111 before buyers look to step in again.
Keeping an eye on reactions in this zone—could set up for a bullish reversal once demand kicks in!

Do not try to buy the dip!!!! It can go lower. My overall bias for Solana is bullish based on its fundamentals. I am a solana investor so I have been accumulating Sol and staking them. I think the price will eventually move up but at this stage I don't see anything bullish in the Solana chart. It is certainly not the buy the dip moment because I can see the price can go much lower from here. (and I can be gladly wrong on this!).
Bearish setups I see in the chart:
1) The $140.50 zone had been working as a support line since April 2025 (red horizontal line in the chart), but the price decisively broke and closed below the zone on Friday.
2) The price has been trapped in the descending parallel channel since early May. Now the price broke below the support line, it might drop further to touch the bottom parallel channel.
3) There is an unmitigated fair value gap (not very strong one) around $125-6 area and the area also was working as a strong support line for several months last year (see blue horizontal line in the chart)
4) There is a large order block at $104 zone. If the downside move is aggressive, it can wick down to this level.
5) The price is below all EMAs.6) EMA 9<14<21<55<200 - Bearish
7) MACD and RSI are deep in the bear zone and they are pointing to the downside.
8) There is a big fair value gap in the weekly chart in the $95 area.
I don't like to go short on the asset I am fundamentally bullish on, so I will just stay on the sideline and observe how the price will unfold in the next few months.

Solana is cookedYou can clearly see that in the monthly timeframe, CRYPTOCAP:SOL retests the support trendline after breaking it and now, it's joever - Solana is now cooked.

Wait for SOLSOL has been attempting to break through its current all-time high.
At present, price action is pulling back and may soon retest the long-term support trendline.
It’s best to patiently wait for SOL to reach the identified buy zone, as outlined in the chart.
Disclaimer:
This analysis is based on my personnal views and is not a financial advice. Risk is under your control.

SOLANA Eyes Recovery After Retesting Monthly LowFenzoFx—Currently, SOL/USD trades at approximately $148.37, testing the previous monthly low, which aligns with a bullish fair value gap and is backed by a high-volume node area.
A close and stabilization above $149.3 can spark the uptrend. In this scenario, the next bullish target could be the $168.38 resistance.

Daily EMA 55 needs to move above EMA 200!!
My general bias for Solana is bullish. However, the current setup is very similar to the setup in Feb-Apr 2022 before Solana started a macro bear trend. (see blue rectangular box)
I am still waiting for a long trade opportunity. I am not looking for a short trade. I just need to sit tight and see how the price is going to unfold in the next few months in the daily chart.
The 2022 setup (see blue rectangular box in the chart):
1) EMA55 crossed below EMA 200 on 16th Feb 2022. (red vertical line in the chart)
2)The price found the temporary floor around $80 and sharply moved above both EMA55 and
200. (see light blue rectangular box)
3) It was the dead cat bounce. It was the beginning of the macro down trend.
4)The price spent months and months under $40 in 22 and 23, however, the price eventually
broke above both EMA 55 and 200 and when EMA55 crossed above EMA 200 in Oct
2023 (red vertical line in the chart), the macro bull trend started.
The current setup (see orange rectangular box in the chart):
1) EMA 55 crossed below EMA 200 on the 4th March 2025.
2) The price moved down to $95 area and sharply moved above both EMA 55 and EMA200. However, it failed to stay above them.
3) The price has been oscillating between $140 and $18. The price is still below EMA55 and EMA200. (see orange rectangular block)
In order to start a strong bull trend,
1) the price needs to close and stay above EMA 55 and EMA200.
2) EMA 55 needs to cross and stay above EMA 200. EMA55>EMA200
3) MACD and RSI need to enter the bull zone.
EMA55 and EMA200 do not cross easily (I mean decisively cross). It only happened three times since 2022, however, when they cross, the price moves very aggressively in one direction.
I think Solana is bullish fundamentally. I am not suggesting it is going to start the macro bear cycle. I am pointing out the price is still not showing a clear direction. From a technical analysis point of view, it might take some time before the trend forms. For now, it is only testing my patience!

SOL/USDT Rejected at Key Fib Zone – Bulls’ Last Stand at SupportRecap and Bias
The short-term bullish “orange” bounce scenario from the previous analysis failed to materialize. Solana’s price was rejected near 150, printing a lower high, and has since dropped back into the mid 140s. This confirms that the recent rally was a dead-cat bounce rather than a trend reversal.
The updated bias is cautiously bearish. This stems from rejection at resistance, weakening momentum, and a deteriorating volume profile. Unless price reclaims the 148 to 150 zone with strength, the bears remain in control. Only a decisive breakout above that level would shift the short-term outlook back to bullish.
Macro Context
Global risk sentiment remains fragile. The sudden escalation between Israel and Iran in early June, including reports of missile strikes, sparked a flight to safety. Solana’s rally quickly reversed, with price dropping over 15 percent since June 11.
Other geopolitical flashpoints also continue to weigh on investor confidence. The protracted war in Ukraine and ongoing disruptions in Red Sea trade routes have fueled broader market caution. This is contributing to periodic risk-off moves and spikes in volatility across both traditional and crypto markets.
On the economic side, uncertainty around US monetary policy is adding to pressure. Although May inflation cooled slightly, investors remain cautious ahead of upcoming Fed decisions. Crypto assets have traded weakly into these events, reflecting a wait-and-see approach.
Taken together, this geopolitical and macroeconomic backdrop is driving elevated short-term volatility and a higher risk premium in the crypto space. In this context, market participants are increasingly hesitant to take large directional bets without a clear catalyst.
One such catalyst may be the potential approval of a Solana ETF. Optimism has grown, with prediction markets now placing the likelihood of approval near 76 percent by late July. If approved, this could be a game-changing event that re-rates SOL’s medium-term valuation and breaks it out of its current downtrend.
Until then, traders should remain cautious and assume headline risk is elevated.
Multi-Timeframe Technical Outlook
Daily and 4H Trend
The high timeframe structure shows a clear downtrend. Lower highs and lower lows are intact. A double top formation from May broke down cleanly. Most recently, Solana was rejected at a key Fibonacci confluence zone around 149 to 151, which included the 0.618 retracement, the 20-day SMA, and a well-defined supply zone.
After that rejection, SOL has traded along the lower Bollinger Band with increasing volatility. The 20 SMA is now acting as dynamic resistance. All major trendlines have broken.
2H, 1H, and 30m Perspective
Shorter-term charts show SOL attempting to base near 143 to 145 support. Several oversold RSI conditions have triggered bounces, but these have lacked momentum. Harmonic pattern recognition shows that a bearish Deep Crab completed near 152, which marked the local top.
Currently, price remains pinned below descending trendlines and the 1H 20 EMA. Bullish momentum has yet to reappear in any meaningful way.
Key Technical Factors
Resistance: 149 to 151
This zone holds multiple levels of confluence. It includes the 50 to 61.8 percent retracement of the last swing, a 1.272 Fib extension, the 20-day SMA, and prior supply. The rejection at 151.7 was sharp and decisive. Unless price reclaims this zone, it remains a ceiling.
Support: 142 to 145
This is the last meaningful support zone holding price up. It is the neckline of a 12H Head and Shoulders pattern and the base of a previous multi-week range. It also coincides with the lower bound of a prior rising channel. The 50-day MA and 0.236 Fib retracement are also near this zone. If this area breaks, sellers will likely target 130 to 135 next.
Momentum: RSI 14 with MA Overlay
Daily RSI rolled over from above 70 with bearish divergence as price topped. RSI is now below its MA across all timeframes, reflecting negative momentum. On the 4H chart, RSI dipped below 30 and remains weak despite minor relief bounces. Lower timeframes show early divergence but no confirmed reversal signals.
Trend Structure
Price continues to make lower highs and lower lows. The 200-day MA was lost weeks ago. The 50-day is now flattening near 140. A death cross recently printed on the 12H chart, confirming bearish short-term pressure.
Volume and PVT
Volume favors the bears. PVT is in decline, showing more volume on down days than up days. The rally to 150 occurred on weak volume, while selloffs continue to show increasing size. This signals distribution, not accumulation.
Harmonic Patterns
A bearish Deep Crab pattern completed at the recent high. No bullish harmonics are confirmed yet. Traders should monitor the 130 to 125 zone for potential bullish completion patterns like a Gartley or Bat. If those form with oversold signals, they could mark the bottom.
Green Scenario: Bullish Breakout Path
Bias
Only valid on confirmed breakout
Trigger
Break and hold above 150. Ideally, an hourly close above 150 or daily close above 152 confirms the move.
Confirmation
Rising volume, RSI reclaiming 50, and a PVT uptick. A retest of 148 to 150 from above would reinforce the breakout.
Targets
First target is 155, which aligns with the 12H 50 EMA.
Second target is 162 to 165.
Extended targets include 170 to 180 and eventually the 200 psychological level if ETF news hits.
Stop Loss
Below 147 or back inside the 143 zone would invalidate the breakout and suggest a failed move.
Logic
If bulls reclaim 150 with strength, this would invalidate the lower-high structure. Shorts would begin covering and momentum could quickly shift. Breakout entries should focus on confirmation and volume expansion.
Red Scenario: Bearish Breakdown Continuation
Bias
Default scenario
Trigger
Clean break below 142. Daily close under 140 confirms the H and S neckline break.
Confirmation
Failing retests of 142, rising sell volume, and RSI staying suppressed. Price action showing impulsive red candles validates the move.
Targets
First target is 130 to 135.
Second target is 115 to 120.
Final measured move would project into the 100 to 110 zone if trend acceleration continues.
Stop Loss
Any reclaim of 145 to 148 would likely invalidate the breakdown and trap late sellers.
Logic
If this support fails, shorts will press. Bounces will likely be sold into. Traders can enter on the break or the first failed retest of 142. Consider scaling out near 135 and trail stops from there.
Strategy Summary
Current Bias
Leaning bearish unless bulls reclaim 150
Key Levels
148 to 150 is breakout zone
142 to 140 is breakdown zone
Trading Strategy
Range traders can play 144 to 150 but must be nimble
Breakout traders should wait for confirmation above 150
Breakdown traders can short under 140 with stops over 145
Risk Management
Volatility is elevated. Trade smaller size. Use tight stops and trail them. Wait for confirmation, not anticipation. Watch ETF news closely. If delayed, expect continued weakness.

SOLUSD – Eroding Support, Soft Fade ModeSolana rejected from just above $150 and has been sliding gradually. Price is forming a descending channel, and intraday momentum remains weak. Support near $145 is being tested frequently, suggesting that buyers are losing strength. Expect either a breakdown below $145 or a bounce that will be critical to determine next direction. Short-term traders may look to fade rallies toward $148.50.

Solana bag holders could soon be under pressureSOL prices are getting squeezed, and the price appears stuck in a descending triangle pattern, with a 20% downside potential if key levels break. Weighing on prices are the US economic slowdown and the Israel-Iran war. On the flip side, we may soon hear from the US government, with the President’s Working Group on Crypto expected to release their report before 22 July.
What’s your take on SOL? Will bullish or bearish forces prevail?
This content is not directed to residents of the EU or UK. Any opinions, news, research, analyses, prices or other information contained on this website is provided as general market commentary and does not constitute investment advice. ThinkMarkets will not accept liability for any loss or damage including, without limitation, to any loss of profit which may arise directly or indirectly from use of or reliance on such information.

Solana (SOLUSD) 4H Analysis – Rejection From Demand ZoneSolana is showing strong signs of accumulation after tapping a key 4H demand zone. Price is now stabilizing above $146 and may be preparing for a bullish push toward key resistance levels.
📌 Key Technical Highlights:
🔸 Strong Demand Zone – $146.92 to $140.00:
This orange zone has served as a launchpad in the past, and recent bullish rejection suggests buyers are active again.
🔸 Mid-Range Resistance – $165.70:
A previous flip zone and potential short-term target. If SOLUSD holds above $146, this level is likely to be tested again soon.
🔸 Major Supply Zone – $183.18:
This level marks a strong overhead resistance from previous highs. A break above $165 would bring $183 into focus.
🔄 Current Market Behavior:
SOL recently formed a double-bottom structure at demand.
Price is now pulling back slightly after a short-term bounce.
If buyers defend the $146 level again, expect a new wave toward $165.
🎯 Trade Setup:
Buy Zone: $146–$150
TP1: $165
TP2: $183
Stop Loss: Below $140
🧠 Insights:
With market sentiment gradually improving across altcoins, Solana is looking primed for a relief rally. A breakout above $165 would invalidate the lower high structure and confirm a trend reversal on the 4H chart.
---
💬 What’s your take on SOL this week? Bullish or still cautious? Drop your thoughts below 👇
📍 Don’t forget to follow for real-time crypto setups and insights!
#Solana #SOLUSD #CryptoTrading #TechnicalAnalysis #FrankFx14 #PriceAction #DemandZone #BullishSetup #LuxAlgo #Altcoins #TradingView
