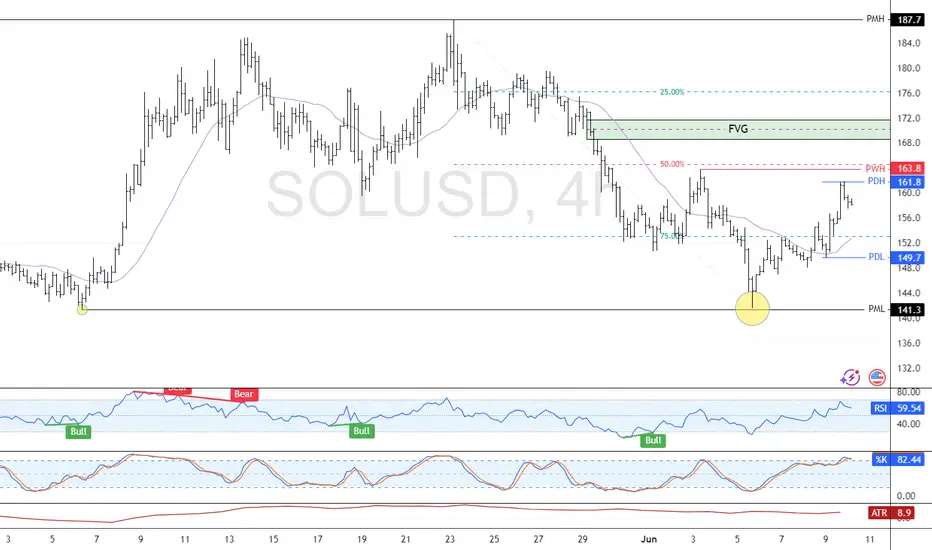
SOL/USDT at Key Inflection Point – Breakout or Rejection? Part 2Solana (SOL) is trading at a pivotal zone where price structure, harmonic patterns, and key technical indicators converge. This setup outlines three potential scenarios, guided by Fibonacci levels, auto trendlines, and momentum indicators.
Green Scenario (Confirmed Bullish Continuation)
A sustained hold above $155, especially if followed by a breakout through $156.50 with rising volume, would confirm the green path. This scenario reflects short-term bullish momentum strengthening, as RSI remains near 60 and PVT continues to climb. If confirmed, price may extend toward $160, with secondary targets in the $165–$172 range, aligning with the upper ascending trendline and harmonic extension.
Orange Scenario (Sideways-to-Bullish Consolidation)
This scenario becomes increasingly likely if SOL remains range-bound between $153.50 and $157.80. This consolidation zone overlays the 50–61.8% Fibonacci levels, Bollinger Band basis, and several key trendline intersections. With RSI holding in the 55–65 range and PVT stable, this setup would favor re-accumulation before another breakout attempt. Price action above $155 continues to support this scenario as the base case.
Red Scenario (Bearish Breakdown)
A breakdown below $153.50, especially if followed by a breach of $150 on high sell volume, would invalidate the bullish thesis. This scenario opens downside risk toward $147.35 and potentially $144.00–$140.00. RSI would likely drop below 50, and a flattening or declining PVT would confirm distribution. This path aligns with the broader red trendline and would indicate a rejection of the recent bullish breakout.
Indicators Used:
Bollinger Bands (BB 20, 2)
Relative Strength Index (RSI 14) with moving average overlay
Price Volume Trend (PVT)
Auto-generated trendlines
Harmonic Patterns (ABCD and XABCD)
Fibonacci Retracement and extension levels
Bias:
Short-term bullish if price holds above $155. Market structure, RSI, and PVT favor upward continuation or consolidation. A break below $153.50 would shift the bias toward neutral or bearish.
Strategy Outline:
Bullish if price breaks and holds above $156.50
Targets: $160 / $165 / $172
Bearish if price breaks below $150.00
Targets: $147.35 / $144.00 / $140.00
Scalping opportunity in the $153.50–$157.80 zone while awaiting directional confirmation
**This analysis is for informational and educational purposes only and does not constitute financial or investment advice. Trading cryptocurrencies involves significant risk and may not be suitable for all investors. Always conduct your own research and consult with a licensed financial advisor before making trading decisions. The author is not responsible for any losses incurred from reliance on this analysis.**
SOLUSD trade ideas

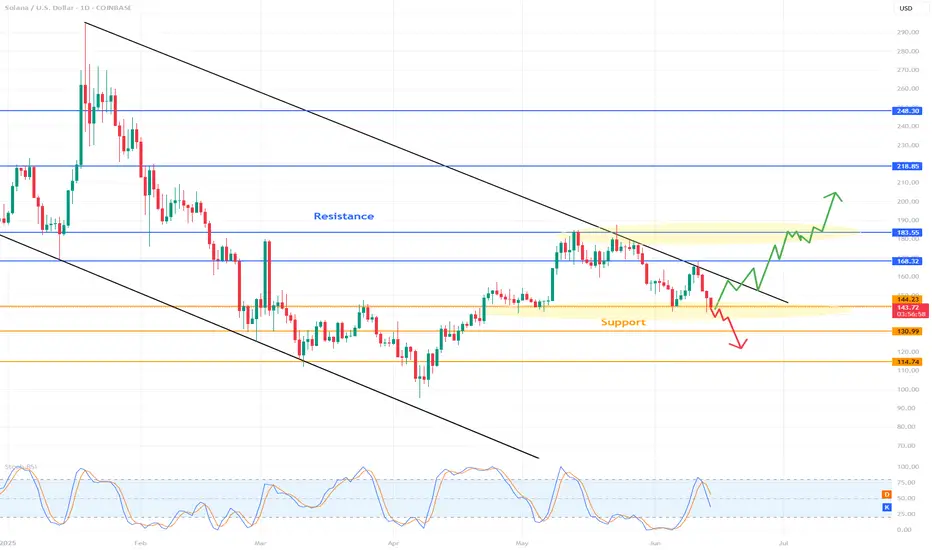
SOLUSD 1D Chart Review1. Main Trend
Downward Channel: Price moving in wide, downward channels (black trend lines), which means that the medium and long term remains bearish.
The upper trend line is a strong dynamic resistance, the lower one – support.
2. Key Horizontal
Resistance (Resistance):
$168.32: Strong resistance level, which it has responded to many times in the past.
$183.55: Another important resistance, confirmed by historical highs.
$218.85: Further resistance with an interval obligation.
$248.30: Very strong, long-term resistance (far from the current price for now).
Support (Support):
$144.23: actually occurs close to this support – very level.
$130.99: Another potential level where price could look for a rebound.
$114.74: Strong support, last bastion of bulls near March/April low.
3. Price action (Price action)
Last candles emitted pullback from downtrend line and down to support area of $144.23.
that any attempt to grow above trend line is limited by sellers.
$144.23 level currently existing short-term support - its loss may be available in case of $131 or possibly existing.
4. Indicator
Stochastic RSI (at the bottom of the chart):
Stochastic RSI indicator stated that airlines (blue and orange) were in power (overbought) in recent devices, but suddenly started to turn down.
Currently occurs in neutral zone, however application of protection (oversold). In case of threat occurrence now, it may suggest risk of attack, but it is not yet decided.
It is worth noting whether to go to the area of 20 and start turning back - in case of a necessary necessity.
5. Scenarios for the days
Bullish (growth):
Maintaining support at 144.23 USD and hitting the downtrend line (around 160-165 USD).
Breaking the trend line and resistance at 168.32 USD will give a signal to load in the area of 183-218 USD, but for the tenth time it seems to be less important, attention given the market structure.
Bearish (fall):
Breaking support at 144.23 USD and closing below on the daily candle - the next target to 131 USD, and then 114 USD.
The downtrend channel is still working against the bulls.
6. Summary
Main trend: downtrend.
Price: Close to support, but the risk of you leaving a big one.
Key horizontals: $144.23 (short-term support), $168.32 (main resistance).
Stochastic RSI: Heading towards oversold zone, but not yet giving a clear conclusion about a breakout.
Recommendation: Observe the application of price at $144.23 and the behavior of Stochastic RSI. In case of a breakout - it is possible that they will occur.
Hey, investors on crypto, All what do you have to know if really If really you want invest your money in crypto SOLANA . This simple analytics but safely for your wallet.
This is best area you should be waiting to buy if you are investor.
price between 84.00$ to 52$.

SOLANA SOL/USD Here's an important fan which shows me all the supports and resistances. Depends on the short-term move we'll realize the future. Ok thanks I'll try and call me back in time to see what the sho and I have no clue I think we

Boom📉 SOLUSD Reversion Entry – Capturing the Recovery
This chart shows a textbook example of how the ELFIEDT RSI + Reversion Strategy can help identify panic-driven lows and offer early reversal signals for a clean intraday recovery.
⸻
🟢 Signal Breakdown:
1. Sharp Drop into Oversold Territory
Solana (SOLUSD) experienced a large, fast selloff, breaking multiple support levels and triggering a flush in price. This type of move often represents emotional or news-driven liquidation — perfect for statistical reversion setups.
2. First “UP” Signal Printed at the Low
The strategy fired a buy signal just as price reached peak selling pressure:
• Price closed well below the lower volatility band
• RSI reached an extreme oversold zone
• The reversal candle marked the turning point
3. Second “UP” Signal on Confirmation
A follow-up signal printed one candle later, offering traders a second chance to enter the reversal with RSI already starting to recover upward.
4. Bounce Followed Shortly After
Price rallied from the lows, recovering several dollars in value and offering a strong mean reversion trade with limited downside risk.
⸻
✅ How Traders Could Have Used This Setup:
• Wait for the first “UP” label to print on a fast drop — especially after a vertical move like this
• Confirm with RSI turning up from deeply oversold conditions
• Use the low of the signal bar as your stop
• Target previous minor support/resistance or the moving average reversion zone as your first TP
⸻
💡 Why This Worked:
The trade worked well because:
• It was a statistical outlier move (rare volatility event)
• Volume and momentum exhaustion were confirmed by RSI
• The script visually identified the moment where price had likely stretched too far
⸻
This is exactly what the ELFIEDT strategy is designed for — catching those high-stress extremes where most traders panic, but structured reversion logic finds opportunity.

SOLUSD AnalysisFollowing the recent geopolitical tensions between Israel and Iran, we saw a sharp sell-off, which broke down from a key support zone. Currently, price action is consolidating within a rising wedge (bearish structure) on declining volume.
The trend remains bearish overall. I expect a potential relief bounce toward the $150 zone, where multiple EMAs and the edge of the Ichimoku cloud could act as resistance. If rejected there, my first downside target is $136 a key horizontal level from previous structure.
Keep in mind: this move is heavily news-driven, so headlines could continue to impact price action significantly.
RSI is still below 50 and struggling to break trendline resistance, which supports the bearish bias.

Already ready to go longMy bias for Solana is super bullish. I invest in Solana and I think it is still a good price to buy and hold, but I am planning to trade with leverage.
Currently, Daily EMA200 is dead flat and running across the candles.
MACD moving to the upside but still in bear territory.
There is a bullish momentum building up, however, there is a large sell order block sitting above the current price area, and the price can oscillate around EMA200. The similar situation is marked in the blue rectangular box in the chart.
I will open a long position when:
1) EMA 21 >EMA55> EMA200
2) MACD lines cross and move in the bull territory.
3) a daily candle closes above EMA21. (see red vertical line)

Weekly trading plan for Solana Solana looks weaker against BTC & ETH, but still the price is above PP and we can expect continued growth either now or after a local correction as long as the price is above PP
Write a comment with your coins & hit the like button and I will make an analysis for you
The author's opinion may differ from yours,
Consider your risks.
Wish you successful trades ! mura

Solana: Bearish Outlook Between $163.8 and $170.FenzoFx—Solana formed a double bottom at $141.3, making this level a target. We are bearish on Solana between the $163.8 and $170.0 resistance.
The target is $149.7, followed by $141.3.
SOL LONGliquidity, manipulation, imbalance and bearishness
bulls are in but looks like this can mitigate

Solana Wave Analysis – 9 June 2025
Solana: ⬆️ Buy
- Solana reversed from the support zone
- Likely to rise to the resistance level 163.80
Solana cryptocurrency recently reversed up from the support zone between the key support level 141.65 (which has been reversing the price from April), lower daily Bollinger Band and the 50% Fibonacci correction of the upward impulse (1) from April.
The upward reversal from this support zone created the daily Japanese candlesticks reversal pattern, the Piercing Line.
Given the improved sentiment across the cryptocurrency markets, Solana can be expected to rise to the next resistance level 163.80 (top of the previous wave B).

Solana - Short Term Update (Expecting around 20 points move)Expecting around 20 points move any side.
Current Price: 152.03
Upside: 162.19, 166.60,171.40 and 176.20
Downside: 145.42, 141, 136.20 and 131.40
Range: between 149.85 and 157.79

#SOLANA - 40 POINTS | 219.87 OR 129.78?Date: 19-05-2025
#SOLANA Current Price: 165.84
Mid-Point: 174.83
Upside Targets: 191.37, 200.57, 210.22 and 219.87
Downside Targets: 158.32, 149.09, 139.43 and 129.78
Support: 167.55
Resistance: 182.17
#SOLANA
#SOLANAChartAnalysis

Solana reversalCurrently, the stochastic oscillator shows an oversold situation for Solana, despite the price reversal. The price is moving on a curved support line with a short-term target of $180.

Is there hope for Solana?After a retest of support around $142, SOL is testing previous support as resistance around $152.
A strong break and retest of the $153 area could signal price reclaiming support and heading towards $166.
Failing to do so could lead to a retest and confirmation of $140 as support. Of course, losing support would signal further weakness towards $136 before a reversal potentially taking place.
As mentioned before, price is still trading below 1D 200MA, which could either be signaling weakness or the potential for more upside.
Considering the downward direction of the 1D 200MA could also be a bearish signal, however, this also usually happens before a reversal.

SOLUSD AT CRITICAL ZONE: Bounce or Breakdown? | Price Action Solusd has entered a major demand zone between $146.92 – $150.77, holding price for the last 24 hours. Buyers are showing signs of stepping in after a prolonged downtrend — could this be the start of a bullish reversal?
🔶 Key Technical Zones:
Demand Zone (Support): $146.92 – $150.77 🟠
Mid-Range Resistance: $165.70 🔷
Major Supply Zone: $183.18 🔵
📌 Current Price: $150.77
🔍 Recent Reaction: Strong bounce from the lower bound of demand, signaling potential accumulation
🚀 Bullish Targets If Momentum Builds:
1. TP1: $165.70 (~+10%)
2. TP2: $183.18 (~+21%)
🔔 What to Watch For:
1H or 4H bullish engulfing candle close
Break and retest of $155 for confirmation
RSI/Volume divergence or early reversal patterns
📉 Bearish Scenario: Breakdown below $146.92 opens room to revisit sub-$140 levels — caution advised if support fails.
💬 Your Move: Will bulls push SOL back to $180 or is another leg down coming?
Drop your predictions in the comments 👇 & Follow for daily crypto chart updates!
#Solana #CryptoTrading #SOL #TechnicalAnalysis #Altcoins #PriceAction #CryptoCharts #BuyTheDip

BULLISH SOLANAI am Bullish From $147.00 with stop loss at $110.
Price has retraced 50% from 7 April LOW to 23 May High Fibo Levels. With A good fundamental backing from the US jobs/Labour reports it seems that we might have a bottom in play an also good buy entries for solana. (RISK APPETITE)
My view on solana is long term and not yet very clear on where to place my TARGETS, but as long as my SL holds on a daily Chart at $110 I will stay Bullish.
Yes we are below the 200 EMA as Well as the 100EMA but as per the Fibo Levels I will stay bullish, A Pullback to $130 is possible if $140 cant hold that will line up with the 61.8% FIBO from the SAME Time as mentioned previously.
IF, Indeed this happens and the price holds at $130 I will add to my Bull Trade.
Technically Solana looks very BUllish for the Medium to long Term with Solid Support at $100, Until Broken My Bullish Analysis will stay in Play

Solana to the moon this is my updated strategy on solana , xe are xaiting for a second retracement on this level ; to take our long position aiming for a 1:10

Solana H4 | Potential bounce off 50% Fibonacci supportSolana (SOL/USD) is falling towards an overlap support and could potentially bounce off this level to climb higher.
Buy entry is at 140.92 which is an overlap support that aligns with the 50.0% Fibonacci retracement.
Stop loss is at 122.00 which is a level that lies underneath an overlap support.
Take profit is at 160.65 which is an overlap resistance.
High Risk Investment Warning
Trading Forex/CFDs on margin carries a high level of risk and may not be suitable for all investors. Leverage can work against you.
Stratos Markets Limited (tradu.com ):
CFDs are complex instruments and come with a high risk of losing money rapidly due to leverage. 63% of retail investor accounts lose money when trading CFDs with this provider. You should consider whether you understand how CFDs work and whether you can afford to take the high risk of losing your money.
Stratos Europe Ltd (tradu.com ):
CFDs are complex instruments and come with a high risk of losing money rapidly due to leverage. 63% of retail investor accounts lose money when trading CFDs with this provider. You should consider whether you understand how CFDs work and whether you can afford to take the high risk of losing your money.
Stratos Global LLC (tradu.com ):
Losses can exceed deposits.
Please be advised that the information presented on TradingView is provided to Tradu (‘Company’, ‘we’) by a third-party provider (‘TFA Global Pte Ltd’). Please be reminded that you are solely responsible for the trading decisions on your account. There is a very high degree of risk involved in trading. Any information and/or content is intended entirely for research, educational and informational purposes only and does not constitute investment or consultation advice or investment strategy. The information is not tailored to the investment needs of any specific person and therefore does not involve a consideration of any of the investment objectives, financial situation or needs of any viewer that may receive it. Kindly also note that past performance is not a reliable indicator of future results. Actual results may differ materially from those anticipated in forward-looking or past performance statements. We assume no liability as to the accuracy or completeness of any of the information and/or content provided herein and the Company cannot be held responsible for any omission, mistake nor for any loss or damage including without limitation to any loss of profit which may arise from reliance on any information supplied by TFA Global Pte Ltd.
The speaker(s) is neither an employee, agent nor representative of Tradu and is therefore acting independently. The opinions given are their own, constitute general market commentary, and do not constitute the opinion or advice of Tradu or any form of personal or investment advice. Tradu neither endorses nor guarantees offerings of third-party speakers, nor is Tradu responsible for the content, veracity or opinions of third-party speakers, presenters or participants.

Sol, setting!? or will it rise!
In our last Solana ( CRYPTOCAP:SOL ) update, we discussed the potential for a bounce and posed the critical question: would it be a retest or a reclaim? That distinction is now front and center as price action unfolds.
The 141 area remains the level bulls must defend. A clean reaction here, ideally with a supportive pattern, would create favorable conditions for upside continuation. However, if price returns above 169 , the current impulsive structure downward would be invalidated and a recount would be warranted, that could also be the end of the correction.
Zooming out, the bigger question is whether we are in the C wave of a flat correction. If that’s the case, then this impulse Should be the final move before a change in trend. Conversely, an impulse shouldn't be taken for granted nor lightly, I could set the stage for further down side. If a C wave, this pattern could set the stage for a powerful move after it completes.
In simpler terms:
If bulls hold 141 and reclaim momentum, the structure could shift bullish quickly.
If this is a flat, the C wave down is still unfolding, and we may need to endure one more leg lower before a true trend reversal.
Either way, patience is key. Let the chart print clarity.

$Sol is looking bullishCRYPTOCAP:SOL is looking very bullish after forming a beautiful double bottom on the 15 min chart. Might take the TRADENATION:SOLANA chain memecoins up with it. TPA1 $158.3 and TP2 $159.64

The rectangular box shows accumulation or consolidation,BrokenThe price should not close inside the box then the trade is not validated. A false breakout is possible if price drops back into the box. Strict stop loss.

Weekly trading plan for SolanaIn this idea I marked the important levels for this week and considered a few scenarios of price performance
The situation is similar to BTC & ETH, not a big correction, but the RSI already shows a local bearish divergence. Therefore, it is possible to see a correction before further growth
Write a comment with your coins & hit the like button and I will make an analysis for you
The author's opinion may differ from yours,
Consider your risks.
Wish you successful trades ! mura
