SOL Analysis Deep Dive: Identifying Optimal Entry and Exit ZonesYesterday, SOL gave a sharp downside shakeout, dropping from the weekly open at $147.98 (perfectly retested) down to the 0.5 Fib retracement of the swing at $140.25. Here’s a structured breakdown of the key levels, trade setups, and R:R profiles for both longs and shorts:
🔑 Key Levels & Confluences
1. Higher-Timeframe Opens
Weekly Open & Retest: $147.98 – pivoted price before the drop
Monthly & Prior-Day Open Cluster: $147.98–$146.31 – strong support confluence zone
2. Fibonacci Support Zones
0.5 Fib at $140.25 – primary mean-reversion entry
0.786 Fib (smaller wave) at $138.78 – secondary, deeper support
3. Order Block
Daily Bullish Order Block at $139.87 – just below 0.5 Fib, adds extra support
4. Volume-Weighted Average Price
Anchored VWAP (from ATH $295.83) at ~$166.45 – key upside resistance
5. Market Profile Value Areas (10-Day Range)
Value Area High (VAH) at ~$153.00 – overhead resistance confluence
Value Area Low (VAL) at ~$145.75 – underpins support
📈 Long Trade Setups
1. 0.5/0.786 Fib + Daily Bullish Order Block
Entry: $141-138.78
Stop-Loss: $137.5
Target: $165 (anchored VWAP / Fib zones)
R:R ≈ 9:1
2. Higher-Timeframe Open Cluster
Entry Zone: $147.98–$146.31(monthly/weekly open)
Stop-Loss: $142.5
Target: $165
R:R ≈ 3:1
• Why these levels? The 0.5 Fib is a classic mean-reversion zone, bolstered by the daily order block. The $147–146 zone ties together multiple opens (weekly, monthly, prior-day), offering a solid demand area if price retraces back up.
📉 Short Trade Setup
Trigger: Rejection / swing-failure around $153.4
Entry: $153.4
Stop-Loss: $154.3
Target: Weekly/Monthly open (~$147)
R:R ≈ 6:1
• Low-risk short: A clean rejection at the recent high lets you define risk tightly above the swing, aiming to capture the retrace back to the opens.
🎯 Summary & Game Plan
Primary bias: Look for long entries at the 0.5 Fib ($140.25) or the open-cluster zone ($147–146), with targets toward the anchored VWAP at ~$166.
Alternate bias: A short on clear rejection from $153.4, targeting the opens as support.
Risk management: Keep stops tight (SL below $137.5 or above $154.3) to maximize R:R on your favored setups.
Volume & Price Action: Confirm entries with an uptick in volume or bullish price structure (for longs) or swift failure patterns (for shorts).
Now it’s a waiting game! Let price revisit these zones, watch for confirmation signals, and then scale into your chosen side. Good luck! Don't chase, let the charts come to you!
____________________________________
If you found this helpful, leave a like and comment below! Got requests for the next technical analysis? Let me know.
SOLUSDT.3L trade ideas

SOL/USDT – Bullish Market Structure Shift with Clean Targets AheSolana has shown a clear change of character (CHOCH) followed by a break of structure (BOS) on the 4H timeframe, indicating a strong bullish reversal. After forming a series of bearish BOS during the downtrend, the recent structural shift suggests buyers have stepped in.
📌 Key Highlights:
Clear CHOCH confirming trend reversal
Recent BOS signals bullish continuation
Price reclaiming demand zone and flipping structure
Targeting major supply area near $240–$250
Ideal RR setup with stop below recent structure and target into inefficiency/liquidity zone
If price holds above the recent breakout zone, we could see a strong continuation toward previous highs. Watch for minor pullbacks to validate entry opportunities.

Solana SOL price analysisToday, a press release was published that CRYPTOCAP:SOL Strategies (aka MicroStrategy from the world of #Solana) bought another 122,524 CRYPTOCAP:SOL at $149
Earlier, the company said it would sell $500mn in convertible bonds, to buy #Solana, which capitalized now is at $74bn
Well, if you look at the OKX:SOLUSDT chart, we can say that it would be good to keep the price above $107-115, above the trendline, which has been going on since the beginning of 2023.
Once this condition is met, we can start dreaming again about the start of a super march of the #SOLUSD price to $790 in 2025.
_____________________
Did you like our analysis? Leave a comment, like, and follow to get more

SOLUSDT | 1 DAY | SWING TRADING Hey friends!
I’ve put together a detailed analysis on Solana just for you. The harmonic pattern has completed, and we’ve already seen some strong buying from that exact zone. 📈
Now, I’ve got two targets for you:
🎯 Target 1: 170.00
🎯 Target 2: 219.00
🔴 STOP: 75,81
"Just a heads-up — since this is a swing trade, the target might take some time to hit. Good to keep that in mind."
Remember, the more love and likes I get from you, the more motivated I am to keep sharing these analyses. All I ask is for a simple like to show your support. 💙
Huge thanks to everyone supporting with their likes — I truly appreciate it!

Solana Bullish Continuation Points To $418-$617 Next ATH TargetAll the loses incurred since late February have been recovered, Solana is now green. The action today is a full green candle as a continuation of the recovery that started 7-April. This date marked the end of the correction and also the start of the 2025 bull market cycle, period, phase and wave.
Solana is going up and set to grow long-term.
It is good. Nothing can stop what is happening from happening.
Nothing can stop the 2025 Cryptocurrency bull market. This is a major global event.
Cryptocurrency is the future of money, the present of money and is here to stay.
Solana is one of the top projects with a huge market capitalization and a thriving ecosystem; we want more.
Solana is ready now, bullish now, ready for the next target, let me tell you about those.
1) Easy target $195 will be hit first within days. This one is too easy so you can ignore and continue to hold.
2) Easy target $218 and we are growing nicely.
3) $252 is the first resistance on the way up. This resistance will be broken easily and the ATH challenged before additional/maximum growth.
4) Once the ATH gets conquered, everything will turn pretty good. Solana will enter the "price discovery phase." The first stop above the All-Time High is $418, followed by additional growth for sure. Cryptocurrency will do awesome in late 2025. You read this here first.
5) The main target for this bullish wave will be $617. This is a place where one can take profits but you should still expect additional growth.
The bull market will be long and strong. The bear market will be weak and short.
This dynamic will be present for an entire decade, as the world adapts to Cryptocurrencies and adopt them as the default means to exchange value. New money baby! Virtual money. Digital money. Technology money. A new generation. Prosperity, freedom and growth. That's Crypto.
Thanks a lot for your continued support.
Namaste.

SOLUSDT – Bullish Flag Below 200 EMA | Breakout Coming?SOL broke out of the bearish trendline and flipped to a bullish structure. Since then, a bullish flag has formed in the daily timeframe.
The price is now just below the 200 EMA, which is acting as resistance. A clean breakout above this level could trigger the next leg up.
Dynamic EMA Crossing Indicator– which flashed a Buy signal recently, giving more confidence to the bullish setup.
If the flag breaks out and the price clears the 200 EMA, the next target is around the 180 zone (resistance).

$SOLUSDT likely to retrace for a bigger bullish move!!!BINANCE:SOLUSDT looks like it is running out of steam as it approaches a major resistance. In the coming weeks, BINANCE:SOLUSDT is expected to retrace back to a minor support and resistance zone (marked out in the chart) where it will gain reasonable momentum for a bigger pump to at least $260 and above. Be on the lookout.
Kindly support this analysis to enable it reach to other people, and do comment your thoughts.

#SOL/USDT#SOL
The price is moving within a descending channel on the 1-hour frame, adhering well to it, and is on its way to breaking it strongly upwards and retesting it.
We are seeing a bounce from the lower boundary of the descending channel, this support is at 172.
We have a downtrend on the RSI indicator that is about to break and retest, which supports the upward trend.
We are looking for stability above the 100 moving average.
Entry price: 173
First target: 176
Second target: 180
Third target: 183

DeGRAM | SOLUSD Held the $145 level📊 Technical Analysis
● SOL broke above the long-term descending resistance near $130 and held it on a retest, confirming a bullish reversal.
● A consolidative range between $145 support and $154 supply has formed; a decisive break above $154 targets the rising-channel top near $160.
💡 Fundamental Analysis
● SOL staking volume recently surpassed Ethereum’s, underlining robust on-chain yield demand.
● DeFi Development Corp filed to offer $1 billion in securities to boost SOL holdings, signaling institutional accumulation.
✨ Summary
Resistance-turned-support at $145, strong staking growth, and corporate demand support a short-term long bias: targets $154 → $160; invalidation below $140.
-------------------
Share your opinion in the comments and support the idea with a like. Thanks for your support!

You lost the profit..If you are left with a profit from Solana, wait for a correction from the selected area.
In case of correction, the appropriate areas for buying are indicated.
You can buy in steps, I will also tell you the areas for selling in profit in the next posts.

Financial Markets Are Not Known for Their CharityFinancial markets are not charitable institutions—they operate on risk, speculation, and the push and pull of supply and demand. Many retail investors learned this the hard way.
Last November, retail investors rushed in at market highs, driven by optimism and FOMO. Now, many are clinging to their high entry points, hoping for a break-even price—even though some would need at least a 5x return just to get back to entry price one . The market, however, does not move according to people’s wishes.
Some retails are holding on, hoping to break even, but the reality is that they may never see those initial values again. Others, especially those with small wallets , are chasing big wins—sometimes looking for a 10x return—which often leads to deeper losses.
Remember this : " Financial Markets Are Not Known for Their Charity " .
BINANCE:ETHUSD BINANCE:XRPUSDT BINANCE:DOGEUSDT BINANCE:SUIUSDT

SOL LONG AND SHORT OPPERTUNITYSOLUSDT chart shared with 4h time frame analysis, I am expecting price to go slightly up to invite late FOMO longers and then come down to hunt their stop losses, when price will come down and hunt stop losses of LONG traders then they will try to enter Short but here I am expecting price to come and fill SSL and FVG and then go LONG and target buy side liquidity and supply zone. This is my plan.

5.5 RR tradeAssuming that one more impulse to the upside occurs from this corrective phase, this would be an excellent entry with great risk:reward and reasonable target!

Long Trade
15min overview
30sec TF entry
🟩 Buyside Trade Idea
📈 Pair: SOL/USDT
🏷️ Type: Intraday | LND Session AM
🧠 Setup: Breakout + FVG + Demand Flip
📅 Date: Sunday, 11th May 2025
🕟 Time: 4:30 AM
🔹 Entry Price: 172.632
🔹 Profit Target: 180.249 (+4.41%)
🔹 Stop Loss: 172.260 (-0.22%)
🔹 Risk-Reward Ratio: 20.00
🔍 Reasoning:
Confirmed buyside directional bias following a break of trendline liquidity. Consecutive Fair Value Gaps (FVGS) formed during upward movement, showing consistent institutional flow. A former supply zone flipped to demand, and the prior consolidation phase has been mitigated, providing confidence in a continuation toward higher liquidity zones.
📌 Status: Planned
5min TF overview

#SOL Don't worry until 240 $.but after that, 60 $ is coming.#SOL Don't worry until 240 $.but after that, 60 $ is coming.
#SOL Crash. We already warned when SOL is Trading above 240 $ ..
Past Analysis also attached.

SOL lower high/pullbackSOL nice LTF range, broke range -> range high reclaim now in next grey box -> potential sweep of highs -> reject red box into lower high or decent pullback before ATHs

HolderStat┆SOLUSD bullish channel points higherAfter a consolidation base, SOL launched into a growing ascending channel. As long as price respects the lower trendline, bullish momentum is expected to continue with a potential target near $170-180.
💡 Short-term pullbacks inside the channel may offer entries as bulls eye higher resistance zones.

SOL LIVE TRADEHello dears
Given the price support by buyers and the formation of higher ceilings and floors, we can open a trade with risk and capital management.
*Trade safely with us*

SOL/USDT DAILY CANDLESOL/USDT
A bullish trend of daily candles has been ongoing for 13 candles and will end if 5 bearish candles form when the 13 candles are fulfilled.

SOLANAThis is just to show you how I look for my entries in my trading strategy. Please do not copytrade or market enter in solana after seeing this. This is purely an educational post for you to see so if you want, take notes and later apply and win!
Thanks for reading : )

SOL breakout?Trading SOL on LTF was a good scalp; coming to the HTF, now this is looking good
Price action is still at exponential resistance, though. Fingercrossed, the bulls hold strong
Using STIC, i'm still bullish till otherwise.
#Tradesmartly

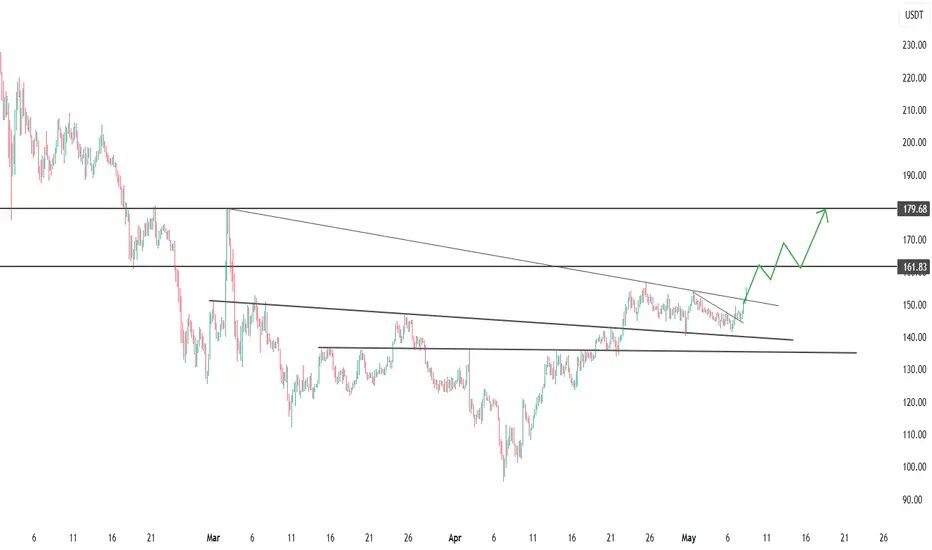
SOL broke through the resistance line near $150CRYPTOCAP:SOL - wedge broken, bulls take control
Price broke out of the descending wedge (140-150 → 150-162) and closed above 150 USDT on higher volume - a break of the medium-term trend.
📌 Levels
- S1 150 ± 3 - retest zone, S2 140 - April base.
- R1 161.8 - March resistance, R2 179-180 - wedge height and supply zone target.
📈 Scenario
A consolidation > 161.8 activates a move to 180; if successful, a push to 195 is possible.
⚠️ Risks
Failure < 147 will bring price back inside the wedge with a chance of 140.
As long as 147-150 holds, priority long.
Solana (SOL): Gameplan Remains The Same | Aiming at $100 Solana's game gameplan has not changed for us, where we are still looking for that downward movement to form a proper support zone near the psychological area at $100.
More in-depth info is in the video—enjoy!
Swallow Academy
