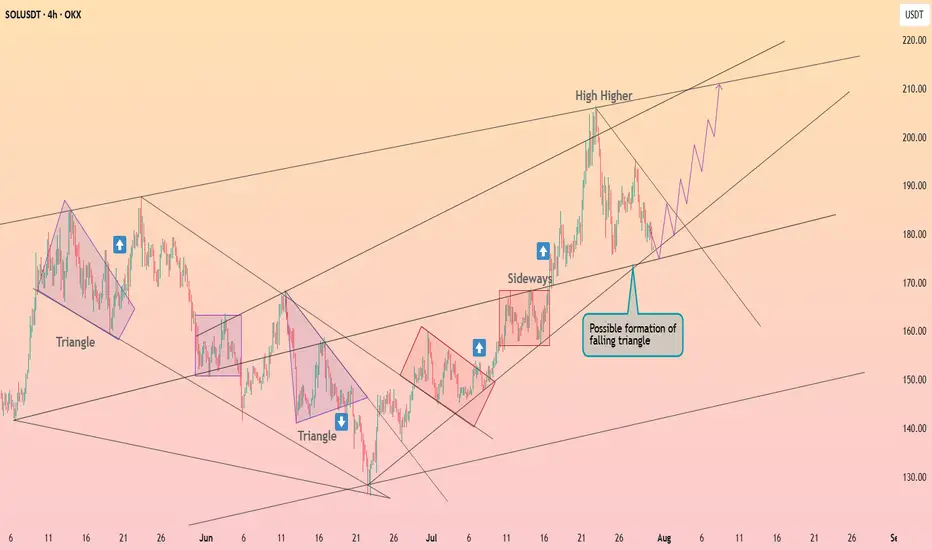
Solana is forming the falling triangle ┆ HolderStatOKX:SOLUSDT is compressing into a possible falling triangle, with support around 180–185 and upward projections pointing toward 210+. The chart has repeatedly shown triangle breakouts into strong rallies. As long as the lower trendline holds, the upside setup remains valid.
SOLUSDT.P trade ideas
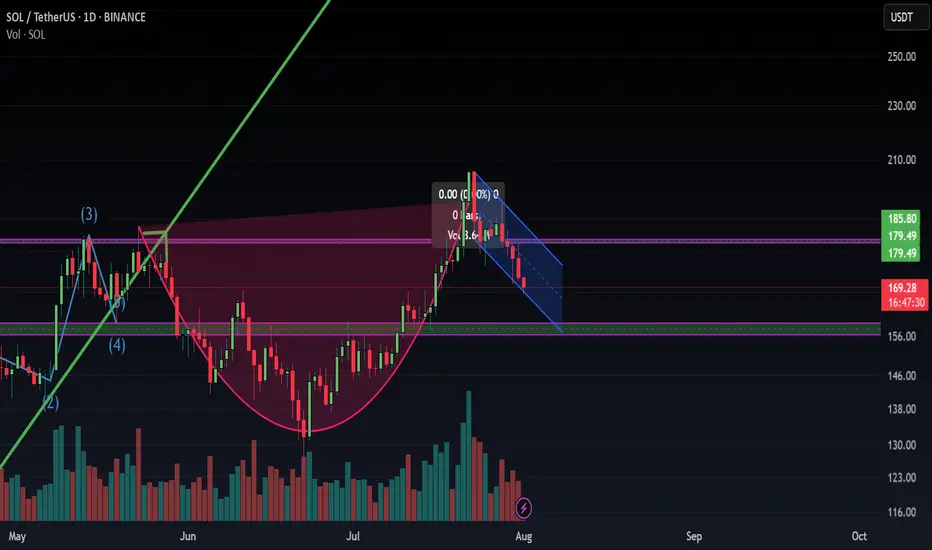
SOL gives a SOUL!SoL just has happened as I told and mentioned earlier, this range looks very lucrative as of now and can turn things in a good manner! Observe where it goes

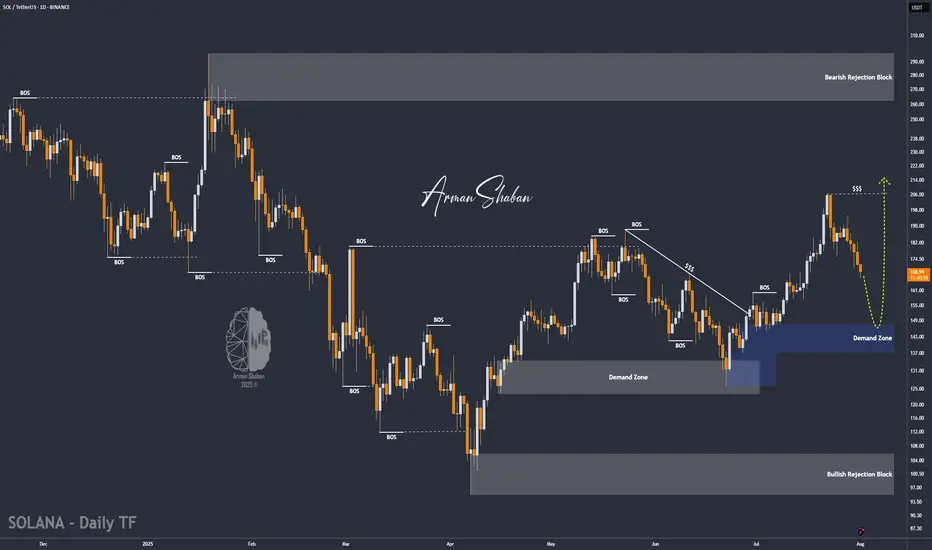
SOL/USDT | NFP Volatility Could Trigger Drop Toward $154!By analyzing the Solana chart on the daily timeframe, we can see that the price is currently trading around $169. If it fails to hold above the $168 level, a deeper drop could follow. With the upcoming NFP data release, increased volatility is expected across the markets. If Solana begins to decline, the potential correction targets are $163, $157, and $154. Watch the $145–$154 zone closely for a possible bullish reaction and buy opportunity.
Please support me with your likes and comments to motivate me to share more analysis with you and share your opinion about the possible trend of this chart with me !
Best Regards , Arman Shaban
Your Technical Analysis Improved, But Your Account Didn't. Why?You're learning more. Your charts look cleaner.
But somehow... your losses just keep getting worse?
If that feels familiar, this breakdown might explain exactly why.
Hello✌️
Spend 3 minutes ⏰ reading this educational material.
🎯 Analytical Insight on Solana:
BINANCE:SOLUSDT is testing a key trendline and daily support that aligns with Fibonacci levels 🔍. A clear break above the psychological resistance at $210 could trigger at least a 16% rally, targeting $230 🚀.
Now, let's dive into the educational section,
🧬 The Precision Trap
The better your analysis gets the narrower your entries become.
You start avoiding trades unless every single box is ticked. But guess what Markets don’t tick boxes. They break them.
Overanalysis creates tighter stops smaller buffers and a mind that’s too afraid to pull the trigger.
💰 The Hidden Greed in Smart Trades
Better analysis often brings a false sense of confidence. You expect more precision more profit.
This turns into silent greed masked as logic. Suddenly you risk bigger positions because this one is obvious.
But pros don't risk more when they’re more confident. They risk consistently.
💭 The Mind That Blocks Your Profits
You didn’t lose because you didn’t know. You lost because you knew too much and became a slave to it.
When your brain seeks confirmation not clarity it sabotages trades that were ready to work.
Don't let analysis chain you to hesitation.
🔄 Analysis or Addiction
Ask yourself honestly
Are you using your analysis to take action or to avoid it
Charts should guide you not paralyze you. If you need six signals to feel safe you’re not analyzing you’re hiding.
🧃 Every Chart Has a Bias
What looks like a sell to you might be a buy to someone else.
Why Perspective. Some buy the bounce others short the breakdown.
So if your top-tier analysis still leads to losses maybe it's time to stop upgrading tools and start upgrading your lens.
🧨 The Overanalysis Spiral
Your brain can’t juggle thirty signals. But most traders try anyway.
This doesn’t make you smarter. It makes you slower more anxious and emotionally drained.
Good trading isn’t about more info. It’s about clearer action.
🧱 The Mind That Won’t Let You Win
The more you lean on your indicators the more you fear breaking their rules.
You skip solid trades just because one tool says maybe not yet.
At that point it’s not risk management. It’s dependency. Let tools guide not dominate you.
🛠️ TradingView Tools That Help Or Hurt Your Mindset
It’s not about what tools you use. It’s how you use them.
Here are a few tools that when used right can actually improve both your decision-making and emotional control:
Session Volume and VWAP
Don’t just chase setups blindly. Check price versus VWAP. Often entries you feel are great are just late reactions to intraday rebalancing.
RSI and Auto Divergence
Don’t focus on RSI values alone. Use divergence indicators that highlight hidden bullish or bearish signals. Many traders miss moves by ignoring the tension RSI reveals.
Long Short Position Tool
Try using this for mental reps. Plot fake trades. Watch how the market behaves without risking capital. Over time you’ll train your brain not just your account.
These tools won’t fix your psychology but they’ll mirror it. And that’s where real change begins
🎯 Final Thoughts
Great analysts don’t trade everything they understand.
They understand what not to trade.
If better charts aren't bringing better results stop upgrading your screen and start rewiring your mindset.
✨ Need a little love!
We pour love into every post your support keeps us inspired! 💛 Don’t be shy, we’d love to hear from you on comments. Big thanks , Mad Whale 🐋
📜Please make sure to do your own research before investing, and review the disclaimer provided at the end of each post.

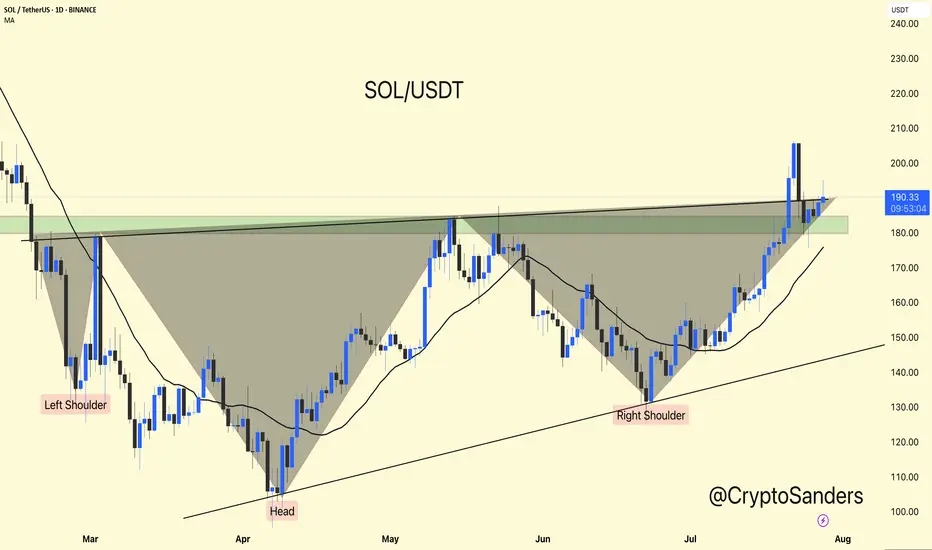
SOL/USDT Daily Chart Update:Solana has completed a classic Inverse Head and Shoulders pattern, breaking out above the neckline near the $185–$190 zone.
Currently holding above the breakout zone, showing bullish strength.
As long as SOL stays above the neckline support, continuation toward $210–$230 remains likely.
Trend remains strong above the moving average.
Stay updated and manage your risk accordingly.
DYOR | NFA
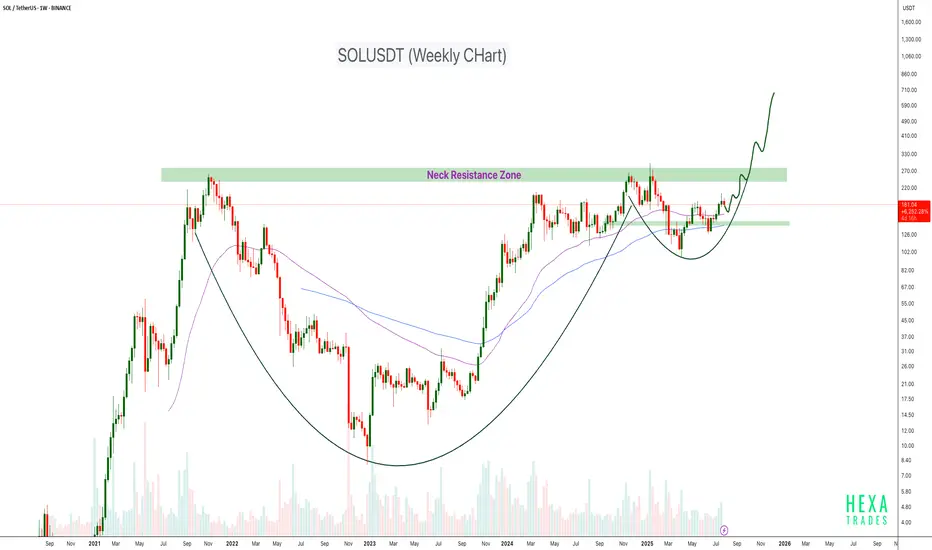
SOLUSDT Cup & Handle Formation CRYPTOCAP:SOL is forming a large Cup and Handle pattern on the weekly timeframe, a classic bullish continuation structure. Price is currently approaching the neckline resistance zone around the $250–$280 level. This area has acted as a major barrier in the past, rejecting the price multiple times, but the structure suggests it's now being retested with greater momentum.
If the neckline breaks cleanly with strong volume, the projected target could push SOL into the $600–$700+ range over the coming months.
Cheers
Hexa
BINANCE:SOLUSDT COINBASE:SOLUSD
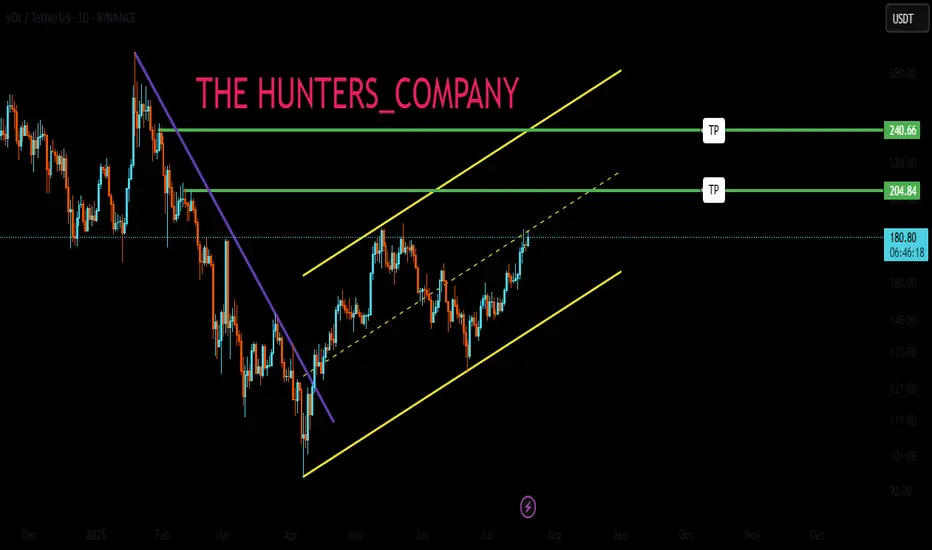
Soul for souls Our BTC target was on spot and exceeded our expectations
Alts will follow and now everything looks set and more clear could be the real alt season,
Anyhow my target for soulusdt and I was being conservative I do expect it to go higher but that down to preference
Enjoy

Just like #AKRM, #SOL can also pump 100%Just like #AKRM, #SOL can also pump 100%..
SOL will also have this kind of exit rally. Whether there is a war between the US, Iran, and Israel or not, the market will crash very badly.

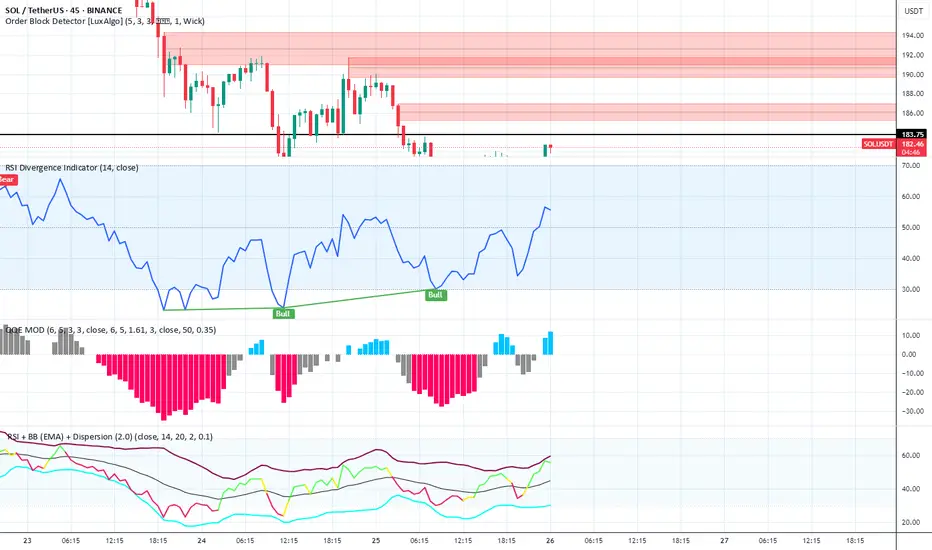
Vijay D - Smart Order Block + RSI Divergence Reversal SuiteIndicators Used in the Setup
Order Block Detector
Settings: (5, 3, 3), 1 Wick
Function: Highlights institutional order blocks to identify high-probability supply/demand zones.
Chart Insight: Multiple bearish order blocks marked in red between $186–$194, confirming strong overhead resistance. Price is reacting at the lower boundary (~$183.75), showing signs of rejection.
RSI Divergence Indicator (14)
Settings: 14-period RSI
Function: Detects bullish and bearish divergences between price and RSI.
Chart Insight: Bullish Divergence identified — price made a lower low while RSI made a higher low, signaling a potential trend reversal or bullish bounce.
QQE MOD
Settings: (6, 5, 3), Smoothing: 6.5, RSI Length: 14
Function: A momentum oscillator derived from RSI with smoothing and histogram representation.
Chart Insight:
Histogram flipped from red (bearish) to blue (bullish).
Bullish transition suggests increasing momentum in favor of bulls.
TSI – BB (EMA) + Dispersion
Function: Combines True Strength Index with Bollinger Band (EMA-based) and dispersion overlays.
Chart Insight:
TSI is rising toward midline with narrowing dispersion bands.
Indicates a potential volatility contraction before an expansion — likely upside if TSI crosses above signal.

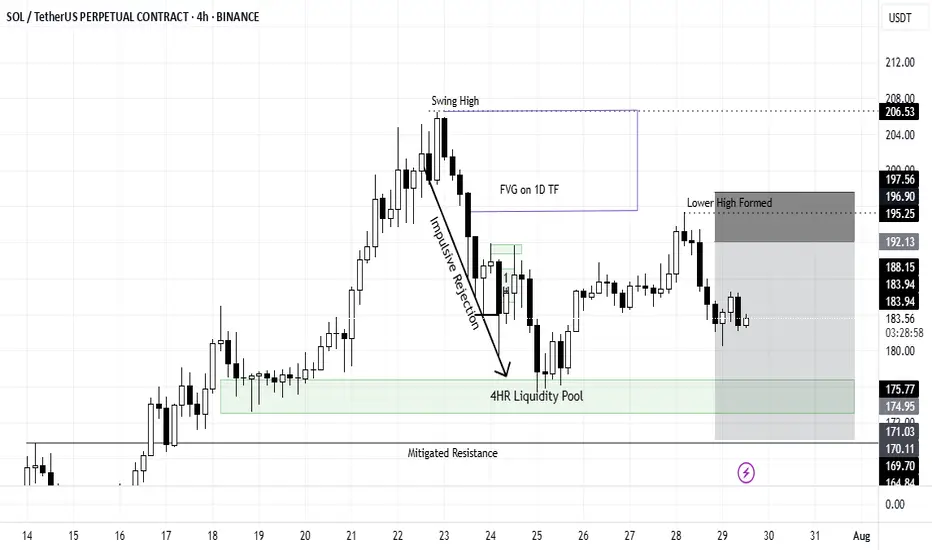
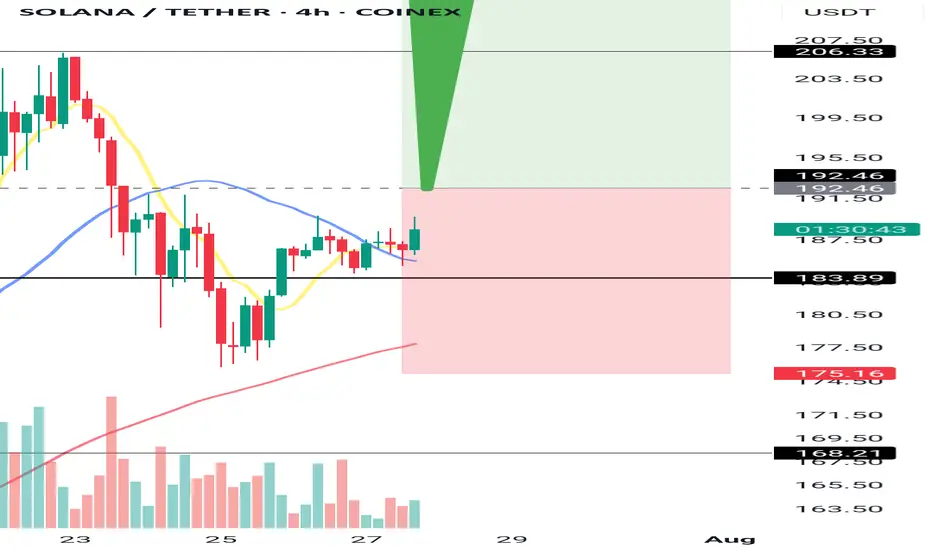
Mid Term SOL Short PlayOn the 4H timeframe, we can see SOL is currently facing resistance after breaking past $206.
It makes an impulsive move downward crating a Fair Value Gap visible on the Daily timeframe between 204.7 and 195.39.
It briefly touched the 4H Liquidity Pool before making an attempt to run up again.
However, the move got terminated at 195.25 forming a Lower High which is a signal of the downtrend.
Since it has not broken below 173.3 (Last swing low before breaking 206), it's still too early to call.
My mid term play would be to find entry between 191-193 and hold a short position to break below the FVG and bounce of the mitigated support.
Stop loss : 198
Target : 170
Weekly Altcoin Analysis – XRP, BNB, SOL, DOGE, ADA
🚀🔥 Don’t forget to FOLLOW & hit the ROCKET button for more weekly altcoin setups! 🔥🚀
♦️ Weekly Altcoin Analysis – XRP, BNB, SOL, DOGE, ADA ♦️
Starting this week, I will publish weekly analyses of the top coins on CoinMarketCap.
Since I analyze BTC and ETH daily, this review will begin from the third coin onward.
💎 XRP
🚀 Entry Trigger: Breakout above 3.25 – entering here makes the breakout of 3.33 easier.
⭕ Resistance: 3.33 may act as a strong barrier.
❗ Stop-Loss: 2.90
💎 BNB
✅ Entry Trigger: The entry level was 786.1, which has already been surpassed.
🔄 Plan: Wait for a pullback, formation of new highs and lows, and then breakout of the new high.
💎 SOL
🚀 Entry Trigger: 192.5 for long positions.
❗ Stop-Loss: 176.4 (around 8% lower).
💎 DOGE
❓ Entry: No clear trigger yet.
⭕ Suggestion: Possible entry at 0.25 with lower capital and strict risk management.
❗ Stop-Loss: 0.221004
💎 ADA
🚀 Entry Trigger: Breakout above 0.8405.
❗ Stop-Loss: 0.7591.
🔥 Key Notes:
1️⃣ All setups are based on the 4H timeframe.
2️⃣ A drop in BTC dominance below 60.83 and then 60.42 = confirmation for holding long positions and a new trend formation.
3️⃣ TOTAL, TOTAL2, TOTAL3, and USDT.D levels remain the main factors for confirming these setups (explained in my previous analysis).
4️⃣ ⭕ Caution: There’s a high chance of fake breakouts and stop-outs in these positions. Use risk and capital management.
👇 Make sure to read my complete market, BTC & ETH analysis in the link below. 👇
🚀🔥 FOLLOW & smash the ROCKET to keep these analyses coming! 🔥🚀
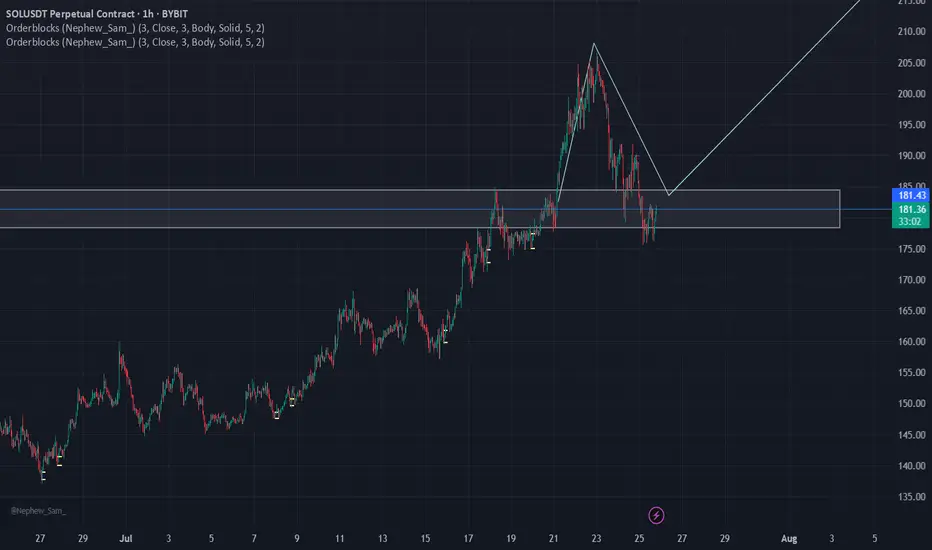
SOL 1H – Bounce From Demand, Can It Reclaim the Breakdown Zone?SOL tapped into the key demand zone near $157 and is now showing signs of a reaction bounce. Price is approaching the former support-turned-resistance zone around $184 — a critical level that marked the start of the previous breakdown.
A reclaim of that zone would suggest bulls are regaining control, opening up room toward the $190–$200 region. Until then, it remains a lower high attempt inside a bearish structure.
📌 Demand bounce
📌 Bearish market structure
📌 Key resistance at ~$184
No confirmed reversal yet — just a bounce until proven otherwise. Keep watching the structure evolve.

SOLUSD Good Buying Price - Target Weekly ZoneBINANCE:SOLUSDT pullback to weekly level, buying price is good and cheap
Note: Manage your risk yourself, its good trade, see how much your can risk yourself on this trade.
Don't be greedy.
Use proper risk management
Looks like good trade.
Lets monitor.
Use proper risk management.
Disclaimer: only idea, not advice

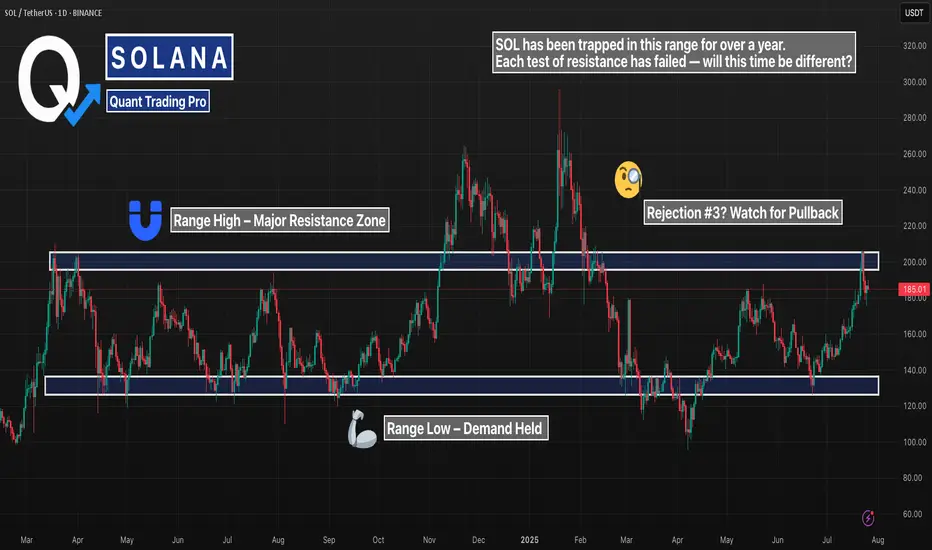
SOL 1D – Range High Rejected… Again?Solana just tapped major resistance — the same level that’s capped every rally since early 2024. This is now the third clean rejection off the $200 zone, and the structure couldn’t be more clear:
– Long-standing range between $115 and $200
– Previous rejections at the top led to full retracements
– This latest attempt? Rejected again — for now
If bulls want to flip the script, they’ll need a confirmed breakout with volume and a clean retest. Otherwise, this chart is screaming “range still intact.”
Until proven otherwise, this zone remains supply-heavy. Keep your risk tight — the next leg could move fast.
#Solana #SOL #RangeTrading #ResistanceZone #CryptoAnalysis #TechnicalBreakdown #QuantTradingPro #PriceAction
SOLANA UPDATEHello friends🙌
📉Given the decline we had, you can see that buyers came in and supported the price and were able to change the trend and create an ascending channel.
📈Now, considering that the price is hitting higher ceilings and floors, we can expect an ascending wave until the ceiling of the channel.
Don't forget risk and capital management.⚠
🔥Follow us for more signals🔥
*Trade safely with us*
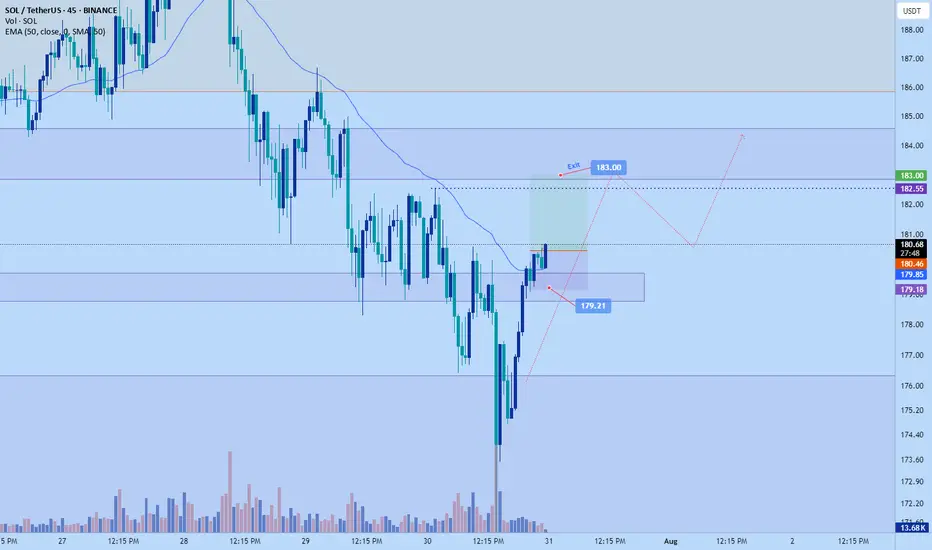
Solana scalp long to $183Just now opened a scalp long position on solana. Bulls are taking back control breaking resistance levels and no clear sign of exhaustion yet.
Sl: $179.21
Tp: $183
Roughly 2 RR
DTT strategy applied. - Direction , target and timing
Break down before the run upSo i feel this will go to the 4 hr OB. My reasoning is there's very little buy volume, the OBV is very low even though the price climbed a bit, and the RSI is below 50 still, so still bearish imo. But the market has its own ideas so be wary and watch closely. Make money my friends!

SOL SHORT : SHORT TERM REVERSALLooks like price reversal at the $200 resistance underway. Failed to close above .
Price retracing back to the lower channel support near 0.618 fib . Target next long positions with entries around $155

Solana Bullish Wave 5 coming?solana has completed the 3rd impulsive wave and now the recent decline was not impulsive but corrective meaning wave 4 has almost completed now we can look for wave 5 tp and sl are on the chart

this is familier patternis this a cup of tea pattern? i see a cup and handle this is a sign of bullish in next week
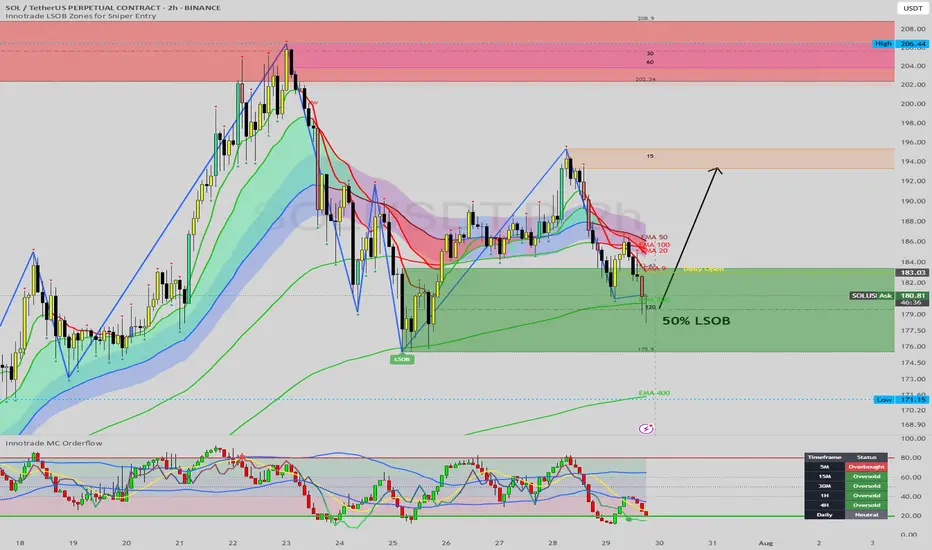
SOL Taps Major Demand: A High-Confluence Long Setup at EMA 200Hello, traders.
Today we are examining Solana (SOL), which has just pulled back into a technically significant area of interest after a strong rejection from the $206 highs. While the recent drop has been sharp, it has brought the price into a major demand zone that aligns perfectly with key long-term support levels.
This analysis provides a step-by-step breakdown of the confluent technical factors suggesting that the current level offers a high-probability opportunity for a bullish reversal and the continuation of the primary uptrend.
The Analysis: Stacking the Bullish Confluences
A robust trading idea is formed when multiple, independent technical signals align. On this 2-hour chart for SOL, we have a powerful convergence of factors:
1. Primary Market Structure (Uptrend Intact):
First and foremost, the context is bullish. The Zig-Zag indicator clearly shows a well-defined uptrend with a series of higher highs and higher lows. The current price action, while corrective, is still holding above the previous major low. As long as this structure holds, our bias should be to buy the dips in anticipation of the next leg up.
2. The Institutional Demand Zone (LSOB):
Price has now entered the large green LSOB (Liquidity Sweep Order Block), a critical zone spanning from roughly $175.5 to $183. These zones represent areas where significant buying interest and institutional order flow previously entered the market. The price has wicked directly into this demand zone, indicating a reaction from buyers.
3. Dynamic Support Confluence (The EMA 200):
Adding immense strength to this demand zone is the EMA 200, which is flowing directly through the middle of the LSOB. The EMA 200 is a widely respected long-term moving average that often acts as powerful, dynamic support in an uptrend. The fact that price has respected this level almost to the dollar is a strong confirmation of its significance.
4. Multi-Timeframe Momentum Exhaustion:
This is perhaps the most compelling timing signal. Our MC Orderflow oscillator is deep in the green "Oversold" territory, indicating that selling pressure on this timeframe is exhausted.
More importantly, the Dashboard reveals that this condition is widespread. The 15M, 30M, 1H, and 4H timeframes are all simultaneously flashing "Oversold." This cross-timeframe alignment of momentum exhaustion is a powerful signal that the corrective move is likely nearing its end.
5. Fibonacci Time Cycle:
A small but significant detail is the Fibonacci Time Cycle icon (the lightning bolt) that appeared near the recent low. These cycles can often mark key turning points in time, suggesting that the market is chronologically primed for a potential pivot.
The Potential Trade Plan
Based on this powerful stack of confluences, here is a potential trade plan:
Entry Zone: The current LSOB / EMA 200 area, from $179 to $181, represents a strong zone for entries.
Stop Loss: A logical stop loss can be placed just below the LSOB and the recent swing low, around $174.50. A break of this level would invalidate the bullish structure.
Potential Targets:
Target 1: A reclaim of the Daily Open at 186
Target 2: The intermediate supply zone and recent swing high around $194 - $196.
Target 3: A full retest of the major high at $206.
Conclusion
We have a textbook example of technical confluence: a pullback to a major LSOB demand zone that aligns perfectly with the long-term EMA 200, all while multi-timeframe momentum indicators show clear seller exhaustion at a potential time-based turning point. This presents a compelling, high-probability case for a long position on Solana.
Disclaimer:
This analysis is for educational purposes only and does not constitute financial or investment advice. Trading involves a high level of risk. Always conduct your own thorough research and consult with a licensed financial advisor before making any trading decisions.