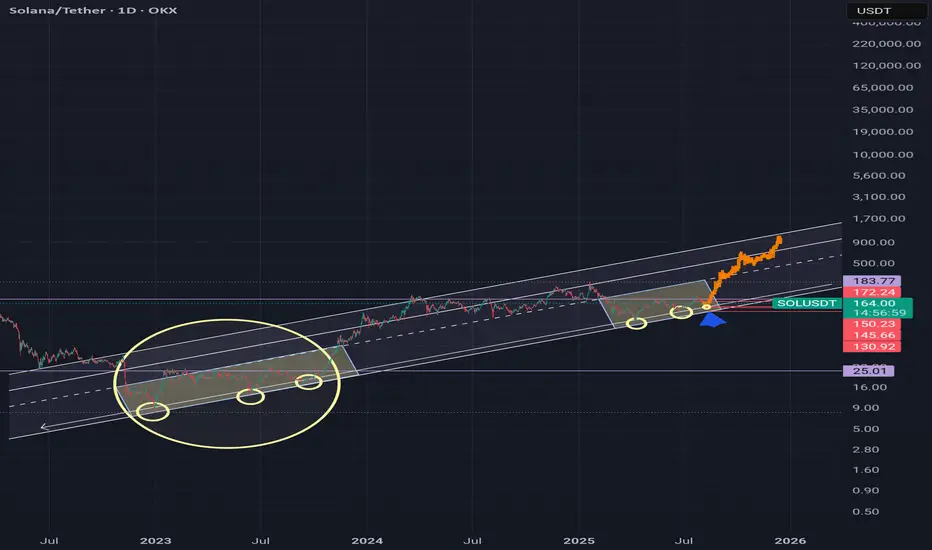
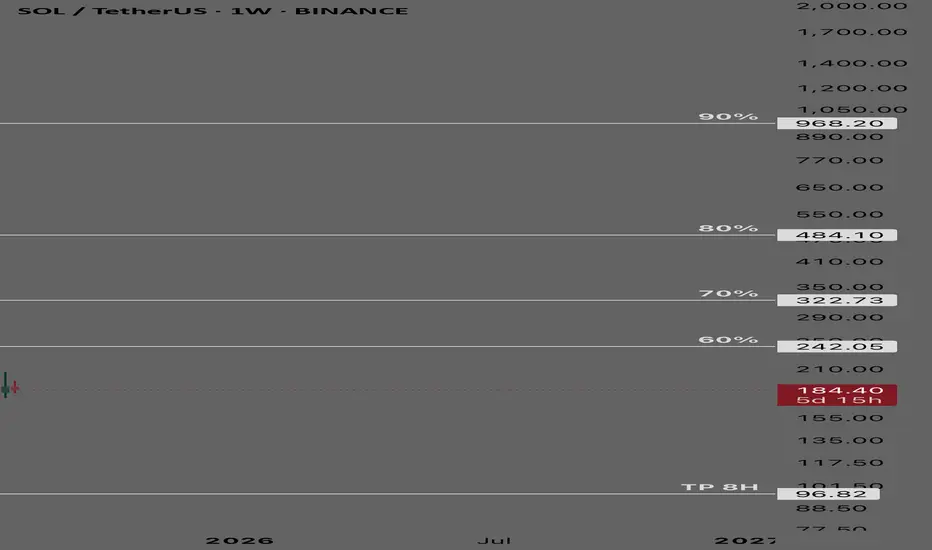
SOLUSDT - Long Term Sell Cycle SOLUSDT
long term sell cycle
TP at 96.82
% bubble ratio
Solana entered into a positive bubble with fair value at 96… cycle term is long
Spot Trading plan:
No entry ⛔️ in positive bubbles
SOLUSDT.P trade ideas
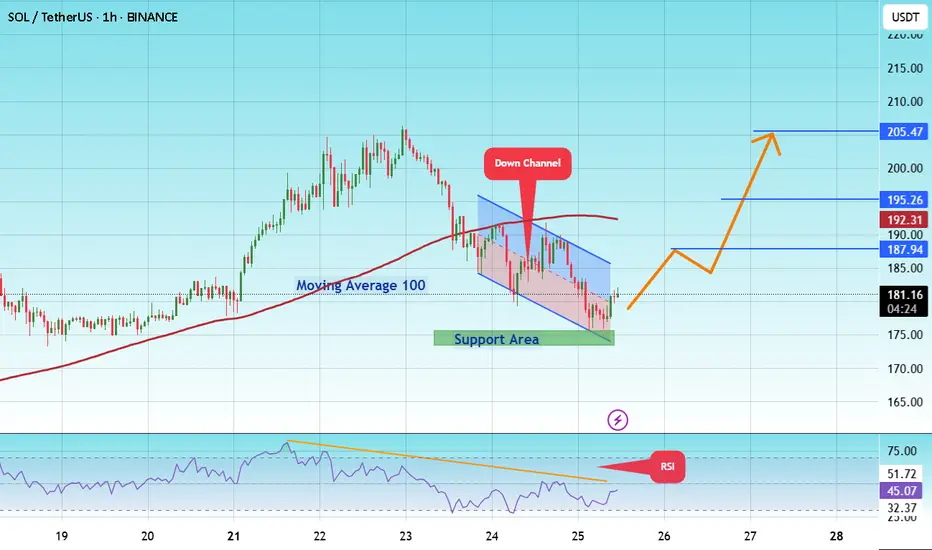
#SOL/USDT coin market structure analysis#SOL
The price is moving within a descending channel on the 1-hour frame and is expected to break and continue upward.
We have a trend to stabilize above the 100 moving average again.
We have a downtrend on the RSI indicator that supports the upward move with a breakout.
We have a support area at the lower boundary of the channel at 175, acting as strong support from which the price can rebound.
We have a major support area in green that pushed the price upward at 174.
Entry price: 181.
First target: 187.
Second target: 195.
Third target: 205.
To manage risk, don't forget stop loss and capital management.
When you reach the first target, save some profits and then change the stop order to an entry order.
For inquiries, please comment.
Thank you.
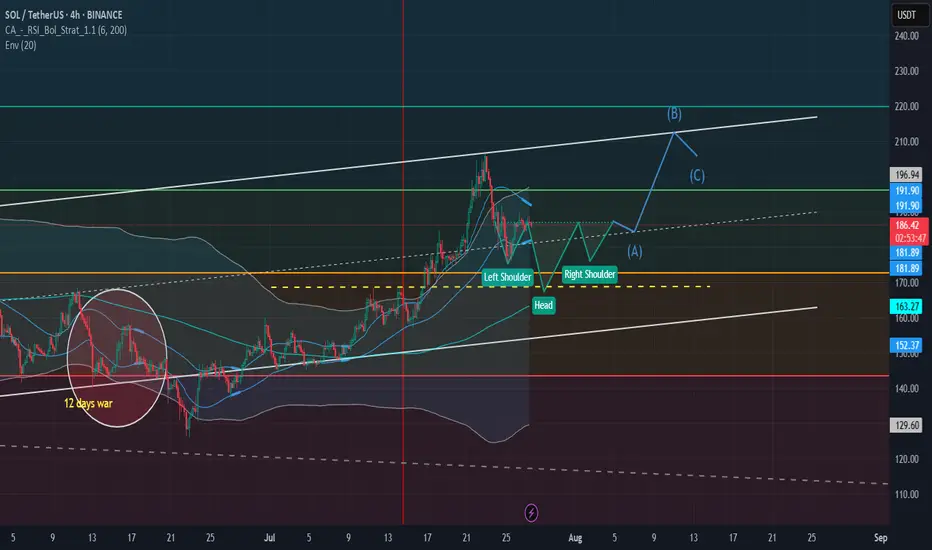
H&S Expected for Sol And Pyth until HHsPyth is following SOL and I expect a bit of a pullback for a better impusle to reach Higher Highs.
Technicals (RSI, Bollinger band) are showing overbought conditions and we can expect the usual End of months pullback. The pullback could reach the 168 - 170 Area before coming back to the current levels and after a potential light pullback to grab liquity and to create a new contraction before a new push toward 210 - 212 is expected.
This idea is only for educational content, please Do your own research before investing.
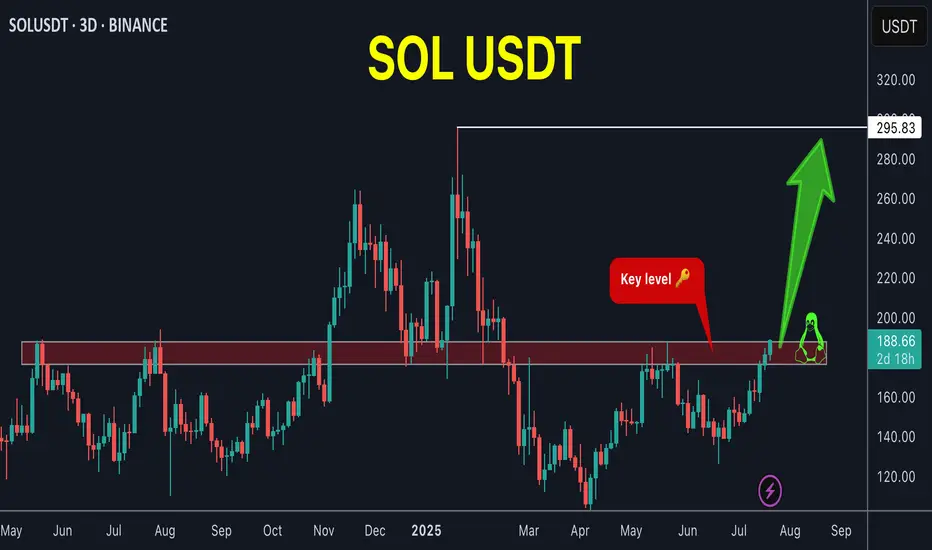
SOL is preparing for new ATHSOL / USDT
Solana didn't make a move since long time but i think its time will come very soon
Currently SOL is trying to breakout the most important key level in chart
Breaking out here => very high chance of making a new ATH
For those who interested in SOL …its the time
Solana maintains its upward structure ┆ HolderStatBINANCE:SOLUSDT is bouncing from the $170–172 zone, building higher lows just below resistance at $180. The structure is shaping into a rounded bottom with signs of accumulation. If SOL clears $180 with volume, targets lie at $188 and beyond. Trend remains bullish as long as price stays above the local demand zone.

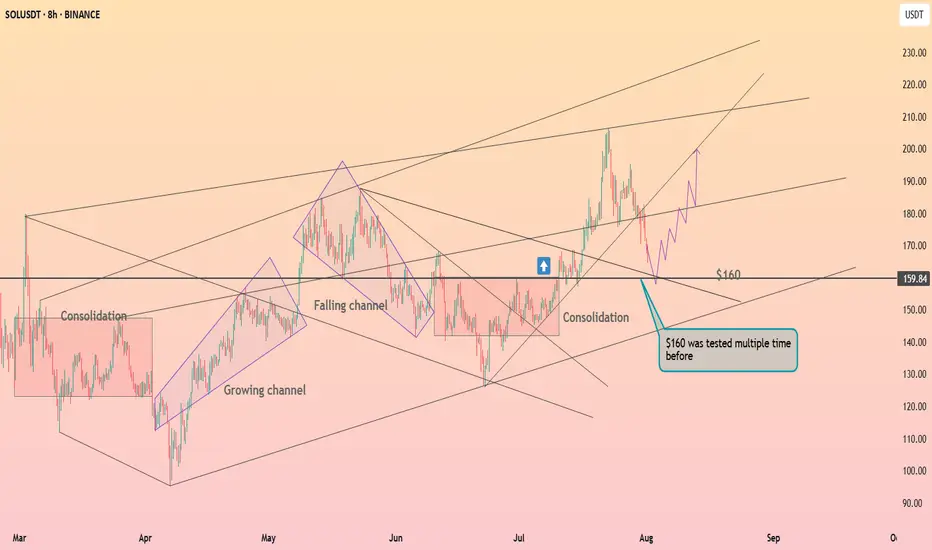
Solana above the $160 level ┆ HolderStatBINANCE:SOLUSDT is retracing toward the $160 support after failing to hold above $190. Price previously broke out from a falling channel and may find support at $160 again, where multiple reversals have occurred. A bounce here could fuel a move to $200.
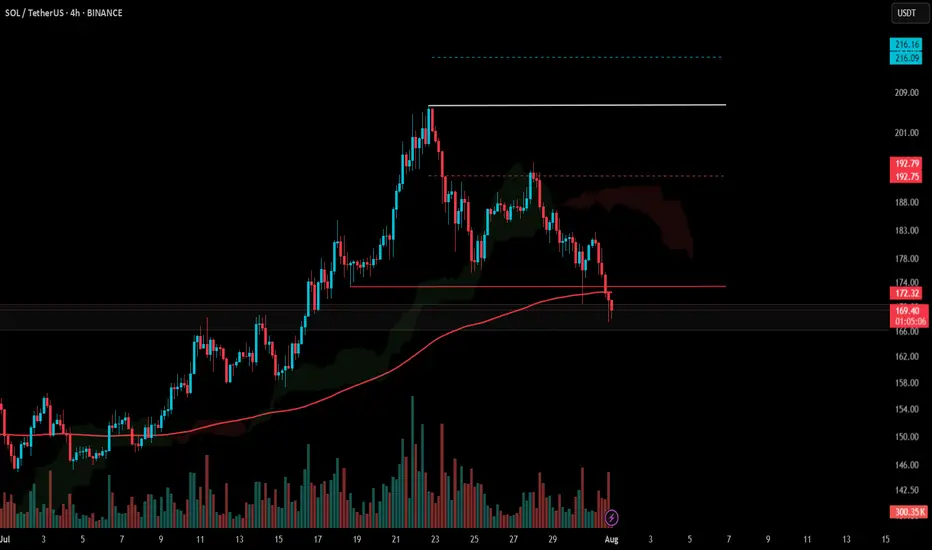
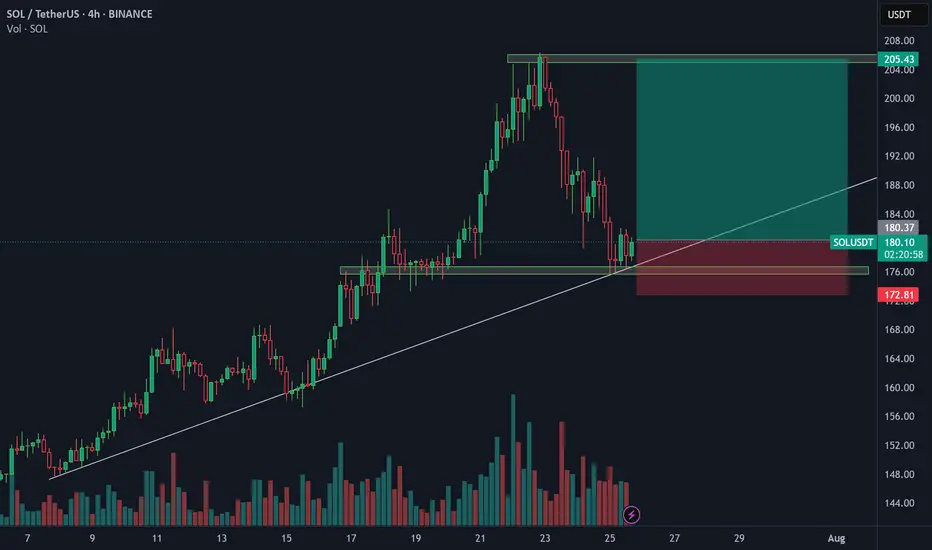
SOLUSD 4H — Holding the Line Before Altseason?Solana’s 4H chart presents a textbook continuation setup — a steady ascending trendline combined with well-defined resistance zones stacked overhead. This kind of compression within an uptrend often precedes explosive expansion, especially when aligned with broader altcoin market sentiment.
📊 Structural Breakdown:
Trendline Support:
Sol has maintained a rising trendline since early June, consistently bouncing off higher lows. This provides a dynamic support zone currently sitting around ~$175–180.
Horizontal Support:
The horizontal box at ~$175 represents prior structure highs turned into support — tested multiple times and aligning with the trendline. A breakdown here would be structurally significant.
Resistance Layers to Monitor:
$215 – Minor S/R flip and local liquidity cluster
$245 – Consolidation ceiling from Q1, where sellers previously took control
$270 – Clean weekly-level rejection from January
$300–310 – Final major resistance from the post-FTX crash range; breakout here signals full bullish expansion
Market Context:
The broader altcoin market is coiling, with majors like ETH and SOL holding structure while BTC ranges. If Bitcoin remains sideways or breaks slightly higher, capital rotation could drive a full “altseason” wave — with SOL as one of the first movers.
🔍 Key Conditions to Watch:
✅ Bullish Scenario:
Price holds ~$175 and breaks above $215 with strong volume
Clean retest of breakout zones confirms continuation
Targeting $245 → $270 → $300 in stages
❌ Bearish Invalidation:
Break and close below $175 trendline support
Would shift bias toward a wider range or even short-term downtrend
⚙️ Indicators to Watch:
4H RSI holding above midline (50) supports bullish continuation
MACD crossover + volume expansion = trigger confirmation
This chart is a reminder that you don’t need to chase green candles — spotting compression structures and planning for breakout zones is where the edge lies. Whether you’re positioning spot or looking for a leveraged entry, this structure rewards patience and timing.

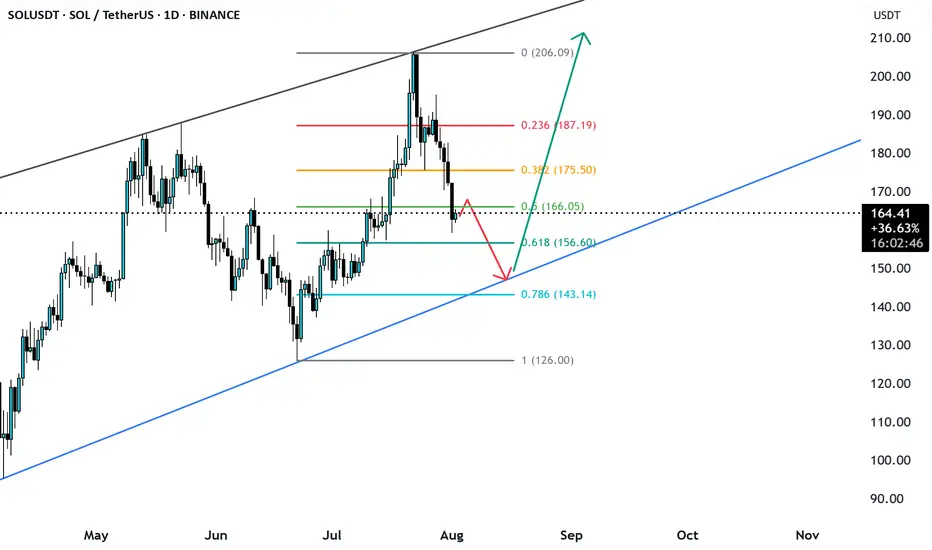
SOLUSD broke the 0.5 fib level is likely to go down SOLUSD yesterday broke the O.5 Fib level and price may further go down to trendline support from where price may get reverse.
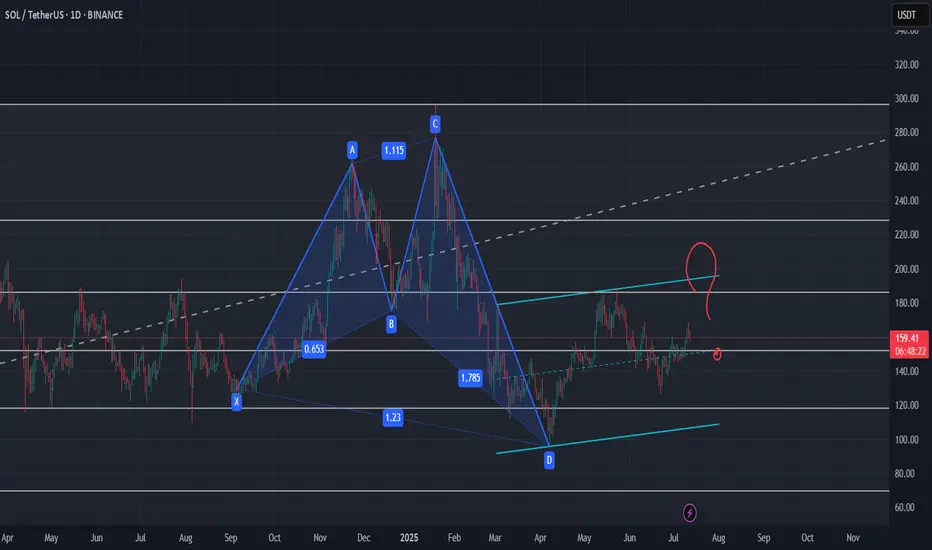
HARMONIC PATTERN on Daily for SOL ?I wonder if this pattern is the one which is highlighted by our friend and chart analyst @The_Alchemist_Trader_
Let's see if it need to test one last time the support of this channel or if it will break out for the long waited rally.
Level to keep an eye :
0.5 Fib support need to hold and clean breakout of the 0.382 Fib
Indicators : RSI, volume and volatility (liquidations)
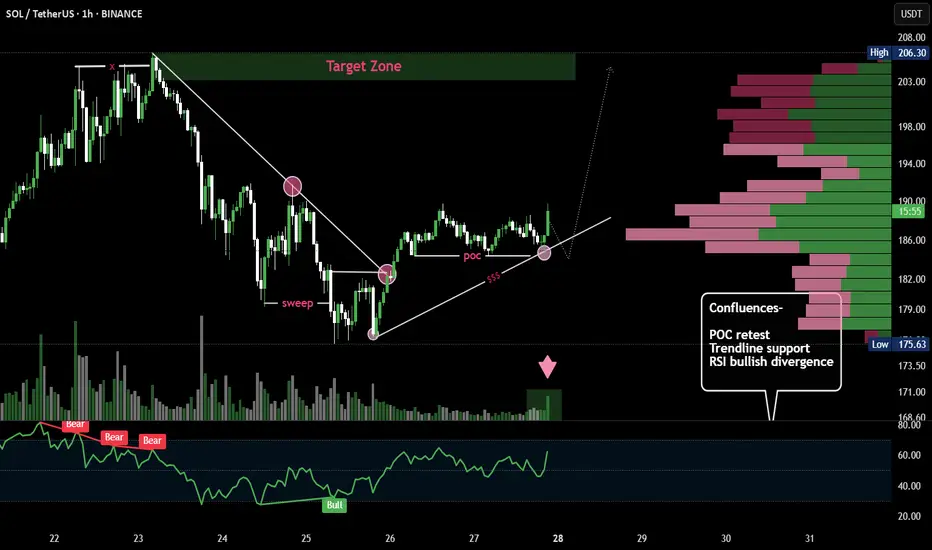
SOL/USDT 1H Chart – Technical Analysis BreakdownTrend Reversal Structure: Price broke out of a descending trendline after sweeping prior lows (liquidity grab), indicating a possible bullish reversal setup.
Point of Control (POC): Price is currently retesting the POC area (high-volume node), aligning with the trendline and prior support — a potential bounce zone.
RSI Divergence: Bullish RSI divergence marked near the sweep confirms the loss of bearish momentum, strengthening the case for upward continuation.
$SOL Loses Key Support | Eyes on $140 & $95 Zones📉 CRYPTOCAP:SOL Loses Key Support | Eyes on $140 & $95 Zones
🕵️♂️ On the daily timeframe, #Solana has officially lost its key support near $140, which previously acted as a strong bounce zone. A failure to reclaim this level could open the gates for a deeper drop toward the $95–$100 support range.
📊 Indicators signal downside:
RSI is trending downward
MACD shows a bearish crossover
Stochastic RSI confirms continued selling pressure
⚠️ Macro pressure adds fuel to the fire: August 1st tariff tensions, with expected news from Trump on charging Paris, are weighing down global risk assets. Historically, August tends to be a bearish month for crypto markets.
🎯 Key Levels to Watch:
Immediate Resistance: $140
Major Support: $95–$100
🧠 Trade wisely and manage risk accordingly.

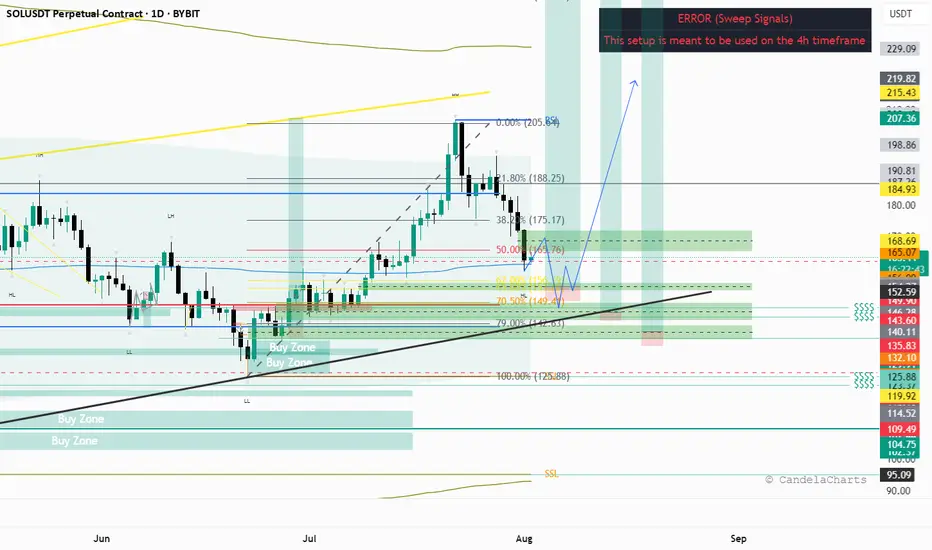
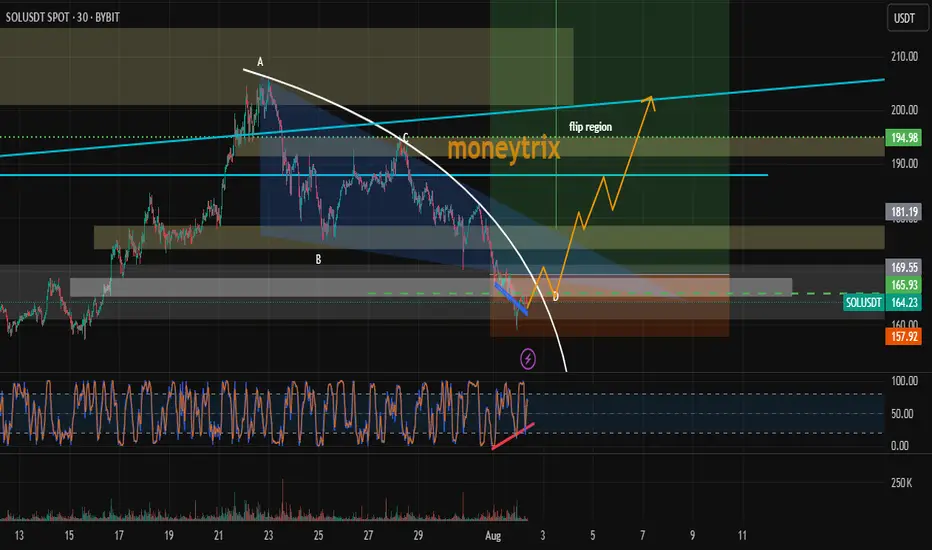
SOLANA could have a major retracement Solana completed a major ABC correction into a supply zone on the higher time frame (HTF), taking out the previous quarter’s highs.
On the daily chart, the RSI is overbought and signals the potential for a significant retracement.
Price action on the 4-hour chart shows a series of lower highs, indicating a bearish trend. If Solana fails to break above the previous high and trigger a market structure shift, the downtrend is likely to continue, leading to a deeper retracement on the higher time frames.


SOL / USDT - Current ThoughtsSolana’s been stealing the spotlight again and not just for the memes this time!
After months of getting smacked down at key levels, it’s finally reclaiming the lost ground with conviction. Price is grinding its way through zones that had been solid resistance for ages, flipping sentiment along the way.
The combination of structure, volume, and market psychology paints a clear story here. Let's break it down piece by piece in simple terms.
———x———x———x———
Table of Contents
⦿ Volume Profile
⦿ Key Technical Levels & Insights
⦿ Market Structure
———x———x———x———
⦿ Volume Profile
The Volume Profile offers crucial insight into where meaningful participation has taken place throughout this range and how these levels continue to influence the current structure.
Point of Control (POC) – ~145 USDT
This is the level where the highest volume changed hands during the entire consolidation. In simple terms, this is where buyers and sellers were most active in establishing positions.
The POC is like a price magnet where the market finds equilibrium when direction becomes uncertain. If bulls lose momentum, the price may gravitate back towards it.
Value Area Low – ~123.50 USDT
Below this threshold, prior market interest thinned out significantly. A breakdown here would likely accelerate downside as it signals acceptance below value, typically inviting stronger bearish flows and forcing trapped longs to capitulate.
Value Area High – ~213 USDT
This area marks a logical short-term upside target if the current rally can sustain its footing. VAH is where the prior range began to thin out and sellers historically pushed back. If buyers want to reclaim control, this is a key level to watch.
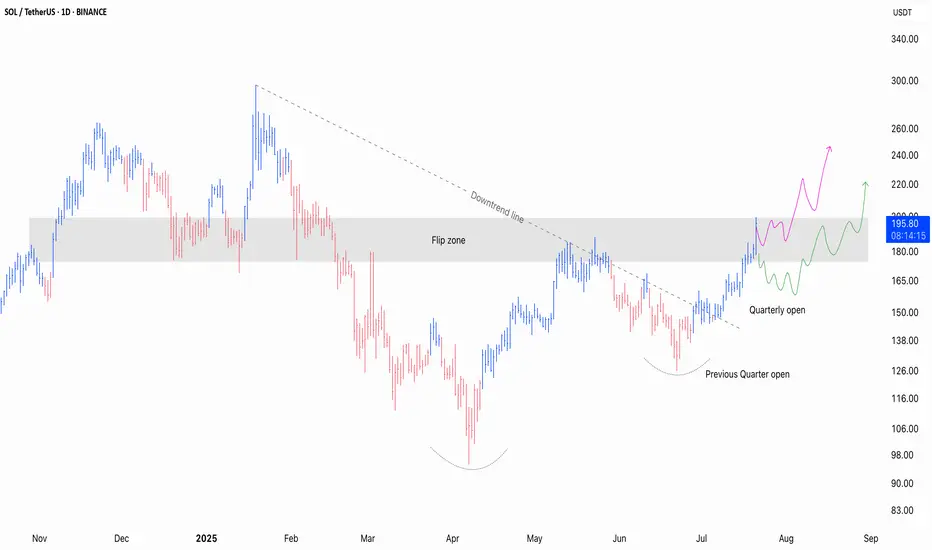
Currently, the price has cleanly reclaimed the POC and is now pressing into what I’d define as the Flip Zone (an area where former resistance is getting retested as potential support). Acceptance above the VAH will lead a rally towards the ATH.
⦿ Key Technical Levels & Insights
Several key factors are aligning here to create a compelling case and it’s about the broader narrative these levels are constructing together.
Quarterly Open – ~150 USDT
The recent breakout and push above the QO shows a clear intent buyers' intent. It’s a important reference point for ongoing structure.
Yearly Open – ~188 USDT
Reclaiming the Yearly Open is rarely a trivial event. Currently, the price is flirting with the YO. If the price manages to reclaim it with a strong push, it'll shift the broader sentiment back in favour of the bulls.
Flip Zone – 175–190 USDT
This zone has historically been a battleground, serving as both support and resistance since March 2024. A clean breakout above this zone won't just clear resistance, it'll open the door for further upside as sidelined participants as well as trapped shorts will be forced to react.
Downtrend Line – Broken
The trend line that was established earlier this year has been breached now, adding another positive factor for the bulls.
200 EMA / 200 SMA – ~163 USDT
Both KMAs are converging here, adding weight to this level as a reference for long-term trend direction. Price reclaiming and holding above these MAs often signals a meaningful shift in market sentiment.
The confluence of reclaiming major opens, breaking downtrend resistance, and positioning above critical moving averages strengthens the bullish case.
⦿ Market Structure
The current structure shows a market transitioning from bearish exhaustion, through a phase of accumulation, and now stepping confidently into breakout territory.
Double Bottom Formation (April lows ~95 USDT to recent highs):
This is a textbook accumulation. It’s not a fast V-shape reversal but a slow build. These kinds of structures often lay the groundwork for sustained trends.
Higher Lows in Place: 95 → 126 → 150 → 190 USDT
Each successive low is higher than the last, showing consistent buyer strength and deliberate positioning by participants with a longer-term view.
Breakout Above Prior Range Highs (187–190 USDT):
This area acted as clear resistance in previous attempts, capping price for months. Once this range is reclaimed with force, expect higher prices for multiple weeks/months.
TLDR
✅ Current Bias: Bullish while above 175–190 USDT.
✅ Structure: Breakout of multi-month downtrend, reclaiming key levels.
✅ Volume: Strong above POC, targeting Value Area High next.
✅ Invalidation: Failure below 150 USDT flips bias back to bearish.
I’m only focused on bullish continuation or healthy pullback scenarios for now, as I plan to keep holding my existing spot positions.
If you found this breakdown helpful, drop a like and let me know your thoughts in the comments. Always keen to hear how others are seeing the market. 👇
⚠️ Disclaimer
As always, this post is purely for educational purposes. I am not a financial advisor, and nothing here should be taken as financial advice. Always consult your financial advisor before making any investment or trading decisions. Or at the very least, consult your cat. 🐱
SOL Sol next move idea.
Sol's final leg down before the final leg up for this bullrun. Fill the daily imbalances come to 70 % fib retracement level also a volume POC on a discount area below 50% of the dealing range and the daily trendline.
#SOL Update #6 – Aug 01, 2025#SOL Update #6 – Aug 01, 2025
Unfortunately, Solana failed to hold the last low where its most recent impulsive move had started, and it closed below that level. This close also occurred below the MA200 band. In other words, Solana broke a very strong support on the 4-hour chart and moved downward, reaching the previous K-Level zone. It’s hard to say anything positive for Solana at this stage. If the current K-Level fails to hold, Solana may look for support around the $158 level. A long position on Solana is definitely not recommended. I also do not suggest a short position. However, unless there’s a strong reversal, it’s safe to say that Solana has entered a bearish phase on the 4-hour chart.
Solana (SOL): Good Buying Opportunity Incoming | June 2025Solana is gathering buyside volume, and we are back near daily timeframes of the 200 EMA, which might be our breakout for an upcoming long position.
More in-depth info is in the video—enjoy!
Swallow Academy


#SOL Update #7 – Aug 02, 2025#SOL Update #7 – Aug 02, 2025
Solana has broken below the low of its last impulsive move, forming a new, deeper bottom. The first area where it may find support is the $158 level. If this fails, the next support level lies at $147. At the moment, Solana is clearly in a downtrend on the 4-hour chart. For Solana to resume its upward movement and confirm a trend reversal, it needs to break above the $206 level with a strong, high-volume candle. Currently, Solana might be considered a cheap opportunity only for those looking to hold spot positions long-term. Otherwise, I don't see it as a suitable option for trading.

SOL LONGSolana is bouncing off the support level and the ascending trendline. Bullish movement is expected to continue and reach $205
due to rsi divergence and fib zone long sol nowdue to rsi divergence and fib zone long sol now
fib golden zone triggered
demand zone triggred
rsi divergence and many other +ve sentiments
so we longged
its infinit market idea may be wrong so use sl 155$
#dyor too, im not financial advisor
Longterm Uptrend still in a Process!Look at 3 contact below.
Currently price avout to put 3rd touch to lower zone of trend and it marks to $148-$151.
After that upside move will start to gain momentum in my opinion.
Macro view is still bullish roughly above $150.