Solana is bouncing back from $175 ┆ HolderStatOKX:SOLUSDT is testing the $180 barrier. Breakout could extend gains to $186. If rejected, $172–$173 may act as reentry zone. Market structure favors continuation.
SOLUSDT.P trade ideas
SO LONG : Next Target $220 ZoneSOL price successfully broke above the 200 resistance zone.
Trend bias is upwards currently with the next projected resistance around 225 USD
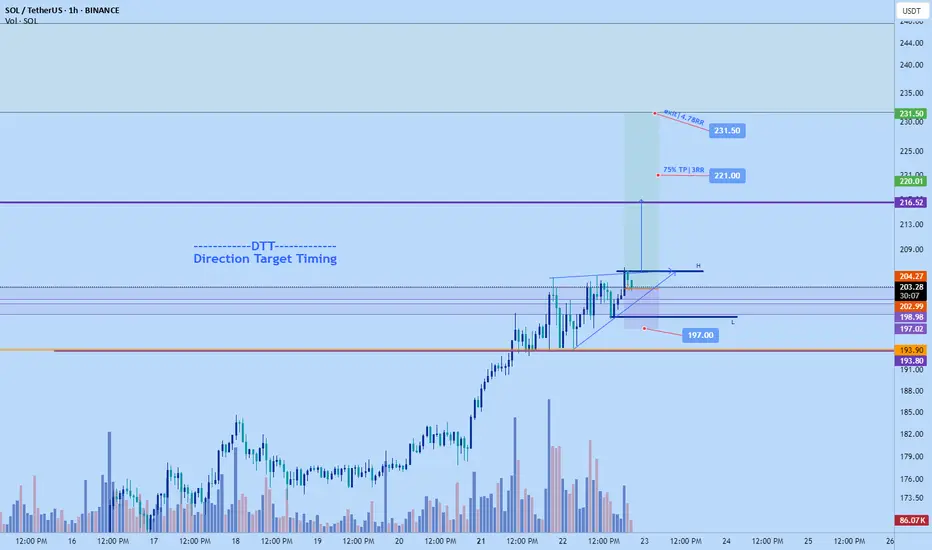
Swapped ETH for Sol long to $231.5Just abandoned the eth ship after holding it for a few days. Its price action is looking up but exited close to BE.
Solana on the other hand price action has been more positive and actually cleaner with less resistance ahead on higher timeframe compared to ethereum. In fact if all goes according to plan am expecting solana to start pushing for the $220 area tonight.
Stop is placed below 4hr HL structure at $197. Playing it conservative.
Market has free space to move into until $216.5 area thats why I have an alert there to monitor given all goes well as price could start reacting there.
I didn't go for a very precise entry. Rather I prioritize the fact that the market is at a daily prior resistance area which can provide quite a bit of support and my stop is below that area..so market has to break 4hr structure HL plus daily support to get to stop- decent protection and still can get a potential 3-5 RR which is great.
Time sensitive
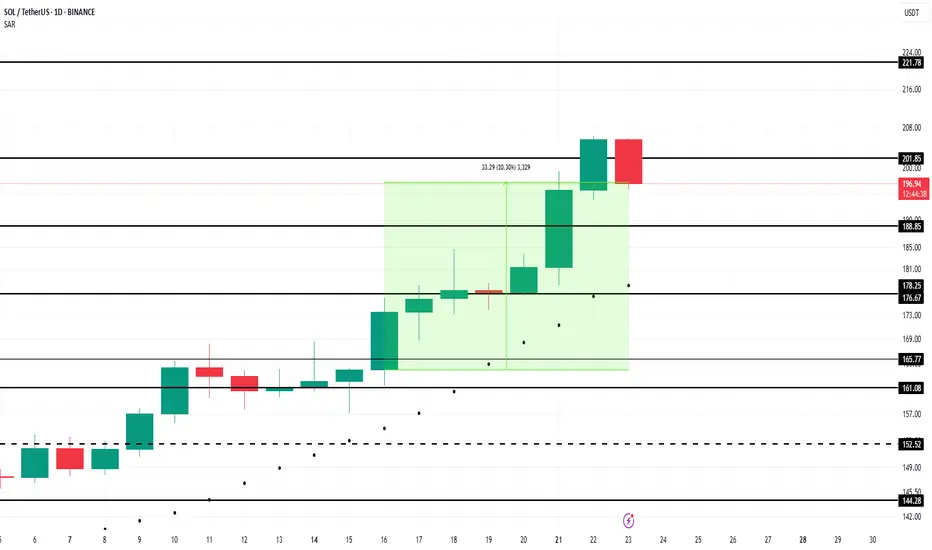
Solana Price Faces Reversal At $200 As Profits Hit 5-Month HighBINANCE:SOLUSDT price has risen 21% in the past week , now trading at $199. Despite breaching the $200 mark, Solana has failed to maintain this level, marking a five-month high.
The Net Unrealized Profit/Loss (NUPL) indicator for BINANCE:SOLUSDT shows that profits have reached a five-month high . This signals that many investors are in profit, raising concerns about a potential sell-off.
If these factors hold true, BINANCE:SOLUSDT price could decline toward the support levels of $188 or even drop to $176 . A move below these levels could erase a significant portion of the recent gains and shift the altcoin into a bearish trend.
However, if investor confidence remains strong and the market continues to show bullish signs, BINANCE:SOLUSDT could stabilize above $200 . Securing this level as support could propel the price back toward $221, invalidating the bearish outlook.
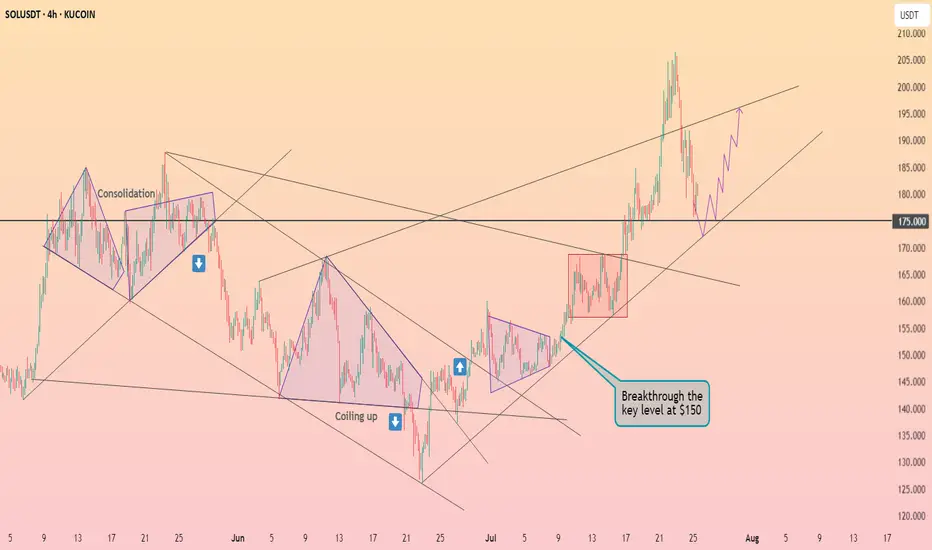
SOLANA $250 INCOMING? or $150 again?We can see a wedge is forming, price is at a major point, break above with a failed break below the resistance - we see high potential for $250.
Failed breakthroughs and a rejection? We see $150 once more.
Thoughts?

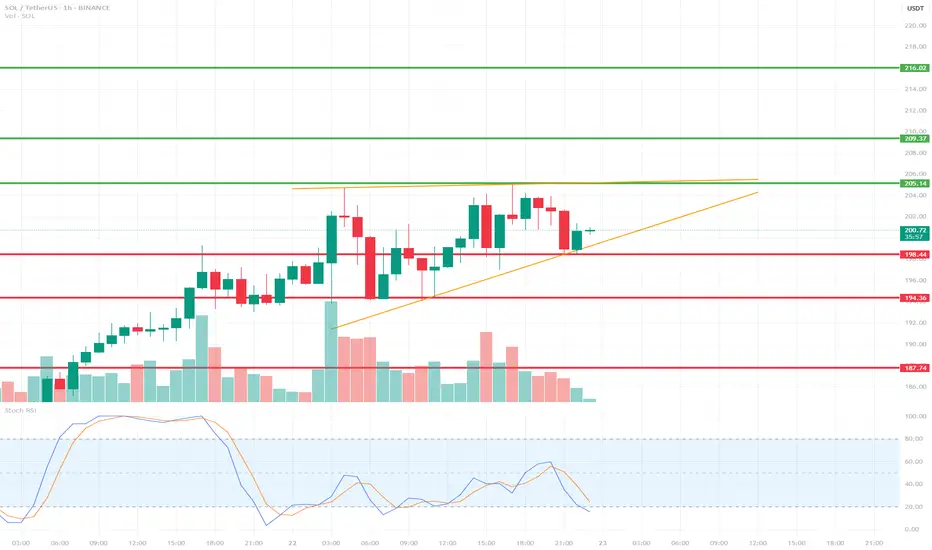
SOLUSDT 1H Short-Term🔍 Technical Structure:
Short-Term Trend:
SOL is currently in an uptrend, with local higher lows. This is evident from the orange uptrend line, which has been tested multiple times.
Local Resistance:
205.14 USDT – yellow line – a resistance level that the price has touched several times but failed to break (this could be a double-top formation).
Local Support:
198.48 USDT – the price is currently testing this level as support.
194.36 USDT – lower, more crucial support (stronger upon a trend breakout).
187.74 USDT – important support that would be tested in the event of a larger breakout.
📉 Oscillator – Stoch RSI:
The Stoch RSI is currently in oversold territory (below 20), suggesting the possibility of a local rebound.
However, there has been no upward crossover yet, so there is no strong buy signal.
🔊 Volume:
We are observing a decrease in volume during the current correction, suggesting that the declines are relatively weak – there is no strong supply impulse.
🧠 Short-term scenarios:
✅ Bullish scenario:
Price is rebounding from the trend line (orange) and the 198.48 USDT level.
A break of the 205.14 USDT resistance could open the way to:
209.37 USDT
216.02 USDT (next target)
❌ Bearish scenario:
A break of the trend line and the 198.48 USDT level with the 1-hour candle closing below.
Possible decline to:
194.36 USDT (first support)
and further to 187.74 USDT if selling pressure increases.
SOLUSDT at least is targeting 300$ this time We are looking for more pump for BINANCE:SOLUSDT on this market and at least after breaking and hitting first targets which are 200$ and 250$ then it is time for new ATH above the 300$.
Major supports and resistances are all mentioned on the chart too.
DISCLAIMER: ((trade based on your own decision))
<<press like👍 if you enjoy💚

Bullish SOL Setup: $350, $480, $600 Main Price TargetsHello✌
Let’s analyze Solana’s upcoming price potential 📈.
BINANCE:SOLUSDT , I expect a long-term upward bullish trend.
There are three main targets in this analysis: $350, $480, and a final target of $600, which could be reached within 2 to 6 years.
The price may form parallel channels at times, which are shown on the chart. I also expect the current bullish channel to remain valid and continue upward.
✨We put love into every post!
Your support inspires us 💛 Drop a comment we’d love to hear from you! Thanks , Mad Whale🐋
🐋Many of the points and levels shown on the chart are based on personal experience, feeling, and over 7 years of research and daily study of crypto charts.
Some of the lines, channels, and price zones are drawn to make the chart easier to understand and to help imagine possible future price movements.
I’ve also included one very big drop in price even bigger than the others because in the crypto market, it’s common for prices to suddenly fall hard and push out small investors and traders with positions.
The targets on the chart are not guaranteed; they might be reached, or they might not.📚
📜Please make sure to do your own research before investing, and review the disclaimer provided at the end of each post.

Analysis Of SOLUSDT
Why buy? market still on the bullish side this analysis is based by technical of SMC (OB,FGV) and Fibonaci
Stay Safu

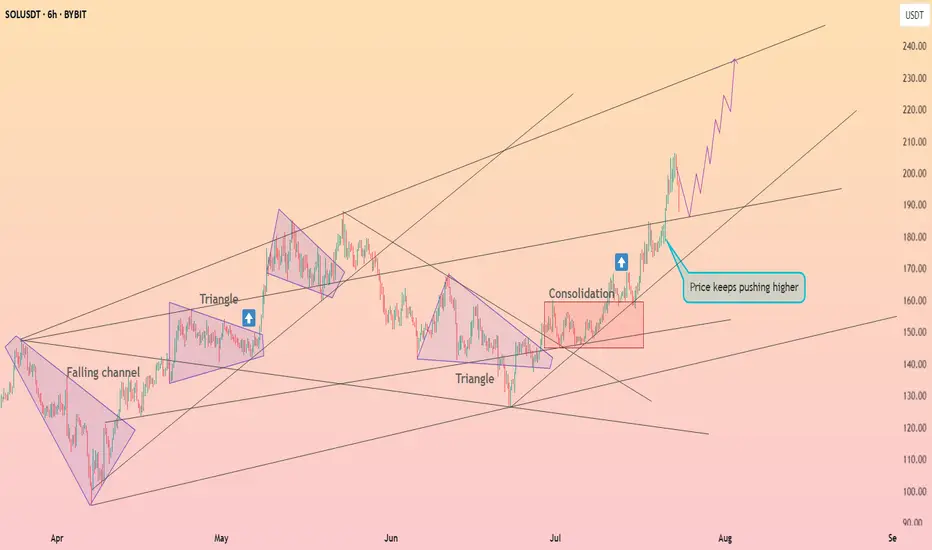
SOL Uptrend Update➡️ Solana has been correcting for the last couple of days, but the trend is clearly up.
➡️ There are 2 confluence factors that should give price support: the gray ascending trendline and the green zone.
➡️ Initial Targets (purple lines) are:
218.45 (100% extension)
258.79 (beginning of blue potential supply zone)

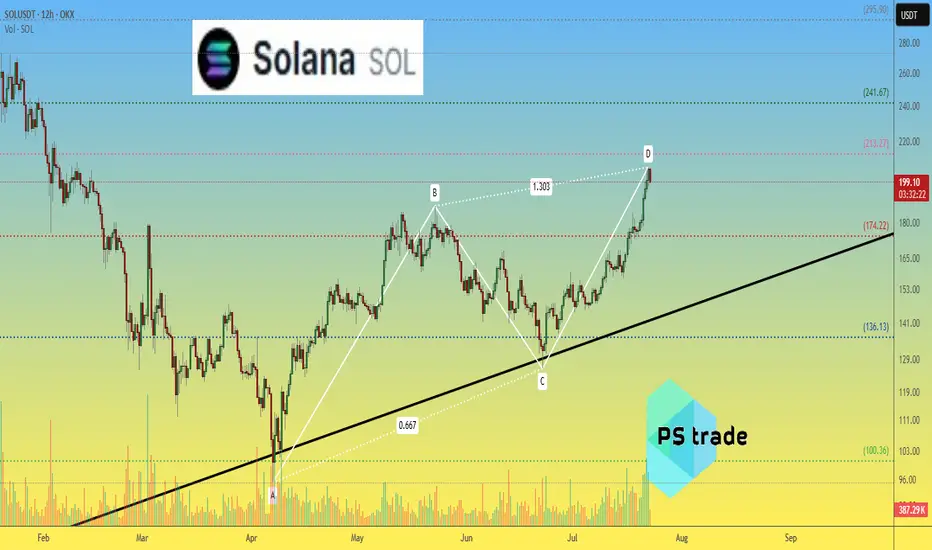
Solana SOLusdt: ABCD Completion & Reversal Candle Forming?The ABCD pattern on the 12H OKX:SOLUSDT chart is nearly complete near $213.
🔻 Current candle attempts to engulf the previous bearish one — an early reversal signal.
📊 Volume is declining after impulse — adding confluence.
📉 Correction targets:
$175 — Fibo 0.5 + support
$136 — consolidation area
$100 — start of CD move
❌ Breakout above $213 invalidates reversal scenario.
_____________________
Did you like our analysis? Leave a comment, like, and follow to get more
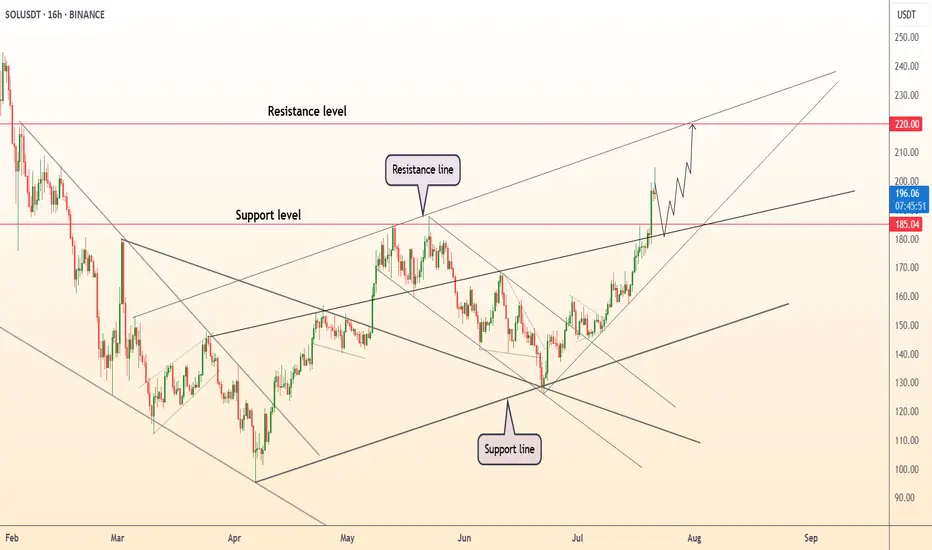
DeGRAM | SOLUSD seeks to the $220 level📊 Technical Analysis
● After reclaiming the mid-June swing cap 185 (now support) price accelerated along a steep parabolic fan; the move completed a 1:1 extension of the early-July flag yet leaves room to the channel crest near 220.
● Structure shows successive closes above the March–July internal resistance line; momentum pull-backs are respecting the fan base at 190, indicating healthy trend continuation toward the next fib / rail confluence at 219-222.
💡 Fundamental Analysis
● FXStreet notes Solana’s daily active addresses just hit a 12-month high, while CoinShares reports a fourth straight week of SOL-focused ETP inflows—evidence of strengthening network use and institutional demand.
✨ Summary
Buy 190-195; hold above 185 eyes 205 ▶ 220. Long thesis void on a 16 h close below 175.
-------------------
Share your opinion in the comments and support the idea with a like. Thanks for your support!
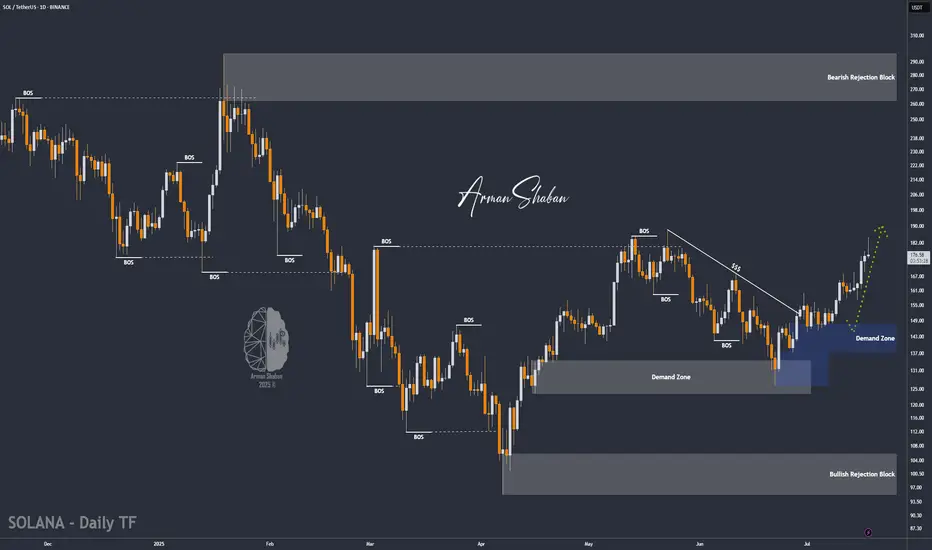
SOL/USDT | Next Bullish Leg Ahead if Key Support (READ)By analyzing the Solana chart on the daily timeframe, we can see that today the price climbed to $184, almost hitting the next target at $187, before facing a correction. It is currently trading around $176. If Solana manages to hold above the key support zone between $168 and $174, we can expect the next bullish leg to start, potentially extending up to $227. The previous analysis remains valid, with the next upside targets at $187, $220, and $263.
Please support me with your likes and comments to motivate me to share more analysis with you and share your opinion about the possible trend of this chart with me !
Best Regards , Arman Shaban
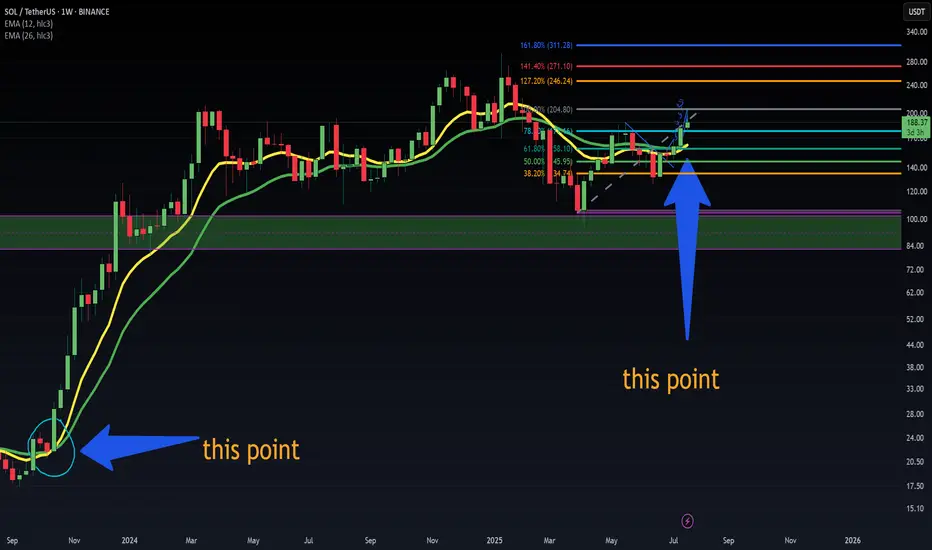
Solana About To Gain Bullish Momentum Towards $420, Later $1000+It seems like Solana has been taking forever to grow, to recover; it seems like a long time. Let's do some maths. The bottom was in 7-April and we are now on July 21. 98 days. A little over three months. That is how long it has taken Solana to move back above $200. Seeing that the all-time high is $295, this isn't a long time, we are getting close to resistance and this resistance will break easily just as it happened with Bitcoin. Solana is set to grow to $420 mid-term and this bull market is likely to give us a target of $620 and potentially $1,000. $1,000 is the bright spot we want to hit on the bull run phase.
Why aim so high? Because the correction was really small in comparison to Solana's major bullish cycle since 2022. Solana crashed and crashed really hard but this hard-crash led to the strongest bullish cycle ever. Only in January 2025 did Solana stop too breathe and it did so by doing a 60% drop-market flush. With this drop over, Solana can produce the continuation of its long-term, eternal bullish cycle. Higher and higher, week after week, month after month.
If you are a Solana holder I just want to tell you to be patient on this pair. All the gains that have not been done in the past will be fulfilled in a matter of days. Solana will catch up with the rest of the giants and grow strong. Once Solana is up there at a new all-time high, the rest of the market will continue to grow.
Think of Solana behaving just like Bitcoin; when it reaches high up, instead of crashing we can experience some consolidation followed by additional growth. When we are close to the true cycle top, money will flow out of these big projects into the smaller ones, creating a major bull run.
All is good and perfect and it is early still today. Think about it, would it be late to buy below $200 when you know the potential is 1K?
Thanks a lot for your continued support.
Namaste.

Solana is preparing to breakthrough $200 ┆ HolderStatOKX:SOLUSDT is trapped between $172 and $180. Break above $180 may unlock $188+. Watch for volume breakout.
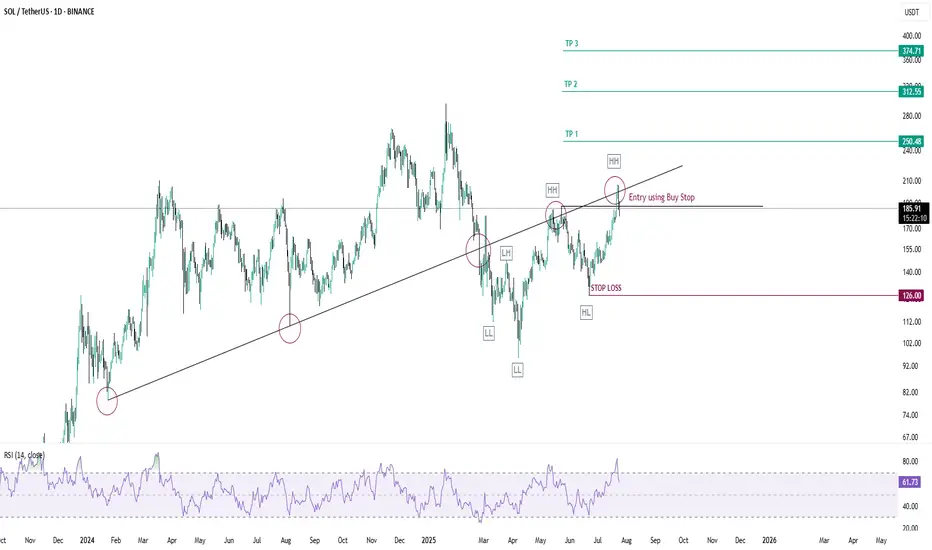
SOLUSDT-LONG IDEASOLUSDT has broken its trendline toward downside and now the structure is broken forming a higher highs and higher lows and reason behind its rejection is trendline but the structure is clearly bullish, trendline has gotten tapped two time now it has become weak take your entries using buy stop order it will give you great return again its a positional trade so if you have patience only then take this trade it will not gonna boom overnight stop loss entry and take profit points are mentioned in the chart.
Solana is undervalued | New ATH coming very soon | $250++Solana is slowly but surely grinding up, following the altcoin king ETH. ETH is already near its 2024 highs of $4000. If SOL were to be in the same position as ETH in terms of price, we should be around $250.
In technical terms, SOL is showing huge bullish strength at the $180 resistance. In the last attempt in breaking above this level, it faced multiple rejections and consolidated before ultimately backing down. This time, there is little to no resistance.
The REX-Osprey SOL staking ETF continues to garner inflows, having only one outflow day since the launch date 2nd July. That's nearly $100 million net inflows and 11 inflow days out of 12 trading days. Imagine the demand the spot SOL ETF by big players such as VanEck, Grayscale and Fidelity will have once approved.
BTC dominance is breaking below 60%. Capital is flowing from BTC into ETH, and once ETH hits $4000, a good amount will flow from ETH to SOL as people look for better potential gains.

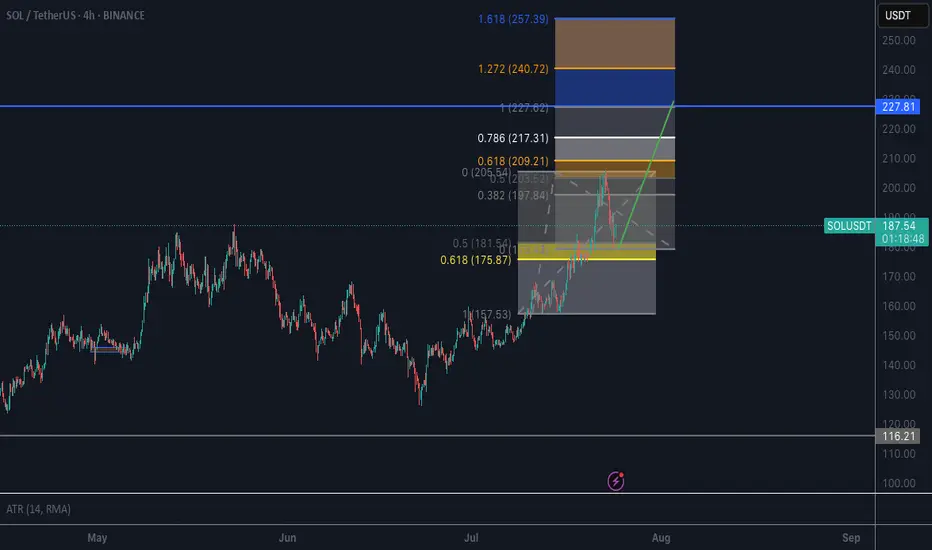
Weekly trading plan for Solana Price Action Summary
SOL perfectly followed our bullish scenario, achieving all projected targets.
Price has now entered our predefined zone.
Avoid shorting in discovery mode—momentum remains unpredictable.
Key Technical Observations
Caution Signals:
Overbought RSI on higher timeframes
Bearish divergence on the hourly chart
Elevated volume + weak upward momentum → Potential institutional distribution
Critical Levels to Watch
1 Local Trendline (5-min chart):
Break below → Likely correction toward weekly pivot
Hold → Extended discovery possible
2 Weekly Pivot:
Primary downside target if trendline fails

Another head and sholder!I CRYPTOCAP:SOL see another head and shoulder its time to reverse?!!
Look at this

Solana Bearish?Sol looking juicy to short from here, it already made 1 hourly big down candles and bearish market structure

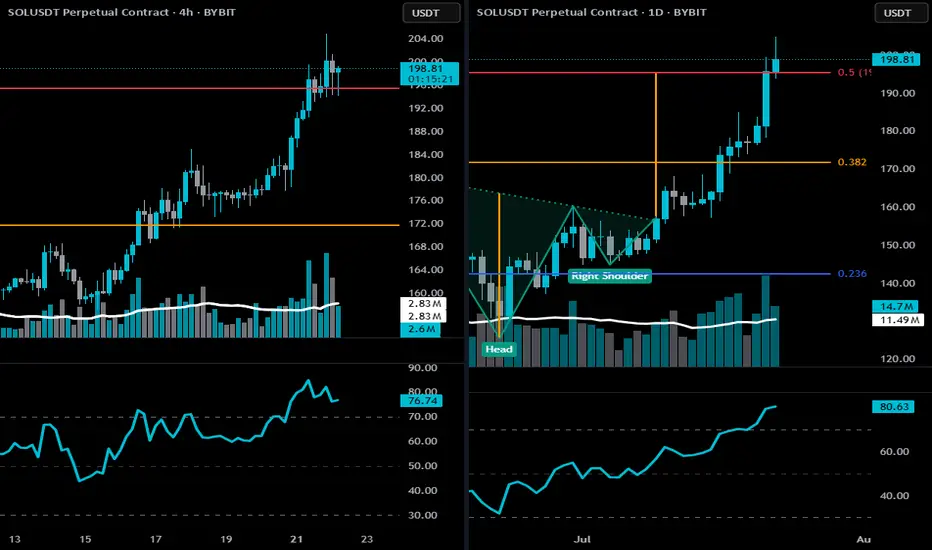
SOL CRUSHING-bearish risks developing🔻 4-Hour Bearish Thesis
🔸 Price Action Clues
SOL is currently stalling at the 0.5 Fibonacci retracement (~$198.18) of the full macro move — a classic profit-taking zone.
Multiple upper wicks and indecisive candles at resistance indicate supply absorption and buyer exhaustion.
After a steep rally, price is moving sideways in a rising wedge/flag, which is a bearish continuation pattern if broken downward.
🔸 Momentum + RSI
RSI at 76 is extended and flattening — often a zone where short-term pullbacks begin.
No confirmed bearish divergence yet, but momentum is weakening compared to earlier stages of the rally.
🔸 Volume Profile
Volume on recent pushes is lower than during breakout, suggesting diminishing bullish conviction.
Bearish if a breakdown below $194 occurs — that's the former breakout level and wedge support.
🧨 4H Breakdown Confirmation
Break below $194 (key short-term support) → opens downside targets:
🔻 $186–$182 (prior breakout base)
🔻 $171 (0.382 Fib retracement zone)
🔻 Daily Bearish Thesis
🔸 Price Action + Key Zone
Price is pressing against the neckline target ($198.18) of the inverse H&S pattern.
Stalling under the red resistance line and 0.5 Fib.
Recent candle closed with a small upper wick + reduced body size, hinting at hesitation after a parabolic run.
🔸 RSI Risk
RSI is at 80.41 — very overbought on daily.
While not immediately bearish on its own, this often precedes either:
Sharp correction, or
Prolonged consolidation
🔸 Fibonacci & Macro Resistance
$198–$200 is a confluence zone of:
0.5 Fib retracement
Previous structural resistance
Measured target of inverse H&S pattern ALREADY HIT.
This is not a great spot to initiate new longs — any weakness here invites a pullback.
⚠️ Invalidation of Bearish Thesis
A strong daily close above $200–$204, ideally with expanding volume, would invalidate the bearish outlook and shift momentum toward $219 (0.618 Fib).
🧠 Summary:
Yes, there is a short-to-mid-term bearish risk developing on both 4h and daily:
Overbought RSI
Stalling at major Fib resistance
Decreasing momentum
Vulnerable if $194–$195 breaks
Remember: this WILL MOST LIKELY BE A SHORT-SHORT pullback, not a confirmed trend reversal… yet. BUT I'VE INITIATED A STARTING POSITION!
THIS IS NOT FINANCIAL ADVICE. DrAnkin Smöökëē Whizkee. Edumacational Purpiz Only!
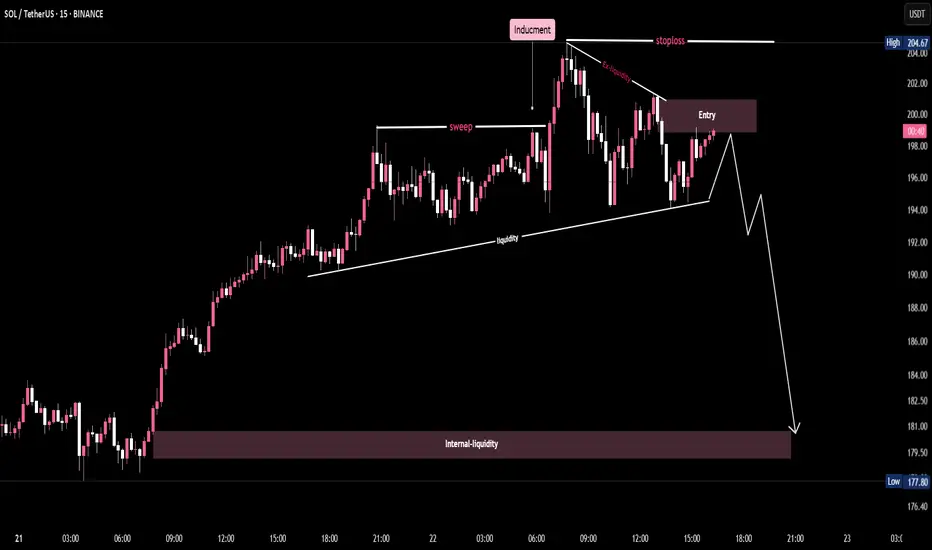
Bearish SMC Setup on SOL/USDT -15-Min chart🔑 Key Points from the Chart:
1.Inducement:
A price level engineered to trap breakout traders before reversing.
The chart shows a false breakout above the previous high, which induces buyers.
2.Sweep:
The market sweeps the prior highs (liquidity grab), enticing breakout traders.
Price shortly reverses after triggering stop orders above.
3.Ex-Liquidity (External Liquidity):
Refers to stop-loss clusters above the high.
This liquidity is taken out, leading to a reversal.
4.Entry Zone:
A supply zone where the price revisits after the sweep.
Ideal short entry indicated in the maroon box.
5.Stoploss:
Placed above the inducement high (post-sweep high).
Clearly labeled to show safe invalidation zone.
T6.rendline Liquidity:
Diagonal support connecting higher lows.
Acts as a trap—once broken, confirms bearish intent.
7.Internal Liquidity:
Major demand zone where price is expected to head next.
Target for the short setup, marked in a large maroon rectangle.
8.Projected Price Path:
White line showing expected bearish move.
Aims for internal liquidity zone below $181.