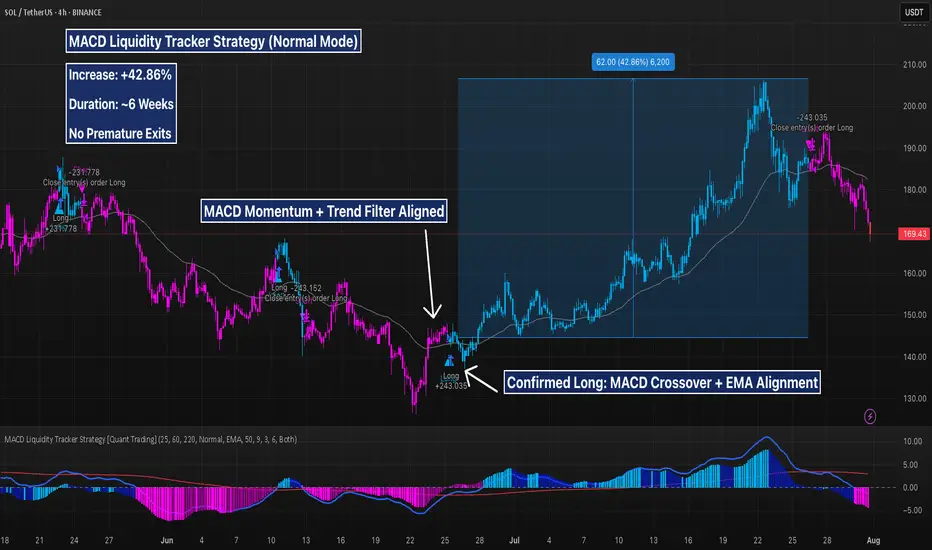
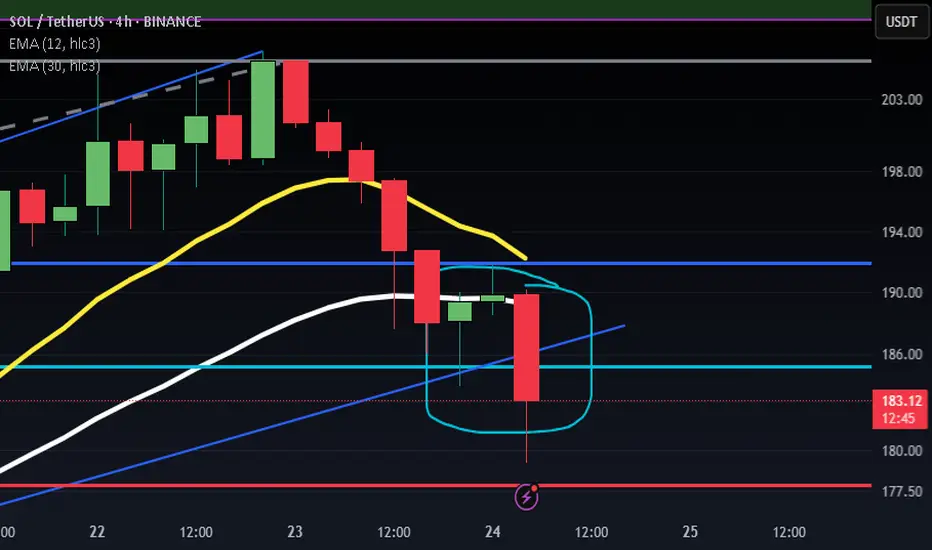
SOL 4H – 42% Win From Trend Filtered MACD Entry, But Is MomentumSOL just delivered a textbook 42.84% rally using the MACD Liquidity Tracker Strategy (Normal Mode). Entry was triggered once MACD momentum aligned with the 60/220 EMA trend filters — a clean breakout from consolidation with no noise or fakeouts.
The system captured the full leg up from ~$143 to over $205, holding through the expansion phase and exiting as bearish momentum began to show. Now, price has dipped below key EMAs and MACD is printing red — signaling a possible shift in structure.
📉 Will bulls defend the $165–$170 zone, or is a deeper pullback on deck?
📊 Strategy Settings:
MACD: 25 / 60 / 220
Trend Filter: 60 & 220 EMA
System Mode: Normal
Timeframe: 4H
SOLUSDT.P trade ideas
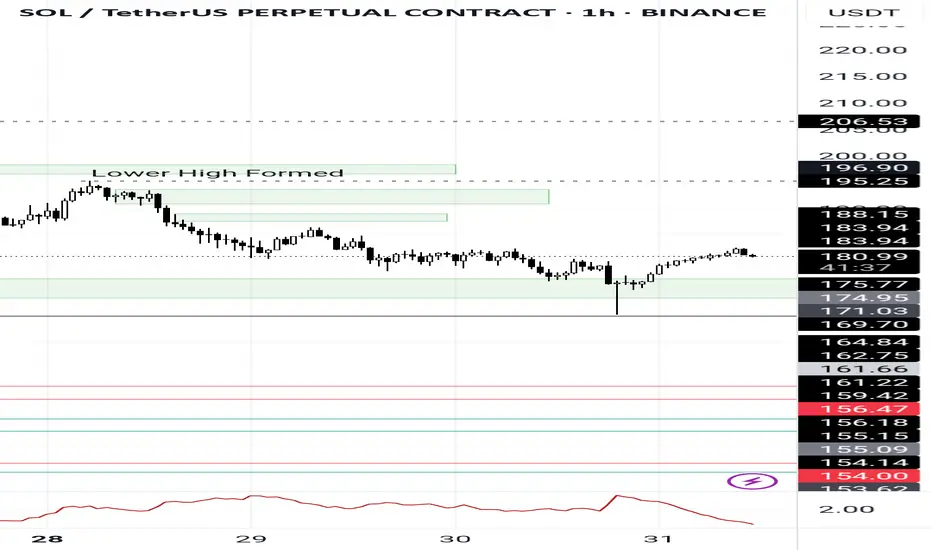
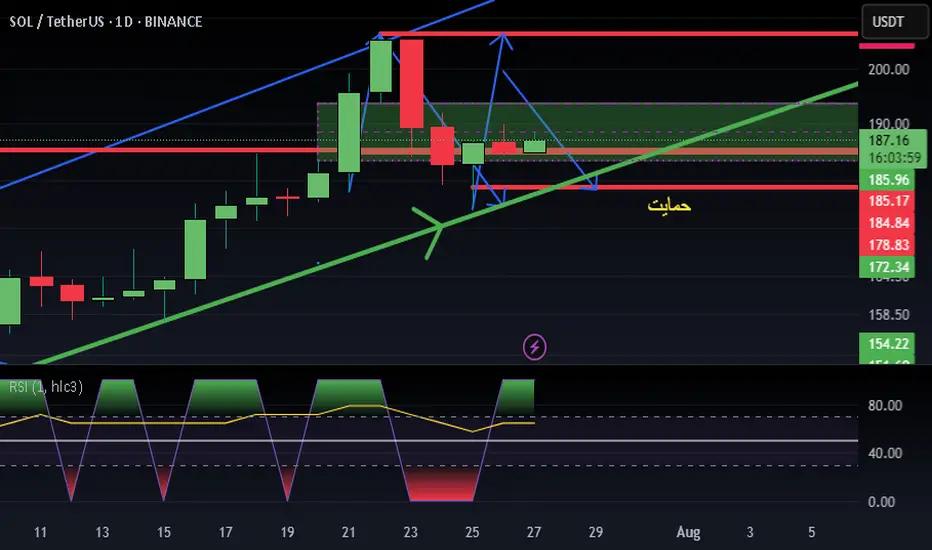
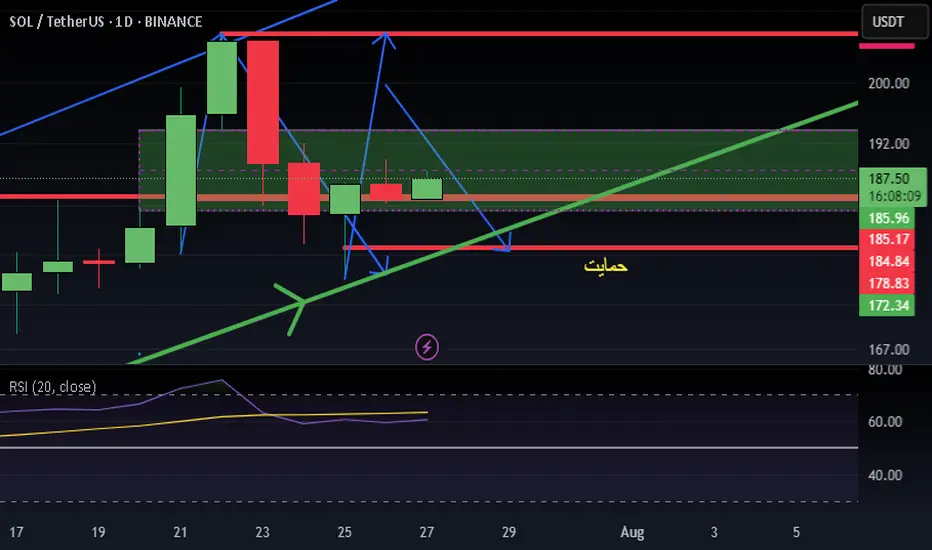
BEARISH TREND STARTI SEE ll and lh is bearish trend start ? just look at the hight and low its make ll and lh resistance area is about 182 support area is 170 to 172

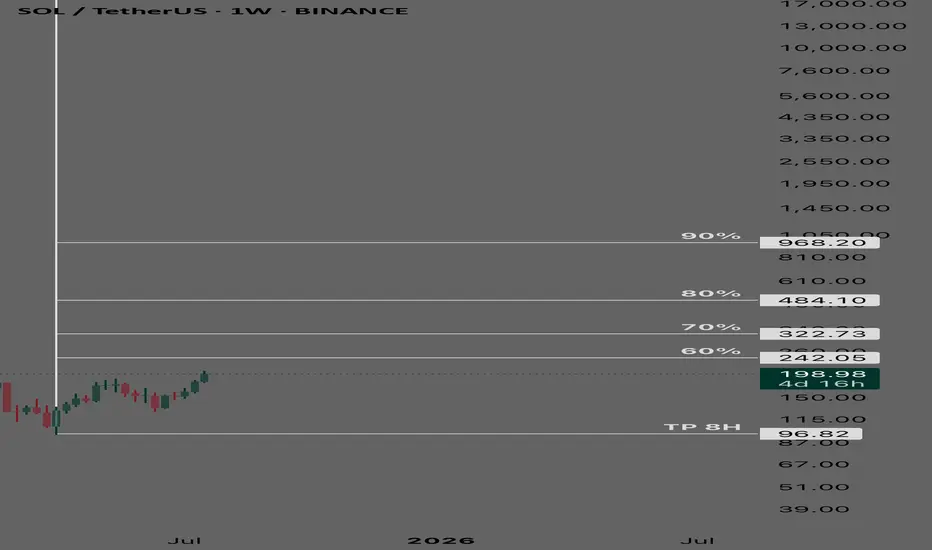
SOLUSDTSix potential targets for SOL. I personally am bullish on SOL, but the price action confirms the final price.

Short Executed alreadyAs I predicted the liquidity pool was raided but it didn't go back to my entry before running.
Congratulations if you got in at market entry
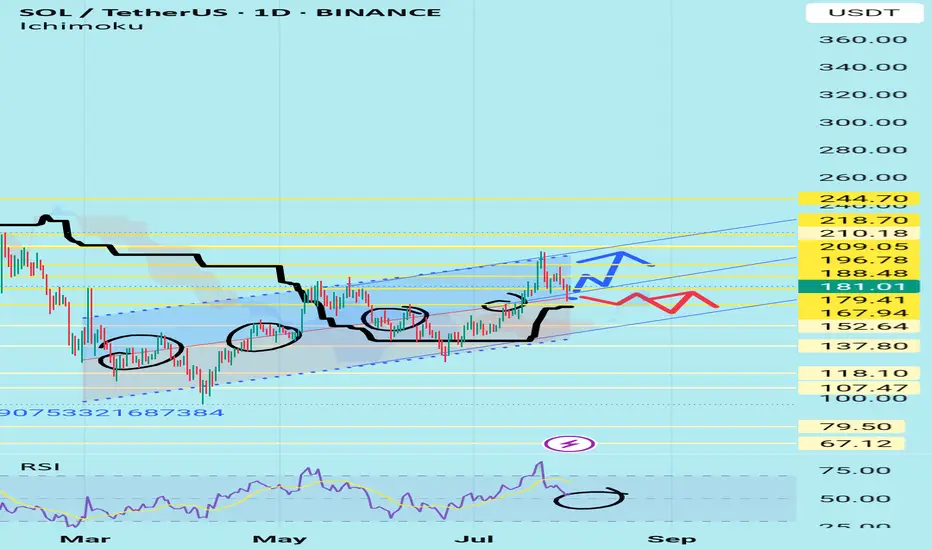
SolusdtHi snipers. On the one-day timeframe, the price is fluctuating in an ascending channel. It has now reached the middle line of the channel and the 103-day moving average support line is below it, which will help the price to move up again and reach the channel ceiling. If this support is broken, the price is likely to fall to the channel floor. This analysis is just a possibility. It is not a trading recommendation.
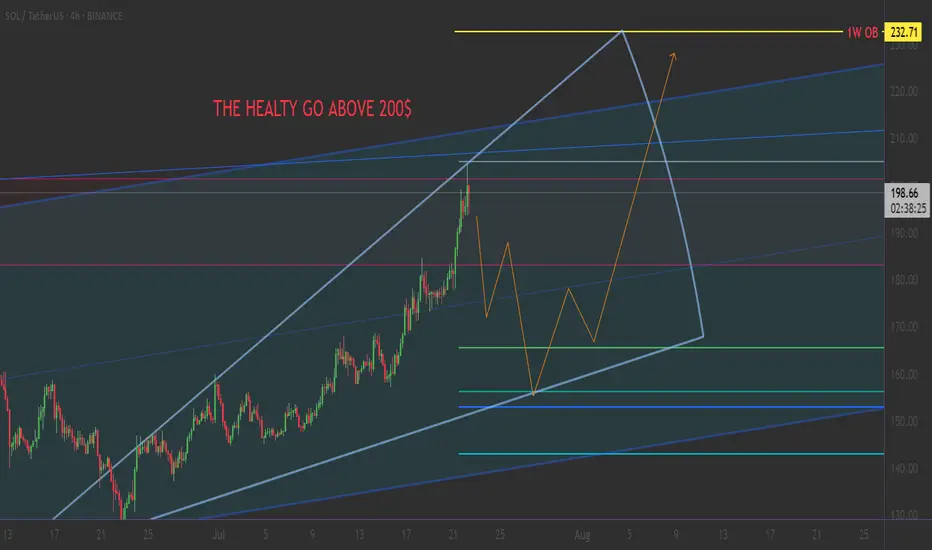
SOL ideas, which one you think gonna play? green or blue?SOL and crypto likely in the last corrective wave before going much higher

Weekly trading plan for SolanaLast week BINANCE:SOLUSDT played out perfectly according to our orange scenario. Currently, we're in a correction phase, trading below the key weekly reversal level at $190
Key Observations:
Bullish divergence forming on the hourly chart
But 4-hour chart shows further downside potential
Critical Levels:
Break above weekly pivot + trendline → Targets $220
Failure to reclaim above hourly MAs → Opens path to $160
Trade carefully - this could go either way

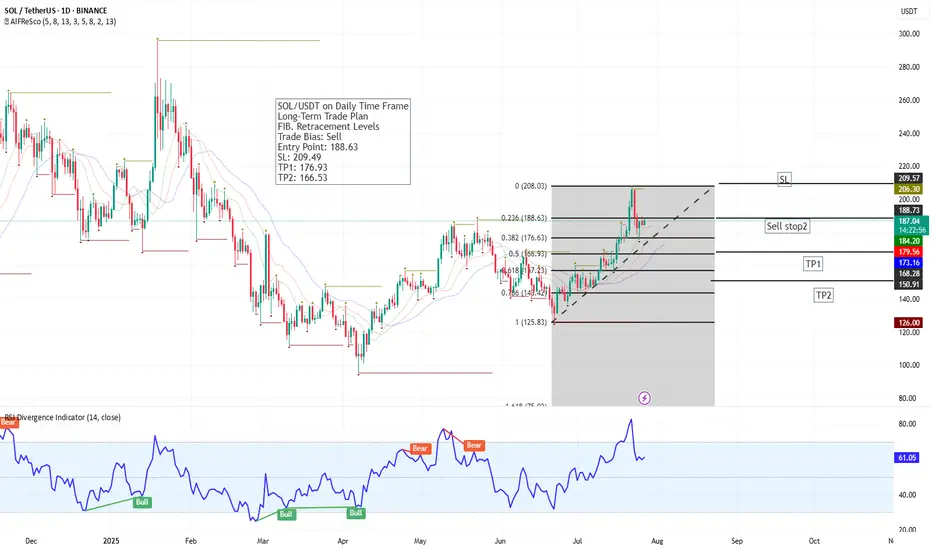
SOL/USDT – Daily Chart | Long-Term Fibonacci Sell SetupSOL has completed a strong bullish leg and is now reacting from the 0.236 Fibonacci retracement level at 188.63. A sell setup is developing based on this resistance zone and weakening momentum.
🔻 Trade Plan:
Sell Stop: 188.63
SL: 209.49
TP1: 176.93 (38.2% Fib)
TP2: 166.53 (50% Fib)
📉 RSI at 61.02 shows early signs of a bearish divergence. If price loses momentum at current levels, this setup could offer a solid retracement trade toward the mid-Fibonacci levels.
Watch for breakdown confirmation and manage risk accordingly.
new theoryi have new theory i change rsi lenght to 1 and i see over buy and over sell zone in short term what your idea when rsi reach above 70 we sell and open a short position after reach over sell zone we close the sell position and open a long position in future we make big money
signal of buyingthis is morning star we need this cadle! i see a morning star candle in one day
this is strong bulish signal what is your idea>?
Solusdt bullish daily time frame A bullish iH&S/cup&handle pattern is forming. A close above 168 may activate the pattern.
Targets are 180, 200 and 220
Invalidation if closes below 157

need a green candleif a green candle apear we se morning star candle but hope still not dea!just a green candle


Rsi is still strong in dayly i see Rsi indecator still strong in day i think nex target in sol is 225


SOLUSDT - Long term sell cycle SOLUSDT
Longterm sell cycle (positive bubble)
TP@96.82
% bubble ratio
In 8hr timeframe sol is in a long term bubble (sell cycle) with fair value at 96…
HolderStat┆SOLUSD retest of the $200 levelOKX:SOLUSDT has cleared $175 and continues pushing higher. $185 is the next key level. Support sits near $169 in case of a pullback.
SOL may outperform ETH once again and here is why⚡️ The world's first ETF with SOL staking was recently launched. Already in its first weeks, it is showing inflows, and SOL has grown by more than 25%.
However, it is still further from its ATH than ETH. But in this momentum, SOL may perform better than ETH. Let's figure out why:
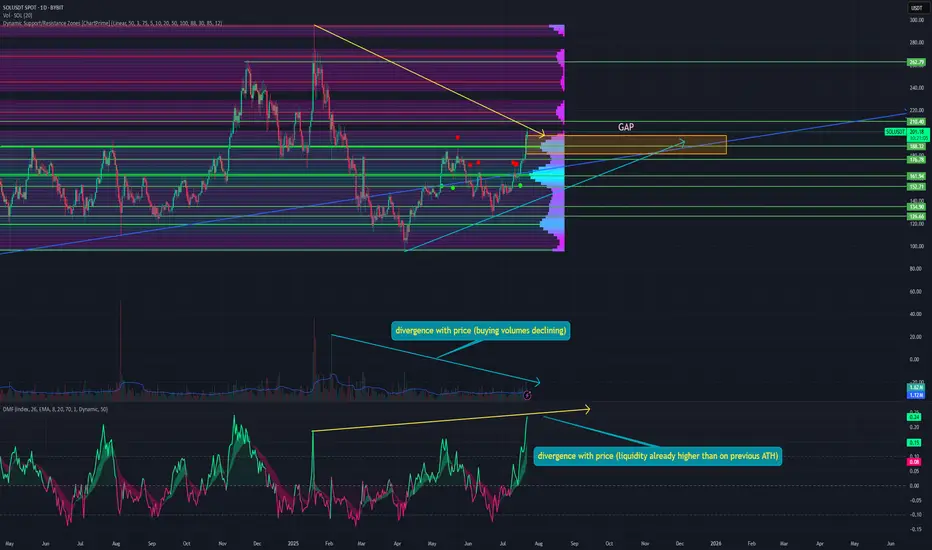
➡️ Below the current price, a GAP has formed at $197.39 - $181.64. Unlike other tokens, SOL's growth has been organic and has left virtually no GAP below.
➡️ Money Flow - a divergence with the price has formed. Since liquidity inflows have already exceeded the volumes of the previous ATH, which was set at 295. This shows a huge number of people willing to invest even at such a price.
➡️ Volume - however, purchase volumes continue to decline. This also forms a divergence with the price, indicating a slight decline in buyer interest at the moment.
➡️ Support Resistance Dynamic - a large zone of interest has formed at the $167 - $159 levels. So any initial correction to this level will likely be bought up in an instant. There is also a large level of interest at $187 - $188.
Above that, there is currently no high interest from sellers, which means that unhindered growth can be expected.
📌 What is the result?
Everyone is focused on ETH. SOL is quietly doing its thing again, just like at the beginning of the cycle. There have been no radical changes in ETH, but the price has started to rise, and now everyone considers ETH to be the brilliant super-technology of the future.
This proves how easy it is to manipulate the market and sentiment. You have good technology at a price of $3,800, and the same technology is simply terrible at a price of $1,400.
I would also like to remind you that SOL has been outperforming all other networks in terms of profit for several months now. So I definitely recommend taking a closer look at it.
🔔 By the way in our Trading Community we already make $4.000 only by today! Subscribe if you want to make sure this last impulse of the bullrun will be profitable for you!
Have a nice day, everyone! 🔥
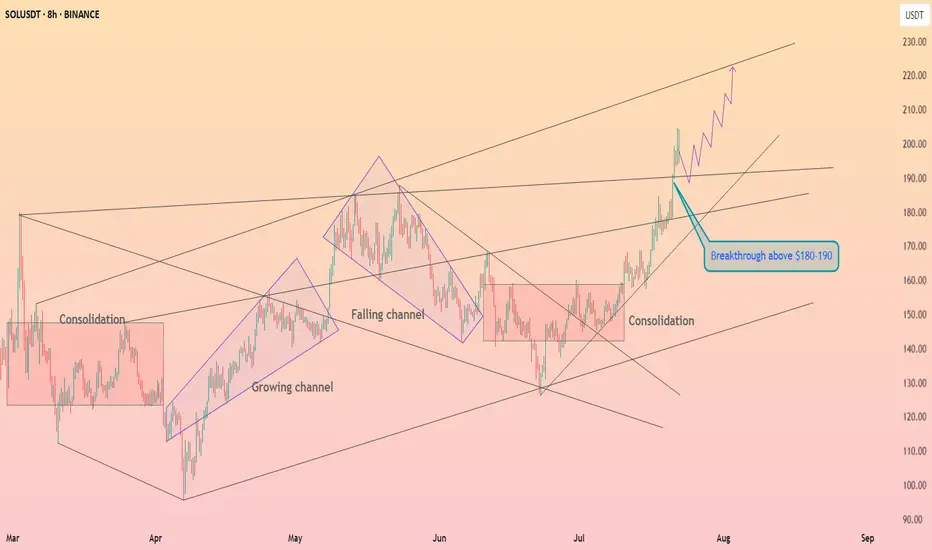
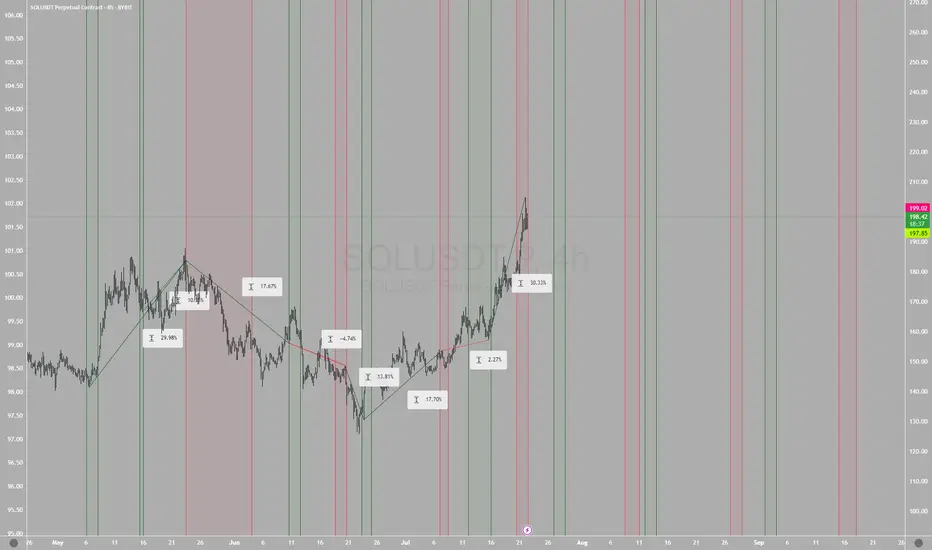
Buy/Sell (long/short) areas for major cryptos part IIthis is a continuation of the successful first analysis
still somewhat experimental. it was very reliable to identify tops and bottoms past couple of months (you can see the % ranges of previous areas).
personally I've been using it for options, but can be applied to perps and spots (specially at this time of the cycle)
from what I'm seeing mid september could be cyclical top so I stopped this analysis there. Will do part III if that's not the case.
gl

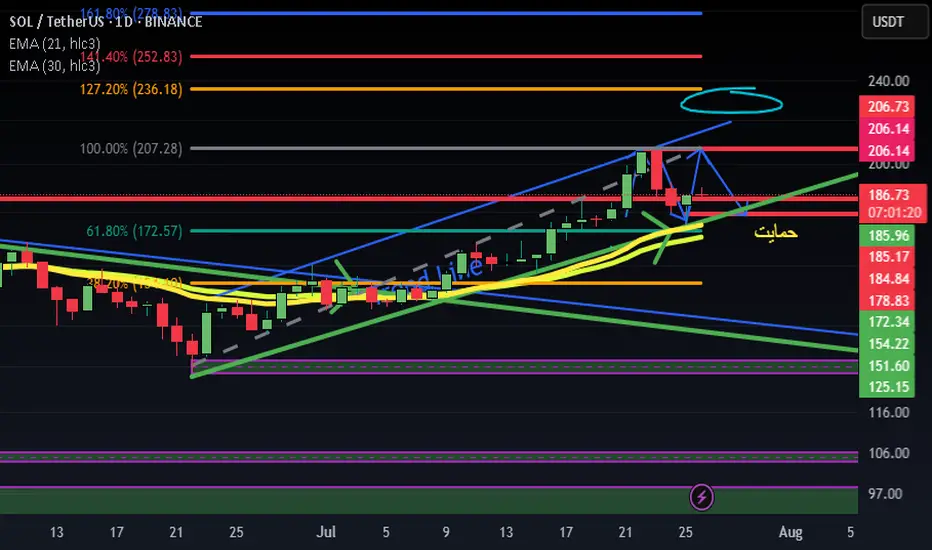
SOLANA: THE ULTIMATE TECHNICAL CONVERGENCE..📊 THE TRADING PLAYBOOK
🛡️ CONSERVATIVE SUPPORT PLAY
Setup: Buy at Fibonacci support levels🚨
Entry: $158-$165 (0.618-0.5 zone) 🌟
Stop: $140 (Below all major support) ❌
Target:
Tp1 : $200(25% gain) 💰
Tp2 : $232 (40% gain) 💰
⚡ Position Size: 3-5% of portfolio ⚡
Time Horizon: 3-6 weeks 🎯
______ NOTE _______
DYOR ⚠️ Not financial advice. This analysis is for educational purposes only. Always do your own research and never risk more than you can afford to lose.
#SOLANA #SOL #SymmetricalTriangle #Fibonacci #Breakout #Crypto #TechnicalAnalysis #AltSeason #DeFi #MemeCoins #TradingSetup