Solana Potential UpsidesHey Traders, in today's trading session we are monitoring SOL/USDT for a buying opportunity around 166 zone, SOL/USDT is trading in an uptrend and currently is in a correction phase in which it is approaching the trend at 166 support and resistance area.
Trade safe, Joe.
SOLUSDT trade ideas

SOL pullback before HTF Demand LevelsSOL to continue its uptrend needs to pullback to HTF Demand levels.
H4 or H12 Demand Zones.
Right now we are forming liquidity on a ewave 4 and possibly going to sweep that liquidity up forming a wave 5 before the push down looking for that HTF level.

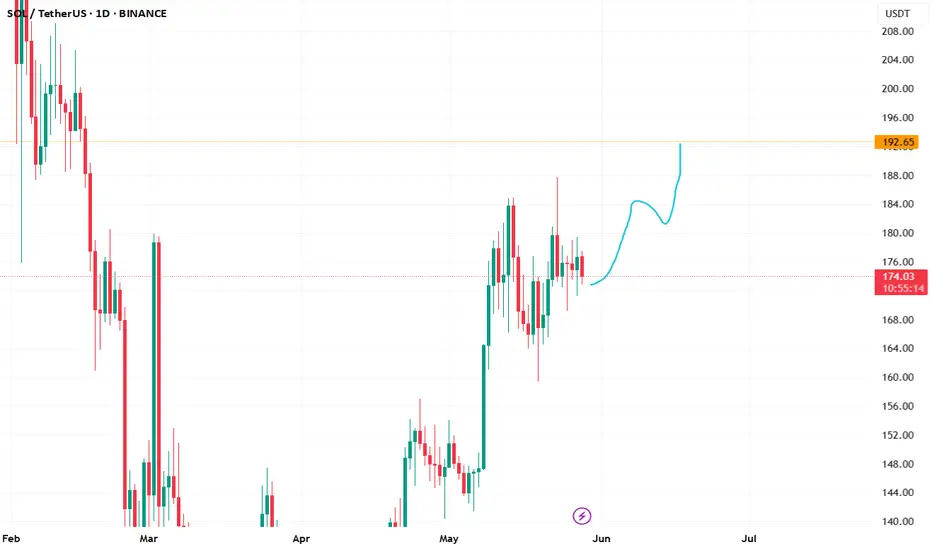
Solana, Consider The Bigger Picture —$420 Isn't The Final TargetThe day before yesterday, based on session close, 23-May, marks a strong rejection from resistance, a mild resistance I should say but, this doesn't change much or anything when it comes to the bigger picture and what we expect in the coming weeks and months.
Good evening my fellow Cryptocurrency trader, I know it is Saturday night but still, it is fun to work.
When in doubt, zoom out... What happens if there is no doubt?
Well, when there is no doubt, rest easy and buy more. Hold easy and profits will come.
Notice the blue line on the chart. This line marks the low from 19-May. While we had a rejection 23-May there is absolutely no bearish action on this chart. The following day, yesterday, was neutral and we will see what the market does today.
The action is happening pretty high compared to the 19-May low. This low is the main support zone and also the baseline of our rounded bottom. $160. You can say that Solana is truly bullish above this level. If it moves below, nothing happens because this isn't likely to happen but if it happens it simply means a market shakeout or bear-trap is taking place. Why? Because we are bullish now, the bullish bias has been confirmed and we will see growth long-term.
Are you aware that interest rates, by the FED (USA), will be lowered next month? This will be used as the catalyst for the Cryptocurrency market to produce astounding growth. When this event happens, you should be fully invested, "buy like is the end of the world" remember?
That's the situation in which we are now. Prices are still low.
Prices are not low as in trading at $100 or $110. But you will consider them super low when Solana starts trading at $300 or higher.
Here is the thing, when the rise happens it will be so sudden and so strong, that you will be wondering, "why didn't I buy when prices were low?" "Master Ananda told me so many times, so many charts..."
It is not too late. Cryptocurrency is set to grow. Long-term.
Thanks a lot for your continued support.
Namaste.

Greed: The Silent Killer Behind Your LiquidationsWhen the market turns green, everyone feels like a genius... But why do most traders lose the most money exactly at that point?
Is it your greed tricking you, or is the market designed to trap emotions?
In this analysis, we take a deep dive into how greed shapes your decisions — plus tools to help you stay rational before placing any trade.
Hello✌
Spend 3 minutes ⏰ reading this educational material.
🎯 Analytical Insight on Solana:
SOL, a market leader and one of my top picks, is currently consolidating near the critical psychological level of $200. Given its historical momentum and influence over correlated assets, a clean break above this level could trigger a minimum 14% upside, with $200 as the immediate target . Market sentiment remains cautious, but the setup hints at a potential bullish continuation 🚀.
Now , let's dive into the educational section,
💥 Where Does Greed Actually Start?
Greed often wears the mask of motivation. The difference? Motivation is rooted in analysis. Greed is rooted in fantasy.
When a coin suddenly pumps 150%, the noise on social media explodes — and so do your imagined gains… often before you've even checked the 4H chart.
📊 TradingView Tools to Spot Greed Traps
TradingView isn't just about pretty charts — it's a powerful platform to organize your trading mindset, if you know how to use it right. Here are three practical tools to help you identify whether your next trade is based on logic — or just plain hype:
Fear & Greed Index:
A composite indicator showing the market's emotional state using volume, volatility, and other metrics. Readings above 70? You’re probably in a greed zone.
Volume Profile Visible Range (VPVR):
This shows where real money has flowed. If you’re buying in a price zone with historically low volume, you might be walking into a fake breakout.
Relative Strength Index (RSI) with 2 or 7 Settings:
A hyper-reactive RSI setting helps you catch emotional peaks in smaller timeframes. Above 80? Time to breathe, not buy.
Pro tip : Build a self-check list on your chart. Questions like: “Am I acting on impulse?” or “Is this revenge trading?” can save you from emotional trades.
🔁 Repeating Behaviors That Kill Accounts
Entering with high leverage and no stop-loss
Buying into massive green candles
Copying trades without personal analysis
Switching strategies based on emotions
Trading just to recover past losses (aka revenge trading)
These are not strategy flaws — they are emotional traps caused by unchecked greed.
🧘♂️ How to Calm Your Mind Before Trading
Ask yourself: "If this trade flips against me, what's my move?"
Use TradingView Alerts instead of staring at charts for hours
Define risk per trade as a percentage, not based on "gut feeling"
Always have an exit plan — the market doesn’t care about your hopes
📉 Is Liquidation Always a Sign of Bad Analysis?
Not always. Often, the chart was right, but greed kept the trader from exiting at the logical spot. Tools told you to get out — but your mind said, “What if it goes higher?”
🧭 How Greed Shows Up in Different Timeframes
In 5-minute charts, greed looks like sudden spikes. In 4H charts, it can be a fakeout or deceptive pullback.
Recognizing the form greed takes in your preferred timeframe is a game-changer.
🧲 How to Use Greed to Your Advantage
Yes — you can flip the script. When everyone is entering trades driven by greed, you can prepare to exit.
If RSI is high, volume is weak, and hype is everywhere — maybe it’s time to cash out, not load up .
💡Closing Note
Greed exists in every market — but that doesn’t mean you have to follow it.
Start treating your chart like a mirror — not a crystal ball. When a trade feels “too perfect,” stop and reflect. It might not be your edge talking — it might be your greed .
always conduct your own research before making investment decisions. That being said, please take note of the disclaimer section at the bottom of each post for further details 📜✅.
Give me some energy !!
✨We invest countless hours researching opportunities and crafting valuable ideas. Your support means the world to us! If you have any questions, feel free to drop them in the comment box.
Cheers, Mad Whale. 🐋

$SOL Breakout Watch📈 CRYPTOCAP:SOL Breakout Watch 📈
#SOL is breaking the 1H diagonal trendline — eyes on PDL at $172.6 🚨
Want to see it reclaimed + retested as support for a long entry 🎯
Local resistance = PWH at $184.84
Let it reclaim, then ride the wave 🌊

Double Top Alert: SOLUSDT Setup Screams ReversalYello Paradisers, will you act like a pro and prepare for the next clean short opportunity on #SOLUSDT, or will you fall for the same breakout trap again just before the market punishes greed?
💎#SOLUSDT is displaying a textbook double top formation just under a well-respected resistance zone. This kind of structure is no joke—it’s a consistent precursor to sharp downside when liquidity gets taken from retail longs who are too eager to buy high. The market rarely gives second chances. What you’re looking at now is one of them.
💎Price has printed a double top around the $185 to $188 region. That zone has repeatedly acted as a ceiling, and buyers have failed to maintain any strength above it. The lack of follow-through is a major sign of exhaustion, especially after the second tap failed to even test the previous high with conviction.
💎Instead of breaking out, SOLUSDT has rolled over and is now struggling under the $176.23 minor resistance. That weakness is already being confirmed on lower timeframes. As long as this area holds as resistance, there is no justification for any probable aggressive long setups. This is a market preparing to punish overleveraged traders.
💎There’s a clear invalidation for this setup, and it’s extremely important to stick to it. Any 4H candle closing above $190.18 would break this structure and force us to step back and reassess the setup. Until that happens, the current bearish thesis remains firmly in play.
💎The nearest support sits at $168.86 which has highest probability that price may visit there. This level may act as a brief pause, but if the selling intensifies, it will likely break. A confirmed move below that level opens the door toward the true target of this breakdown, which is the $153.95 major support zone. That’s where we’ll be watching for a real reaction.
💎The current structure is heavily skewed toward the downside. Bears are clearly in control below $176.23, and the market has shown no signs of reclaiming key levels that would shift that control back to the bulls. Any bounce should be treated as corrective unless proven otherwise by a structural shift.
Strive for consistency, not quick profits, Paradisers. Treat the market as a businessman, not as a gambler. If you master that mindset, you’ll already be far ahead of the crowd.
MyCryptoParadise
iFeel the success🌴

Solana 8X Lev. Full PREMIUM Trade-Numbers (PP: 1088%)Good morning my fellow Cryptocurrency trader, I wanted to give you one more high profits potential, high probability, high certainty, great entry and timing, leveraged-trade.
The Altcoins market is about to go wild and this chart setup can be a life changer if approached with the right planning and mindset, if approached in the right away.
» SOLANA —SOLUSDT
I'll let you take care of the rest.
Full trade-numbers below:
____
LONG SOLUSDT
Leverage: 8X
Entry levels:
1) $182
2) $175
3) $165
Targets:
1) $195
2) $220
3) $253
4) $296
5) $343
6) $372
7) $420
Stop-loss:
Close weekly below $160
Potential profits: 1088%
Capital allocation: 5%
____
Thank you for reading.
If you enjoy the charts, numbers and content, consider a follow.
Namaste.

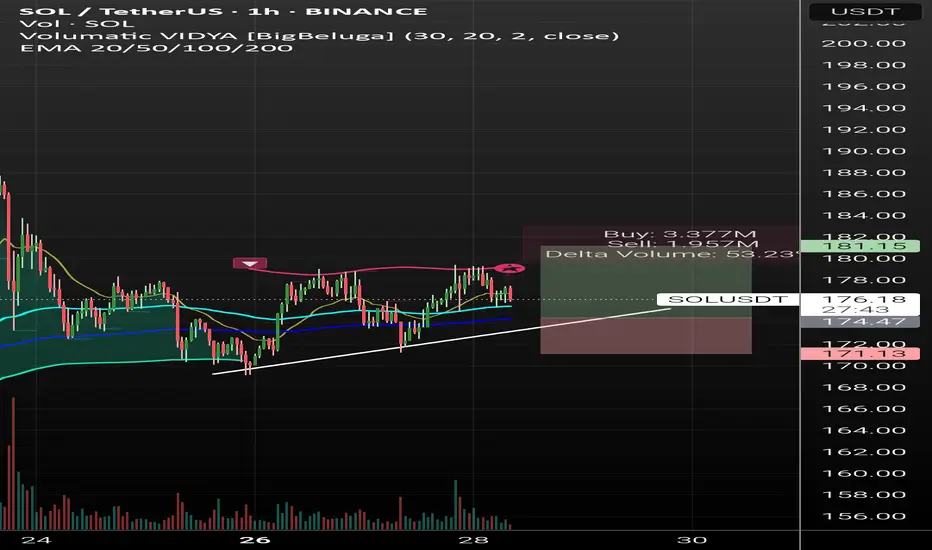
SOL/USDT Analysis – 1H Timeframe🟩 Entry: $174.00
🟥 Stop Loss: $171.13
🎯 Take Profit: $181.15
📈 R:R Ratio: ~2.4:1
Technical View:
Price respects ascending trendline support.
Entry near EMA100/200 confluence – strong technical demand zone.
Delta Volume +53.5% shows aggressive buyers.
EMA20/50/100/200 stacked upward → bullish structure.
Fundamental Bias:
$1B funding from SOL Strategies boosts institutional confidence.
Capital rotation signals long-term support for Solana ecosystem.
Market likely to price in bullish sentiment → supports long bias.
✅ Setup aligns technically and fundamentally. Justified long.
SOL showing strength despite the orange swan event. SOL will either break out or consolidate into a tradable structure. The orange swan event sell-off leading into the weekend is not a good time to enter fresh trades. However, preparing appropriately for what is coming next is a valid strategy.
Full TA: Link in the BIO

SOL Contract Expiry BreakdownChart shows how SOLANA is on trend with contract expiries that show a surge or breakdowns near, at, and after expirations. DYOR and make informed choices

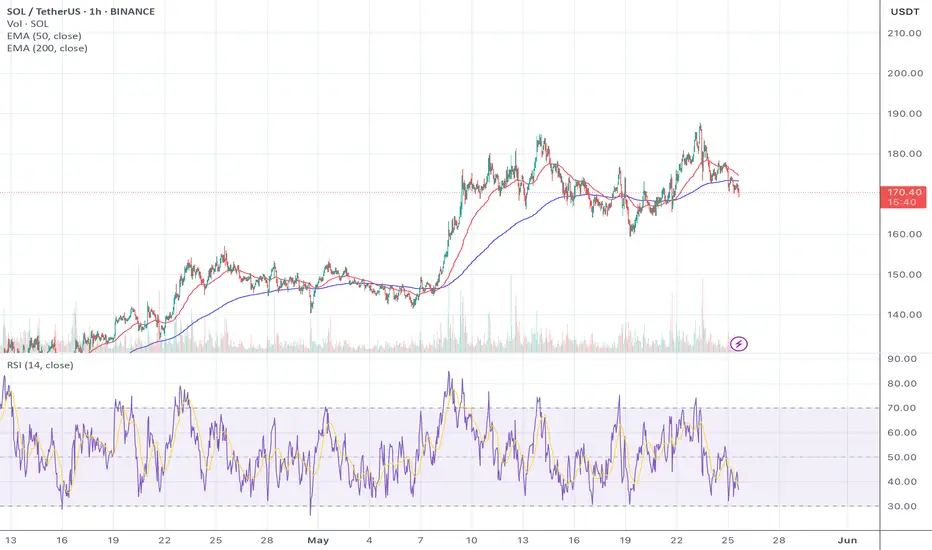
Solana updateSolana (SOL) is testing key support levels after a strong rally earlier in May. Price has dipped below the 50 EMA while staying just above the 200 EMA, signaling potential consolidation or reversal territory. RSI is showing early signs of bullish divergence, hovering near the 40 level. This setup could indicate either an upcoming bounce or deeper correction, depending on volume and trend confirmation.
Indicators:
EMA 50 / EMA 200 crossover watched closely
RSI 14 showing volatility near oversold
1H timeframe (Binance spot chart)
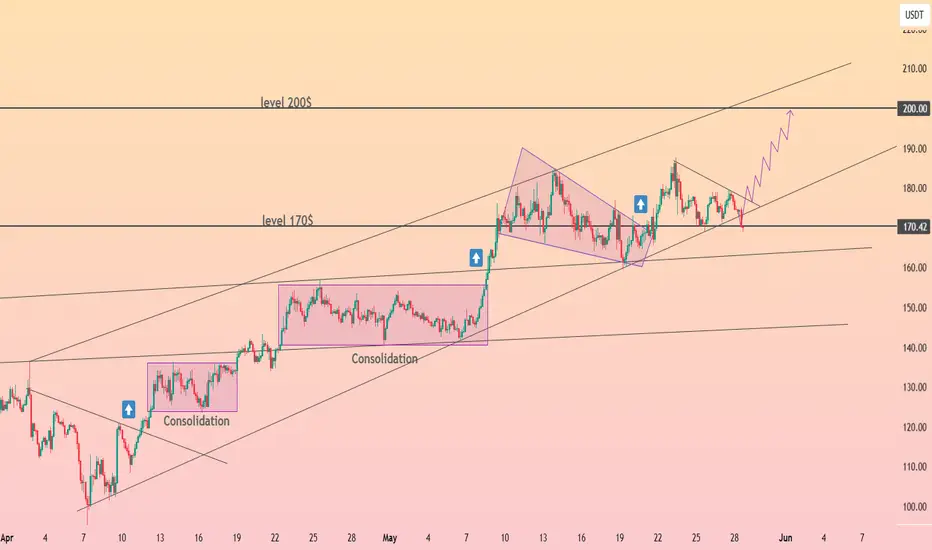
HolderStat┆SOLUSDCRYPTOCAP:SOL price radar: Solana escaped dual consolidations and now oscillates between 170 and 200 inside an ascending channel. Bulls defend trend-line support as a tightening wedge eyes 200. Chart structure and price analysis favor further upside momentum.
Solana (SOL): Aiming For $200 | June 2025Solana coin is still showing some kind of buyside dominance, where we are keeping close attention at 100 and 200 EMA on a 4-hour timeframe.
More in-depth info is in the video—enjoy!
Swallow Academy

SOL Trade Blueprint: Waiting for the High-Conviction EntryAfter printing a SFP at the key high of $180.52 followed by a sharp -8% rejection, SOL made a second attempt to breach the major resistance zone between $180–$185 — but once again, bulls fell short. Since then, price has been in a corrective phase. So the big question is: where’s the next high-probability trade setup? Let’s zoom out and break it down.
📏 Zooming Out: Structure, FVG & Fib Confluence
Back on May 8th, SOL broke through the April 25th swing high at $157 with strong momentum, leaving behind an untested Fair Value Gap (FVG) — a key displacement area that’s yet to be filled. When we draw the Fibonacci retracement from the low of that move to the current high, the 0.618 retracement lands precisely at $157.34 — right on the old breakout high. That’s a beautiful confluence.
Timing-wise, if SOL pulls back to that level between May 21–22, the 0.75 Fib speed fan also kicks in — adding dynamic trendline support to the static Fib level.
📉 What About the $164 Golden Pocket?
There's a golden pocket forming around $164 from a recent mini-impulse, and while it may look tempting, context matters. This pocket isn't supported by enough confluence — no major structure, volume shelf, or EMA alignment. For a quick scalp? Yes. But for a high-conviction swing? It's not ideal.
Remember, in trading we're not here to chase every candle — we're here to wait for the setups that stack the most reasons to say yes.
📍 The Zone to Watch: $157
Now let’s talk about that $157 zone — and why it’s standing out as the highest-probability long setup:
0.618 Fib retracement of the major impulse
Retest of the breakout swing high
Untested Fair Value Gap (FVG)
233 EMA + 233 SMA on the 4H timeframe lining up as dynamic support
1.5 outer pitchfork support line crossing through
1:1 trend-based Fib extension confluence
Prior area of interest
This is what we call a “stacked setup.” The more layers of confluence, the more conviction we have in the trade. Add to that the potential for a liquidity sweep (SFP) just below the current low at $159.44 — and it becomes a zone worth watching closely.
🎯 Long Setup:
Entry: $157–$159.44 (watch for SFP confirmation)
Stop-Loss: Below $154
Target: $200
R:R: Approx. 1:12 — a setup worth being patient for
🧠 Educational Note: Why Confluence Is King
High-probability trades don’t come from guessing. They come from stacking confluence: structure, Fibonacci, moving averages, time-based levels, pitchforks, VWAPs, volume profiles — the more that lines up, the less you need to hope and the more you can trust your edge. Think like a sniper, not a machine gun.
The market rewards patience and precision — not noise and FOMO.
🔻 Short Setup (Alternative Play)
While we’re primarily bullish, there’s a valid short opportunity at the psychological $200 mark — but only if price shows clear rejection and confirmation (e.g. SFP, bearish engulfing, high volume reversal).
Entry: $200 rejection
Stop-Loss: Above $205
Target: $185–$180
R:R: Approx. 1:3+
🔥 Final Words: Trade With Purpose
This is what trading is about — not chasing green candles, but waiting for structure, clarity, and alignment. Whether you’re trading long or short, focus on high-conviction setups backed by logic and levels, not emotion.
Don’t trade for action. Trade for precision. The market will always reward the patient ones who are willing to wait for that clean entry, stacked with reasons to act.
Trust the process, stay disciplined, and let the charts do the talking. 💪📈
___________________________________
If you found this helpful, leave a like and comment below! Got requests for the next technical analysis? Let me know.

Solana | SOL spot TRADE SETUP +65%Firstly, let's look at the SOL chart from a larger view to confirm the agreement for a bullish setup.
What we see above is a clear bullish bottom, followed by a sharp V-Shaped recovery in the daily timeframe.
From here, the ideal entry could be within this zone, either dollar-cost average or just one spot buy:
With the STOP-LOSS around here:
And THREE TP (take profit) points:
1️⃣
2️⃣
3️⃣
Naturally with the timeframe of your HOLD increasing as your target moves higher.
_________________________
BINANCE:SOLUSDT

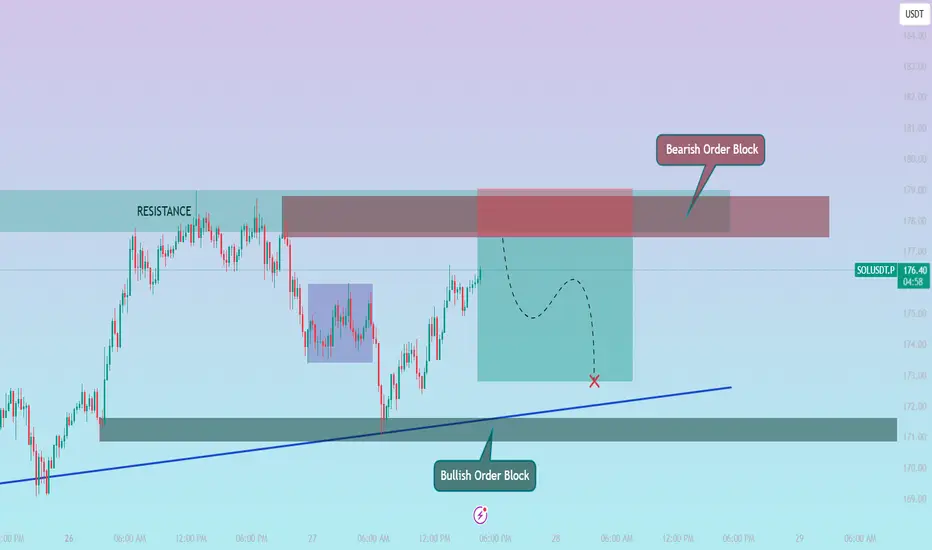
SOLUSDT – Short Setup Based on Price Action.Price recently tapped into a strong resistance zone between 177.61 – 179.00 after a solid bullish push. But instead of breaking out, we’re seeing rejection candles and slowing momentum — a sign that buyers might be losing control.
I’m expecting the market to form a lower high around this zone and start a downward correction. There’s also a rising trendline and a demand area below (near 171.63 – 170.82) where price could possibly bounce again.
🔽 Sell Entry: 177.47
🎯 Target: 172.81
⛔ Stop Loss: 179.03
Let’s see if the market respects this resistance and gives us a clean move down. Always manage risk wisely. 🔐
solusdt will go to towards 320$solusdt BINANCE:SOLUSDT will go towards $320
In the current area, a downward correction to $150.5 is possible, but ultimately the final destination is $320,
Market geometry doesn't lie.
$320 is an index for this symbol.

$145 Stop, $262 Target — SOL Bullish Breakout Looks UnstoppableThe chart presents a clean bullish reversal from the previous downtrend observed between February and early April. After breaking the long-term descending trendline, Solana (SOL) flipped structure and has been printing higher highs and higher lows, signaling a transition into an uptrend.
This is reinforced by the ascending blue trendline that currently acts as a dynamic support. Each price correction respects this trendline, showing that buyers are defending higher levels.
✅ Key Technical Justifications for Bullish Bias
1. Break of Downtrend
The long-term descending trendline from the February highs was broken decisively.
This signifies a trend reversal, which has since seen SOL push into a new bullish channel.
2. Strong Higher Lows
Price has been consistently making higher lows, respecting the blue uptrend line.
This price behavior confirms increasing bullish momentum.
3. Support Level Holding
The horizontal support around $96.59 was respected during the reversal.
This base forms the foundation of the bullish wave we’re seeing now.
4. Bullish Price Compression
After a strong impulsive rally, SOL has entered a consolidation just above the trendline.
This resembles a bullish flag or pennant, typically a continuation pattern.
5. No Major Resistance Until $260+
The nearest strong resistance sits around $262.56, which aligns with a previous breakdown zone and coincides with your take-profit (TP) zone.
With no serious resistance in the $200–$250 range, price can climb smoothly once bullish continuation triggers.
📊 Trade Setup (Long Position)
• Entry: Around $174.30 (current market zone as per chart)
• Stop Loss (SL): $145.00 (Below recent swing low and dynamic support — gives the trade breathing room)
• Take Profit (TP): $262.56 (Aligned with horizontal resistance and measured move target)
Risk-to-Reward Ratio: 2.91
Potential Reward: +50%
Potential Risk: -17%
This trade setup is not only favorable from a risk/reward standpoint but also follows price structure, trend, and technical confirmation.
🧠 Final Thoughts
Solana (SOL) on the daily chart has shifted into a clearly bullish phase after a textbook breakout from its multi-month downtrend. The current setup shows a healthy trend structure, room for price expansion, and favorable technicals across the board. The next key breakout will likely occur above $180, and that can send SOL quickly into the $240–$260 range. If you're looking to ride a swing position into Q2-Q3, this is one of the cleaner long setups currently on major altcoins.

HolderStat┆SOLUSD held the support trend lineCRYPTOCAP:SOL sprinted from a falling channel into a sturdy growing channel, staging pauses at 145 and 170. Price now coils inside a descending mini-flag clamped to the 170 horizontal—flip that lid and the 195-200 magnet comes alive, mirroring the flag’s height. Only a decisive close below 160 would dull the current trajectory toward fresh 200-plus highs.

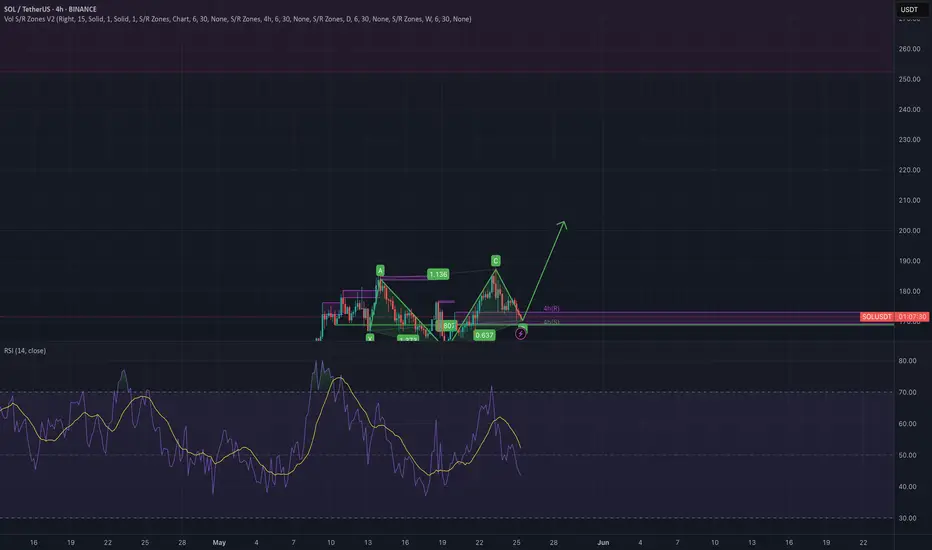
SOLUSDT Looking UpHi there,
Solana looks bullish on the 2-hour timeframe. There is a possibility of a retracement, but if the price falls below the 154.324 level, the setup will be invalidated.
For now, the price appears to be heading up toward the 191.249 level, aiming for a target of 209.887.
The low point at 170.481 maintains bullish pressure, supported by the 164.271 level, which boosts the chances of a higher high.
However, it will require monitoring due to the indicator reaching overbought regions.
Happy trading,
K.
Not trading advice

Solana's fate: pump or dump ?Hello friends
You see that Solana, after its good growth, got stuck in a range and is gathering strength. Now, considering the strong upward trend of this currency, it can be said that this force can push the price upwards, but everything is possible in the market, so observe capital management and trade with your will and wisdom.
*Trade safely with us*
