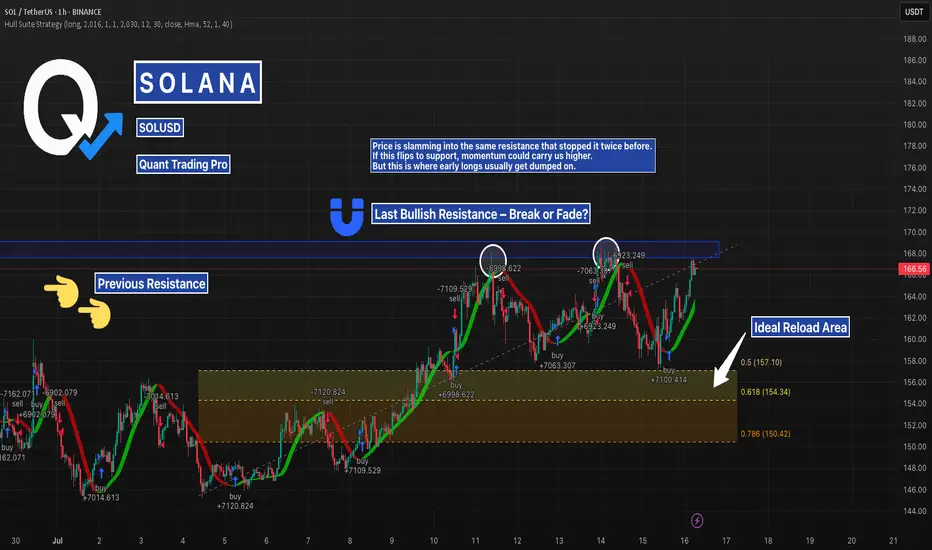
SOLUSD – Big Test at Local Resistance | Fib Reload if RejectedSolana just tapped into prior resistance from July 13–14, a level that previously rejected price.
With fib confluence between $157–$150 below, this is a textbook setup: breakout or rejection → smart money looks for the reload.
Watching closely for structure shift before taking position.
#SOLUSD #Solana #Crypto #Breakout #SupportResistance #QuantTradingPro #TradingView
SOLUSDT trade ideas
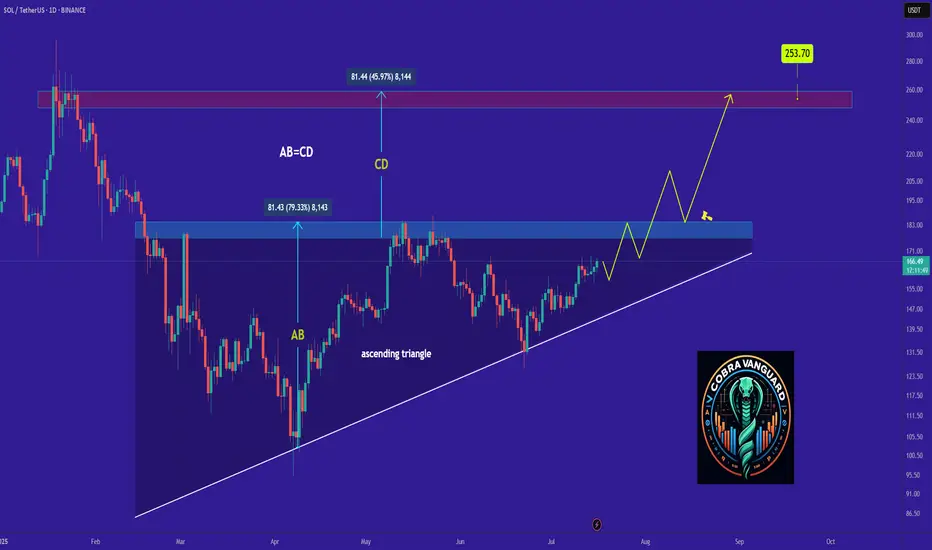
SOLANA's Situation, A Comprehensive Analysis !!!The price on the DAILY timeframe is within an ascending triangle, which can be promising. If the price breaks this pattern with bullish candles, it could easily rise by the distance of AB=CD .
Best regards CobraVanguard.💚
Solana (SOL): Going For +70% Target | Buyers Are Accumilating!Solana has a good opportunity to bounce from here, which would give us multiple trading opportunities that we talked about in the video!
More in-depth info is in the video—enjoy!
Swallow Academy

SOL Long Swing IdeaPotentially HnS pattern, target retrace golden fib arround 155-158, sideways then going higher untill 200$ target. Send it to ATH again! DYOR!

SOL - (Solana) vs SMA 200 SOL - (Solana) vs SMA 200. For now, it's unbreakable. Traders should wait for a catalyst that gives it enough momentum. It may be in a consolidation phase, or it may still need to retreat to find new momentum. It's better to wait for it to clearly define the path for us.

SOL Long : Resume Bulls busy trapping bears at 160 demand zone . BTC also with a massive bear trap yesterday with the move to 115K .
Up trend looks to resume today with next supply zone area of interest at 180
Solusdt 4hr tf Bullish iH&S patter Forming a Bullish iH&S pattern, may activate the pattern if closes above 159.
Targets are 168, 180 and 198
Invalidation if closes below 144


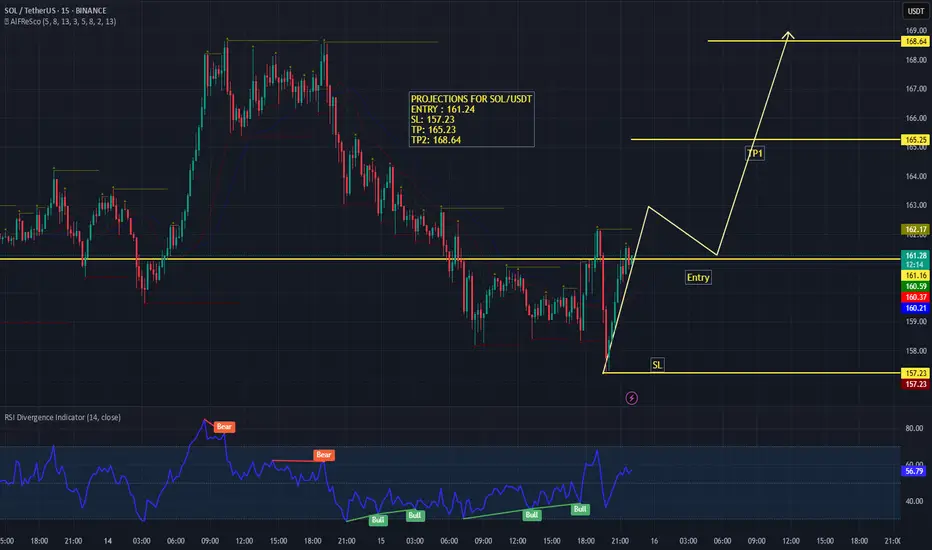
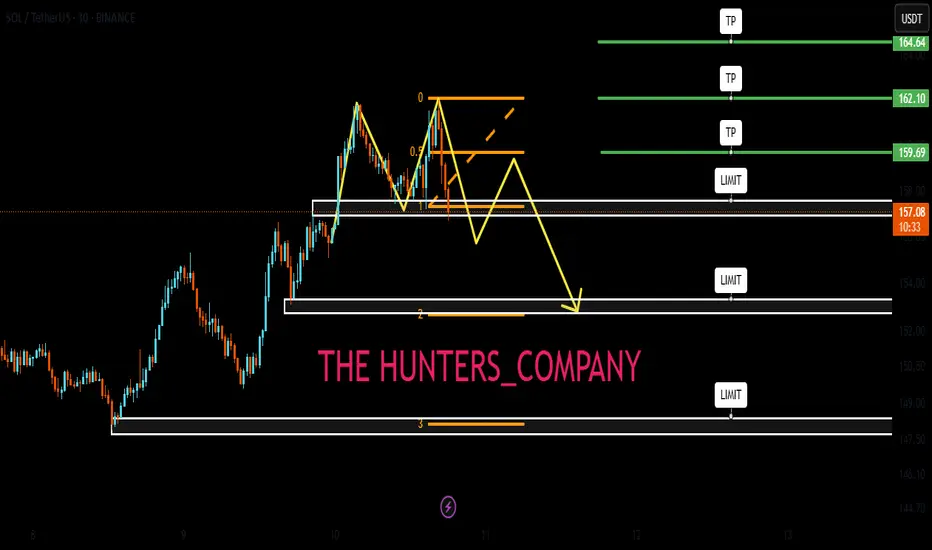
SOL/USDT – 15M Technical AnalysisSolana (SOL) is showing signs of a potential bullish reversal on the 15-minute timeframe after a sharp downtrend. Price has reclaimed key support levels and is preparing for a possible breakout.
📈 Projections & Trade Plan:
Entry: 161.24 (above immediate resistance)
Stop Loss (SL): 157.23 (below recent swing low)
Take Profit (TP):
TP1: 165.23 (near previous resistance cluster)
TP2: 168.64 (targeting the upper resistance zone)
Technical Insights:
The price has broken the descending structure and is showing bullish momentum with a clean impulse leg upwards.
A minor pullback to the entry zone would provide an optimal long opportunity before continuation towards TP levels.
Momentum Indicators:
RSI is trending upwards at 55.56, indicating strengthening buying pressure. Multiple bullish divergences can be observed, which align with the reversal thesis.
⚡ Bias: Bullish
If price holds above 161.24 and confirms breakout strength, we can expect a move toward 165.23 and potentially extend to 168.64. However, failure to hold above 161.00 may invalidate the setup.
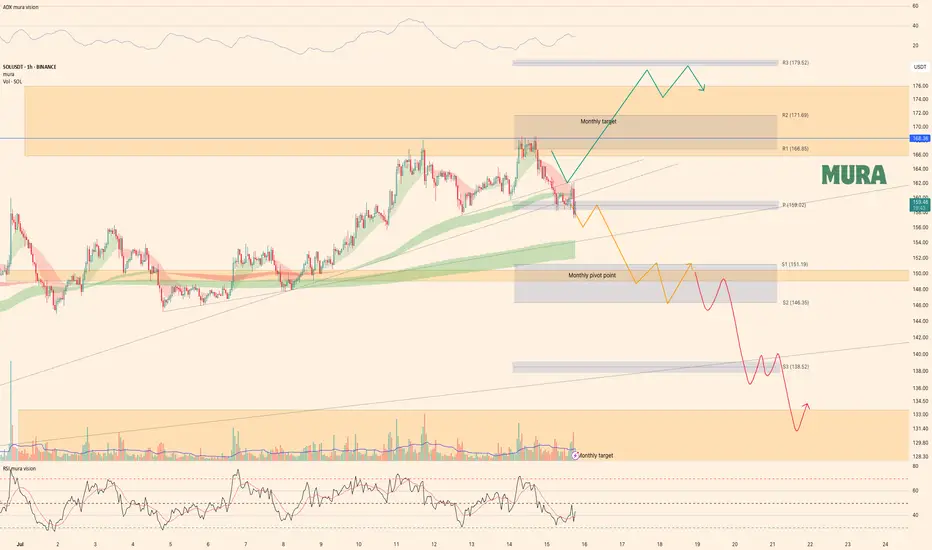
Solana - key levels for this weekSolana is currently testing the weekly pivot point and trying to break higher, but we've already seen one rejection. If it manages to hold above this level, we could see a push toward $169. However, if we get a fake breakout or fail to sustain above the weekly pivot, the nearest support target sits at $151. In that case, price would follow through with our orange scenario. More details are in yesterday's video analysis
Levels marked—now let the market decide
Solana UpdateHello friends🙌
After the price growth we had, the price hit the resistance level of $160 twice and failed to break it, which caused a double top pattern to form, which if confirmed, there is a possibility of falling to the specified areas.😉
The specified areas are good prices for buying in steps, of course, with capital and risk management.✔
🔥Join us for more signals🔥
*Trade safely with us*
Solana:Daily free signalhello friends👋
As you can see, after the drop that we had, insider buyers showed and were able to support the price well.
But it was not enough, and as you can see, a noisy pattern has formed, which can indicate a further decrease in the price.
Now we can take advantage of this opportunity and make step-by-step purchases with risk and capital management in the support areas that we have obtained for you and move to the specified goals.
🔥Follow us for more signals🔥
*Trade safely with us*

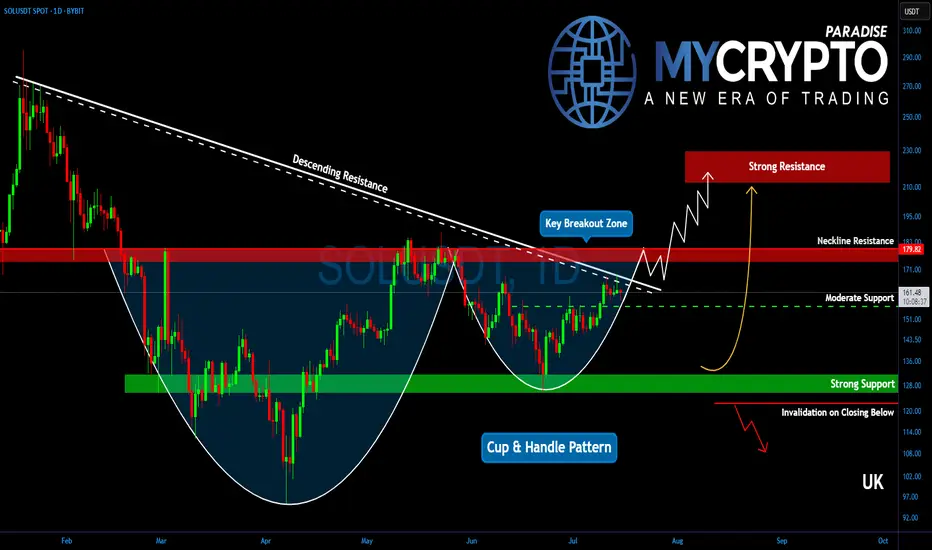
Will Solana Explode? This Important Zone Could Trigger a MoveYello, Paradisers! Is #Solana about to break free into a new bullish wave? After months of struggling under key resistance, the bulls are finally making a serious push… but only one zone stands between SOL and a potential explosion.
💎After peaking in January, Solana has remained suppressed under a descending trendline. But now, that trendline is being challenged aggressively, and the price structure is starting to form a reversal pattern that demands attention.
💎Right now, the most important level on the chart is the descending channel resistance at $167. Bulls are actively testing this zone, and if they manage to flip it into support, it could trigger a significant shift in momentum. But just above, at $180, sits an even more critical barrier, the neckline of the current reversal pattern. This entire region between $167 and $180 is the true battleground.
💎#SOLUSDT's confirmed breakout above $180 would be a major technical signal. It would likely send Solana toward the $210 to $225 zone, which marks a significant resistance area. This isn’t just psychological; it also aligns with the 61.8% Fibonacci retracement, a level where institutional players often begin offloading positions
💎As for the downside, support remains solid between $155 and $160. This region is protected by both horizontal demand and dynamic support from key moving averages, offering bulls a stable base to defend. Adding to the bullish case is a potential golden cross formation between the EMA-50 and EMA-200, a signal that, if confirmed, could inject even more confidence into Solana’s price action.
Paradisers, strive for consistency, not quick profits. Treat the market as a businessman, not as a gambler.
MyCryptoParadise
iFeel the success🌴
Solana short #solSolana needs a little correction from here for a healthy pump , I am in short postion now
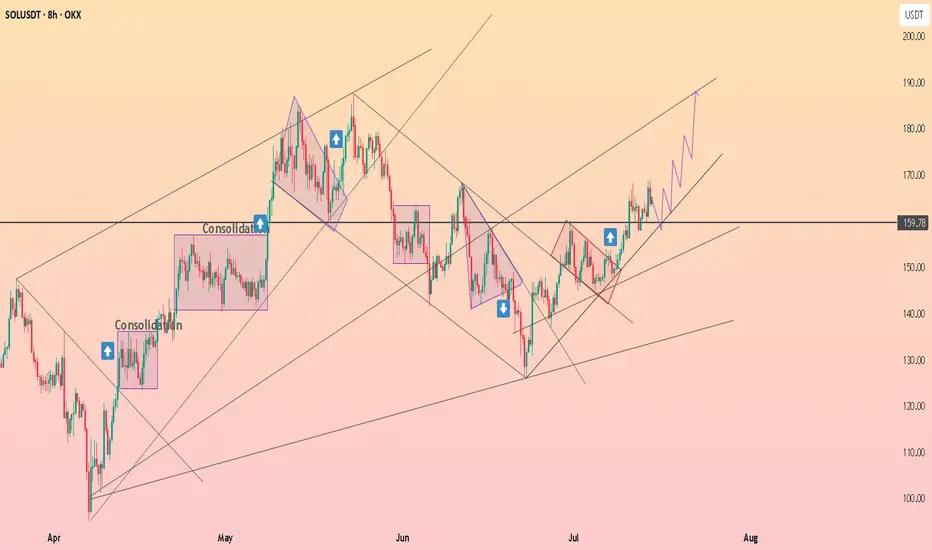
HolderStat┆SOLUSD above the $160 levelBINANCE:SOLUSDT has cleared key resistance at $159.78 after a series of consolidation patterns. The breakout has followed through into an ascending channel aiming at $185. Price remains structurally bullish with higher lows and strong recovery setups.
#SOL Update #4 – July 15, 2025#SOL Update #4 – July 15, 2025
Solana’s latest impulsive move failed to close significantly higher than the previous one. In fact, they closed at nearly the same level, which raises the risk of a potential double top pattern.
Looking at the current 4-hour chart, Solana seems to be nearing the end of this move. If the $157 support level breaks, it would likely indicate a transition from a bullish to a bearish structure on the 4H timeframe. The first target in such a breakdown would be around $154. If the $154 support fails to hold, the second target would be near $149.
Volume currently appears quite low, and the presence of long upper wicks adds further risk. Given the current conditions, Solana looks quite risky, and I do not recommend any trading positions—either buy or sell—at this time.

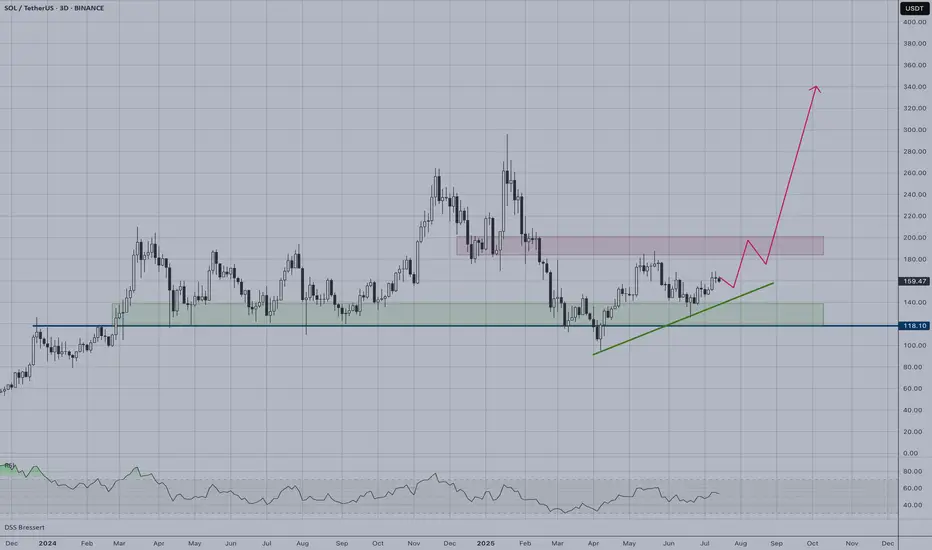
SOL | Relative UnderperformanceSOL is showing relative underperformance compared to the broader crypto market, but the technical picture suggests a potential reversal opportunity.
Current Setup:
Price recently bounced from the crucial support zone (green box) around $118-140
A clear ascending trendline has formed, indicating building momentum
Key Levels:
Support Zone: $118-140 (green box) - holding well
Resistance Zone: $190-200 (purple box) - next major hurdle
Breakout Target: $340+ based on the projected path
Technical Outlook:
The ascending trendline breakout combined with the support zone hold suggests SOL may be ready to catch up with market leaders. The relative underperformance could present a catch-up opportunity once it clears the resistance zone.
Risk Consideration:
A break below the green support zone would invalidate this bullish scenario and could lead to further weakness.
TradeCityPro | SOL Holds PRZ as Bulls Eye Range Breakout👋 Welcome to TradeCity Pro!
In this analysis, I want to review the SOL coin for you. This is one of the popular Layer1 projects, nicknamed the “Ethereum killer,” with a market cap of $85 billion, currently ranked 6 on CoinMarketCap.
📅 Weekly timeframe
In the weekly timeframe, after the bankruptcy news related to FTX, this coin had a very sharp bearish move and even dropped to as low as 9.84, but it managed to recover afterward.
⭐ From the key top at 27.62, a very strong bullish move started, reaching up to 255.96 and retesting its previous ATH.
📊 Currently, a range box has formed between the 128.66 and 255.96 levels, where the bottom of this box is a very strong PRZ, created from the overlap of a major support zone and the area between the 0.236 and 0.382 Fibonacci levels.
🔍 Also, the price is being supported by the SMA99, which has supported the price twice so far and has prevented the box from breaking to the downside.
⚡️ If you have already bought SOL, you can set your stop-loss if the price closes below this area. A confirmed breakdown could lead to deep corrections toward lower Fibonacci levels.
🛒 For buying this coin, the first trigger is the break of 178.22, which is a bit riskier but offers a good price entry. On the other hand, if the price revisits 128.66 and gives confirmation, we can enter from there.
📈 However, the main trigger for spot entry is the breakout of the 255.96 top. Breaking this level can unlock some very ambitious targets. If that happens, I’ll definitely update the analysis and provide those targets.
📅 Daily timeframe
In this timeframe, we can see the price action in more detail. A small range box has formed between 144.11 and 164.74, and the price is currently stuck below the top of the box and reacting to it.
✨ If 164.74 breaks, we can enter a long position. The next major resistance is 183.54. A breakout above that will serve as the main confirmation for a long position targeting 255.96, which can also be used as a spot trigger.
💥 The RSI oscillator is now above the 50 zone, and if it enters the Overbuy area, it will serve as strong momentum confirmation for this position.
✅ If the price gets rejected from the top, we can also open short positions on lower timeframes. A break below 144.11 will be the main short trigger.
📝 Final Thoughts
This analysis reflects our opinions and is not financial advice.
Share your thoughts in the comments, and don’t forget to share this analysis with your friends! ❤️

SOL Swing long - MTF ConfluencePositioning for a swing long entry on SOL based on alignment across Weekly, Daily, and 4H.
Weekly structure is bullish with clean HL-HH sequence. Stochastic RSI still rising = potential momentum continuation.
Daily structure remains bullish with HL-HH and is valid unless price closes below 146.5. Volume profile shows POC around 152.2.
On the 4H there´s a clear volume cluster around my entry, confirming heavy accumulation and interest. EMA 100 & 200 on 4H sits right beneath = dynamic support.
Trade Setup (SOL limit long order)
Entry: 153.6 (within OB & FVG)
SL: 146.5 (below OB & invalidation level)
Targets:
TP1: 164.90 → +1.59R (50% out, move SL to BE)
TP2: 179.00 → +3.58R (30% out)
TP3: 215.00 → +8.65R (20% runner)
DISCLAIMER: I am not providing trading signals or financial advice. The information shared here is solely for my own documentation and to demonstrate my trading journey. By openly sharing my process, I aim to put pressure on myself to stay focused and continually improve as a trader. If you choose to act on any of this information, you do so at your own risk, and I will not be held responsible for any outcomes. Please conduct your own research and make informed decisions.

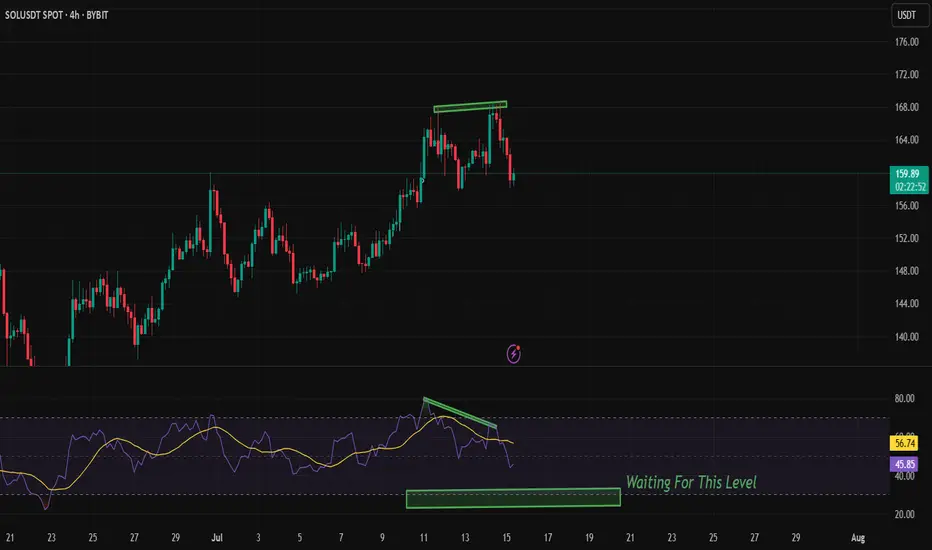
Bearish RSI Divergence on SOLUSDT (4H) – Patience Over FOMO!
🚨 Observing a clear Bearish RSI Divergence on the 4H chart for $BYBIT:SOLUSDT.
While the price made a higher high, the RSI showed a lower high, indicating weakening bullish momentum.
🟣 RSI is now trending down and currently around 46.
💡 I'm waiting for RSI to approach the 30 level (oversold zone) before considering a long entry.
🎯 No rush to buy — I prefer to wait for confirmation and a better risk-reward zone.
📅 Timeframe: 4H
📍 Plan: Waiting for RSI near 30
✅ Staying disciplined and avoiding emotional entries.
🧠 Let the setup come to you. Don’t chase the market.
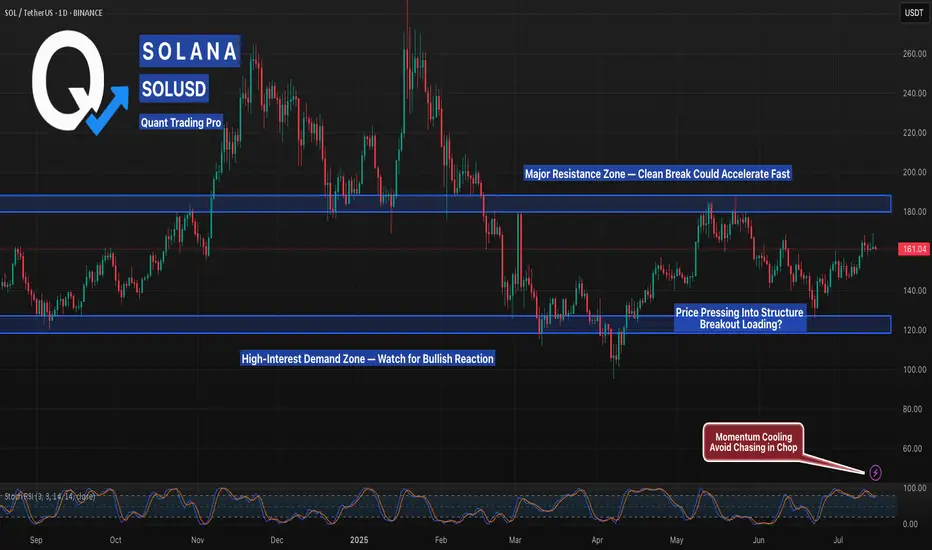
Solana Coiling Beneath Resistance — A Breakout Could Get ViolentSolana is pressing against the upper bounds of its multi-month range, with price tightening just beneath key resistance near $180. This level has historically triggered strong sell-offs, but the rising structure from June suggests bullish pressure is building.
Momentum is elevated, but not overheated — a clean breakout above the range high could trigger a rapid move toward $200+. If rejected, eyes shift back to the $140–$120 demand zone. This is a high-stakes zone — breakout traders should be ready.
Weekly trading plan for SolanaLast week, BINANCE:SOLUSDT price followed our bullish scenario after breaking out from the ABCDE triangle. We’ve now hit all projected targets, with current trading around $165. However, the 4-hour RSI is showing divergence, suggesting potential near-term correction or consolidation. Full analysis in the video idea
Trade safe and stay adaptive

#SOL/USDT Loves THIS Pattern | BULLISH#SOL
The price is moving within a descending channel on the 1-hour frame, adhering well to it, and is on its way to breaking strongly upwards and retesting it.
We have a bounce from the lower boundary of the descending channel. This support is at 143.
We have a downtrend on the RSI indicator that is about to break and retest, supporting the upside.
There is a major support area in green at 142, which represents a strong basis for the upside.
Don't forget a simple thing: ease and capital.
When you reach the first target, save some money and then change your stop-loss order to an entry order.
For inquiries, please leave a comment.
We have a trend to hold above the moving average of 100.
Entry price: 149.
First target: 153.
Second target: 156.
Third target: 159.
Don't forget a simple thing: ease and capital.
When you reach the first target, save some money and then change your stop-loss order to an entry order.
For inquiries, please leave a comment.
Thank you.
