SOL/USDTHello, I hope you are well. I left you the analysis of Solana. Tell me your opinion. I saw that it is bullish and it may reach the target I set. If the white area breaks, we can buy again and go up.
SOLUSDT trade ideas

Solana is the futuremany new and upcoming projects are using Sol to launch the meme coins and platform sol is user friendly that you can literally make $100 000 from $10 and good marketing buying solana now is like buying Bitcoin 10 years Ago

SOLANA - Light it up
SOLANA can flip the $185 resistance into support, it opens the door for a potential rally toward the next key levels:
T1: $241
T2: $301
T3: $371
T4: $468
The structure is clean, and the market sentiment is shifting. As long as SOL holds above the reclaimed range and macro conditions remain supportive, this setup could deliver serious upside.

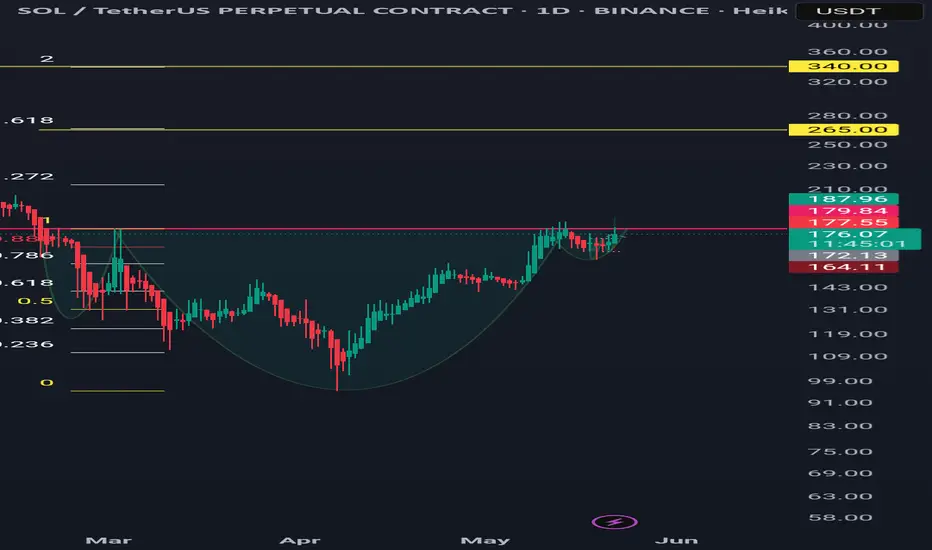
Solusdt daily time frame bullish cup and handle/iH&S patternSOLUSDT is forming a bullish pattern: a cup and handle or inverse head and shoulders. If it closes above 180 in the daily timeframe, the pattern may activate.
Targets are 265 and 340.
The pattern is invalidated if it closes below 159 in the daily timeframe, assuming it didn't break the previous low before the breakout.
Entry is from the neckline down to the low of the right shoulder, or whatever risk-reward ratio you are comfortable with.
#SOL/USDT#SOL
The price is moving within a descending channel on the 1-hour frame and is expected to break and continue upward.
We have a trend to stabilize above the 100 moving average once again.
We have a downtrend on the RSI indicator that supports the upward move with a breakout.
We have a support area at the lower limit of the channel at 166, which acts as strong support from which the price can rebound.
Entry price: 172.
First target: 176.
Second target: 181.
Third target: 186.

Greed: The Silent Killer Behind Your LiquidationsWhen the market turns green, everyone feels like a genius... But why do most traders lose the most money exactly at that point?
Is it your greed tricking you, or is the market designed to trap emotions?
In this analysis, we take a deep dive into how greed shapes your decisions — plus tools to help you stay rational before placing any trade.
Hello✌
Spend 3 minutes ⏰ reading this educational material.
🎯 Analytical Insight on Solana:
SOL, a market leader and one of my top picks, is currently consolidating near the critical psychological level of $200. Given its historical momentum and influence over correlated assets, a clean break above this level could trigger a minimum 14% upside, with $200 as the immediate target . Market sentiment remains cautious, but the setup hints at a potential bullish continuation 🚀.
Now , let's dive into the educational section,
💥 Where Does Greed Actually Start?
Greed often wears the mask of motivation. The difference? Motivation is rooted in analysis. Greed is rooted in fantasy.
When a coin suddenly pumps 150%, the noise on social media explodes — and so do your imagined gains… often before you've even checked the 4H chart.
📊 TradingView Tools to Spot Greed Traps
TradingView isn't just about pretty charts — it's a powerful platform to organize your trading mindset, if you know how to use it right. Here are three practical tools to help you identify whether your next trade is based on logic — or just plain hype:
Fear & Greed Index:
A composite indicator showing the market's emotional state using volume, volatility, and other metrics. Readings above 70? You’re probably in a greed zone.
Volume Profile Visible Range (VPVR):
This shows where real money has flowed. If you’re buying in a price zone with historically low volume, you might be walking into a fake breakout.
Relative Strength Index (RSI) with 2 or 7 Settings:
A hyper-reactive RSI setting helps you catch emotional peaks in smaller timeframes. Above 80? Time to breathe, not buy.
Pro tip : Build a self-check list on your chart. Questions like: “Am I acting on impulse?” or “Is this revenge trading?” can save you from emotional trades.
🔁 Repeating Behaviors That Kill Accounts
Entering with high leverage and no stop-loss
Buying into massive green candles
Copying trades without personal analysis
Switching strategies based on emotions
Trading just to recover past losses (aka revenge trading)
These are not strategy flaws — they are emotional traps caused by unchecked greed.
🧘♂️ How to Calm Your Mind Before Trading
Ask yourself: "If this trade flips against me, what's my move?"
Use TradingView Alerts instead of staring at charts for hours
Define risk per trade as a percentage, not based on "gut feeling"
Always have an exit plan — the market doesn’t care about your hopes
📉 Is Liquidation Always a Sign of Bad Analysis?
Not always. Often, the chart was right, but greed kept the trader from exiting at the logical spot. Tools told you to get out — but your mind said, “What if it goes higher?”
🧭 How Greed Shows Up in Different Timeframes
In 5-minute charts, greed looks like sudden spikes. In 4H charts, it can be a fakeout or deceptive pullback.
Recognizing the form greed takes in your preferred timeframe is a game-changer.
🧲 How to Use Greed to Your Advantage
Yes — you can flip the script. When everyone is entering trades driven by greed, you can prepare to exit.
If RSI is high, volume is weak, and hype is everywhere — maybe it’s time to cash out, not load up .
💡Closing Note
Greed exists in every market — but that doesn’t mean you have to follow it.
Start treating your chart like a mirror — not a crystal ball. When a trade feels “too perfect,” stop and reflect. It might not be your edge talking — it might be your greed .
always conduct your own research before making investment decisions. That being said, please take note of the disclaimer section at the bottom of each post for further details 📜✅.
Give me some energy !!
✨We invest countless hours researching opportunities and crafting valuable ideas. Your support means the world to us! If you have any questions, feel free to drop them in the comment box.
Cheers, Mad Whale. 🐋


HolderStat┆SOLUSD retesting the supportCRYPTOCAP:SOL has ridden a well-behaved growth channel since early April. After rejection at 180 USDT, price tests the channel spine around 165, which also marks the April breakout node. Defend it and the upper rail near 195-200 beckons; lose 160 and eyes shift to the lower boundary close to 150.

Give me some energy !!!The SOL will increase $150 and reach to the top of the wedge in the coming weeks .
Give me some energy !!
✨We spend hours finding potential opportunities and writing useful ideas, we would be happy if you support us.
Best regards CobraVanguard.💚


SOL/USDT DAILY CANDLESOL/USDT
A bullish trend of daily candles has been ongoing for 13 candles and will end if 5 bearish candles form when the 13 candles are fulfilled.

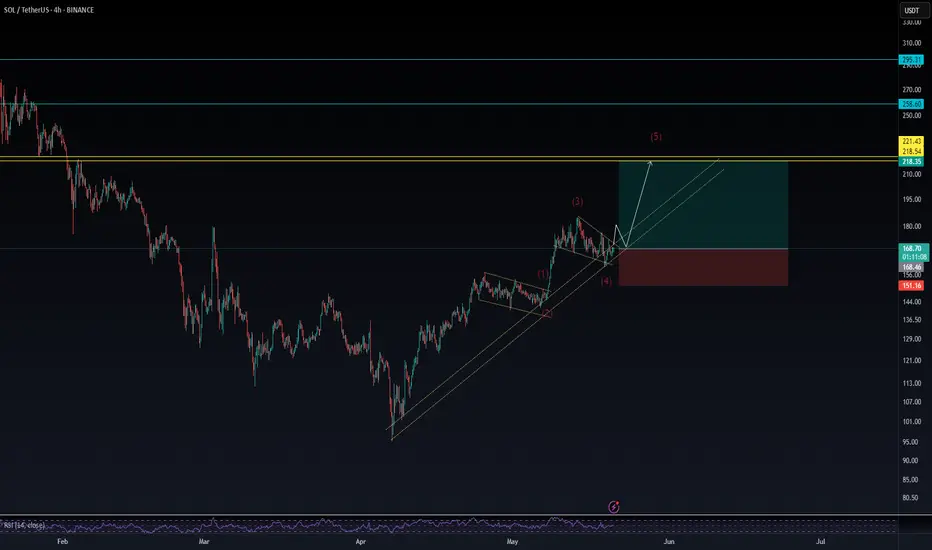
Sol/usdt📊 SOL/USDT Technical Analysis – Daily & 4H Timeframes
After a significant drop from its recent highs, Solana appears to be in a corrective phase. In both the daily and 4-hour charts, price action has formed a short-term bullish structure, indicating buying strength.
📈 Currently, SOL is trading within a rising wedge pattern. A breakout from the wedge could lead to a continuation of the upward move toward the $218–$221 zone, which aligns with the 0.618 Fibonacci retracement and is near the R3 Pivot Point—a key technical confluence zone.
🎯 Trade Plan:
✅ Phase 1 Entry: Initiating a position at current levels with proper risk management.
✅ Phase 2 Entry: Adding on confirmation of wedge breakout.
❌ Stop-loss: Placed below Wave 4 at $151
📌 This analysis reflects my personal trading idea and is shared for educational purposes only. Please manage your own risk accordingly.
SOL Trade Blueprint: Waiting for the High-Conviction EntryAfter printing a SFP at the key high of $180.52 followed by a sharp -8% rejection, SOL made a second attempt to breach the major resistance zone between $180–$185 — but once again, bulls fell short. Since then, price has been in a corrective phase. So the big question is: where’s the next high-probability trade setup? Let’s zoom out and break it down.
📏 Zooming Out: Structure, FVG & Fib Confluence
Back on May 8th, SOL broke through the April 25th swing high at $157 with strong momentum, leaving behind an untested Fair Value Gap (FVG) — a key displacement area that’s yet to be filled. When we draw the Fibonacci retracement from the low of that move to the current high, the 0.618 retracement lands precisely at $157.34 — right on the old breakout high. That’s a beautiful confluence.
Timing-wise, if SOL pulls back to that level between May 21–22, the 0.75 Fib speed fan also kicks in — adding dynamic trendline support to the static Fib level.
📉 What About the $164 Golden Pocket?
There's a golden pocket forming around $164 from a recent mini-impulse, and while it may look tempting, context matters. This pocket isn't supported by enough confluence — no major structure, volume shelf, or EMA alignment. For a quick scalp? Yes. But for a high-conviction swing? It's not ideal.
Remember, in trading we're not here to chase every candle — we're here to wait for the setups that stack the most reasons to say yes.
📍 The Zone to Watch: $157
Now let’s talk about that $157 zone — and why it’s standing out as the highest-probability long setup:
0.618 Fib retracement of the major impulse
Retest of the breakout swing high
Untested Fair Value Gap (FVG)
233 EMA + 233 SMA on the 4H timeframe lining up as dynamic support
1.5 outer pitchfork support line crossing through
1:1 trend-based Fib extension confluence
Prior area of interest
This is what we call a “stacked setup.” The more layers of confluence, the more conviction we have in the trade. Add to that the potential for a liquidity sweep (SFP) just below the current low at $159.44 — and it becomes a zone worth watching closely.
🎯 Long Setup:
Entry: $157–$159.44 (watch for SFP confirmation)
Stop-Loss: Below $154
Target: $200
R:R: Approx. 1:12 — a setup worth being patient for
🧠 Educational Note: Why Confluence Is King
High-probability trades don’t come from guessing. They come from stacking confluence: structure, Fibonacci, moving averages, time-based levels, pitchforks, VWAPs, volume profiles — the more that lines up, the less you need to hope and the more you can trust your edge. Think like a sniper, not a machine gun.
The market rewards patience and precision — not noise and FOMO.
🔻 Short Setup (Alternative Play)
While we’re primarily bullish, there’s a valid short opportunity at the psychological $200 mark — but only if price shows clear rejection and confirmation (e.g. SFP, bearish engulfing, high volume reversal).
Entry: $200 rejection
Stop-Loss: Above $205
Target: $185–$180
R:R: Approx. 1:3+
🔥 Final Words: Trade With Purpose
This is what trading is about — not chasing green candles, but waiting for structure, clarity, and alignment. Whether you’re trading long or short, focus on high-conviction setups backed by logic and levels, not emotion.
Don’t trade for action. Trade for precision. The market will always reward the patient ones who are willing to wait for that clean entry, stacked with reasons to act.
Trust the process, stay disciplined, and let the charts do the talking. 💪📈
___________________________________
If you found this helpful, leave a like and comment below! Got requests for the next technical analysis? Let me know.

SOL LONGSolana is bouncing off the Fibonacci retracement 0.382 level. The bullish trend to 173.12 is expected to continue

Exposing Price Inefficiencies: The Role of Fair Value Gaps (FVG)In the ever-evolving landscape of price action trading, one concept has gained significant traction among institutional and retail traders alike: Fair Value Gaps (FVGs) . At Xuantify, we believe that understanding market inefficiencies is key to anticipating high-probability setups—and FVGs offer just that.
🔍 What Is a Fair Value Gap?
A Fair Value Gap is a price imbalance that occurs when the market moves too quickly in one direction, leaving behind a "gap" in liquidity. This typically happens during high volatility or news-driven events, where price skips over levels without sufficient buying or selling.
In technical terms, an FVG is identified when a candle’s low (in a bullish move) or high (in a bearish move) does not overlap with the previous or next candle. This creates a three-candle structure :
- Bullish FVG : Candle 1 (bearish), Candle 2 (strong bullish), Candle 3 (bullish or neutral)
- Bearish FVG : Candle 1 (bullish), Candle 2 (strong bearish), Candle 3 (bearish or neutral)
These gaps often act as magnets for price , as the market seeks to rebalance and fill the inefficiency.
🧠 Why Do FVGs Matter?
FVGs are not just visual anomalies—they represent institutional footprints . When large orders are executed, they often cause price to move rapidly, leaving behind unfilled orders. Smart money tends to revisit these zones to complete their positions.
Key Benefits of Trading FVGs:
- ✅ High-probability entries: Price often returns to fill the gap before continuing its trend.
- ✅ Clear invalidation levels: The edges of the gap provide natural stop-loss zones.
- ✅ Works across timeframes: From scalping on the 1-minute to swing trading on the daily.
🧩 Using the “Fair Value Gap ” Indicator
To simplify the process of identifying and trading FVGs, we recommend the Fair Value Gap indicator on TradingView. This tool automatically highlights bullish and bearish FVGs, tracks their mitigation, and even provides alerts when gaps are filled.
Key Features:
- Auto-detection of bullish and bearish FVGs
- Mitigation tracking: See which gaps are filled and which remain open
- Threshold filtering: Focus on significant gaps by adjusting the minimum size
- Dynamic mode: Monitor evolving FVGs in real time
- Alerts: Get notified when price fills a gap
💡 No Repainting, No Delays
One of the most reassuring aspects of this indicator is that it does not repaint . Once a fair value gap is printed, it stays on the chart—no disappearing zones, no misleading signals.
Even better, the indicator plots FVGs in real time . It uses a three-candle structure and confirms the gap immediately after the third candle closes . This means you’re seeing valid, actionable gaps as they form—not in hindsight.
This makes the LuxAlgo FVG tool a reliable companion for both live trading and backtesting , giving traders the confidence that what they see is what the market actually delivered.
How to Use It:
1. Add the indicator : Search for “Fair Value Gap ” in the TradingView Indicators tab.
2. Adjust settings :
- Use the “Threshold %” to filter out smaller, less relevant gaps.
- Enable “Mitigation Levels” to track filled gaps.
- Use “Auto Threshold” for adaptive filtering based on volatility.
3. Trade setups :
- Contrarian : Wait for price to fill a gap and look for reversal signals.
- Trend-following : Enter trades in the direction of the gap when it forms.
⚠️ FVGs Are Not Always Honored
While FVGs offer powerful insight into market inefficiencies, it's important to remember: they are not guaranteed reversal or continuation zones . Sometimes price will blow right through a gap without reacting—especially in trending or news-driven markets.
Why this happens:
The gap may have already been mitigated on a lower timeframe
Strong momentum or macroeconomic catalysts override technical zones
The FVG is too small or lacks confluence with other key levels
How to manage this:
Always combine FVGs with structure, liquidity, and volume
Use alerts and confirmations (e.g., candle patterns or BOS/CHOCH)
Avoid trading FVGs in isolation—context is everything
🧠 Best Indicator Combinations with FVG
To increase the accuracy of FVG-based setups, we recommend combining the LuxAlgo FVG indicator with the following tools:
1. Market Structure (LuxAlgo Smart Money Concepts)
Identify breaks of structure (BOS) or change of character (CHOCH) near FVGs. Use structure shifts to confirm whether the FVG is likely to hold or fail.
2. Volume Profile or Session Volume
Confirm FVGs with low-volume nodes or volume gaps . FVGs aligning with volume imbalances are more likely to be respected.
3. Order Blocks
Look for FVGs that overlap with bullish or bearish order blocks . This confluence often signals institutional accumulation or distribution.
4. Relative Strength Index (RSI) or Stochastic
Use momentum indicators to confirm exhaustion or continuation near FVGs. For example, a bullish FVG + oversold RSI = potential long setup.
5. Liquidity Zones (Equal Highs/Lows, Swing Points)
FVGs near liquidity pools are often targeted before reversal. Combine with sweep setups for sniper entries.
Here’s a new section you can add to your blog post, focusing on the power of **Multi-Timeframe (MTF) FVG Alignments**:
🧭 Multi-Timeframe FVG Alignments
One of the most powerful ways to increase the reliability of Fair Value Gaps is by using multi-timeframe confluence . When FVGs align across different timeframes—say, a 1H FVG inside a 4H FVG zone—it often signals a high-probability reaction area .
Why it works:
Higher timeframe FVGs represent broader institutional imbalances
Lower timeframe FVGs offer precise entries within those zones
Alignment confirms that multiple layers of market participants are active in the same area
How to use it:
Start with a higher timeframe (e.g., 4H or Daily) and mark key FVGs
Drop to a lower timeframe (e.g., 15M or 1H) and look for fresh FVGs forming inside the higher zone
Wait for structure shifts or liquidity sweeps within the lower timeframe FVG before entering
This technique is especially effective when combined with tools like LuxAlgo Smart Money Concepts and Volume Profile , helping you time entries with sniper-like precision while staying aligned with the broader market narrative.
📊 Backtest It Yourself
FVGs are best understood through chart time . Load up your favorite pair on TradingView, activate the LuxAlgo FVG indicator, and observe how price reacts. You’ll be surprised how often these zones act as support, resistance, or launchpads for major moves.
🚀 Final Thoughts
Fair Value Gaps are more than just a buzzword—they’re a window into how smart money operates. By incorporating FVGs and tools like the LuxAlgo indicator , you gain a deeper understanding of market dynamics and a sharper edge in execution.
At Xuantify, we’re committed to decoding institutional logic and bringing it to the retail trader. Stay tuned for more insights, and as always— trade smart, not hard .


SOL range low sweep before chasing HIGHSWe continue to see the liquidity grow at the $180 price range but leveraged long traders are pouring into this chart.
My idea for SOL for the next few days is going to be a continuation to ~$150’s and an extremely manipulative move to the upside.
Invalidation is a break/retest/continue of the down trend on the daily

SOL/USDT – Bearish Setup DevelopingSolana has broken its dynamic support and is currently in a pullback toward the broken support zone on the 4H timeframe.
This move confirms weakness, and we're watching closely for rejection signals to validate the short setup.
As long as the broken structure holds, the bias remains bearish.
🧠 Stay patient — let price complete the pullback before reacting.


sol sell midterm"🌟 Welcome to Golden Candle! 🌟
We're a team of 📈 passionate traders 📉 who love sharing our 🔍 technical analysis insights 🔎 with the TradingView community. 🌎
Our goal is to provide 💡 valuable perspectives 💡 on market trends and patterns, but 🚫 please note that our analyses are not intended as buy or sell recommendations. 🚫
Instead, they reflect our own 💭 personal attitudes and thoughts. 💭
Follow along and 📚 learn 📚 from our analyses! 📊💡"

HolderStat┆SOLUSD 165 retest could launch 195-200CRYPTOCAP:SOL escaped a falling channel in April and has since respected a well-behaved growing channel. After tagging 180 USDT resistance, price is backing into the channel heart around 170 with potential for a classic 165 support retest. A bounce there would position bulls to challenge the 180 lid again and potentially sprint toward the channel extension at 195-200 USDT. Breakdown below 160 would mark the first technical warning of fatigue.

#SOL/USDT#SOL
The price is moving within a descending channel on the 1-hour frame, adhering well to it, and is heading for a strong breakout and retest.
We are seeing a rebound from the lower boundary of the descending channel, which is support at 158.
We have a downtrend on the RSI indicator that is about to be broken and retested, supporting the upward trend.
We are looking for stability above the 100 moving average.
Entry price: 161.70
First target: 164
Second target: 168
Third target: 173

SOLANA 14Months AccumulationSOLANA had a rally from $20 to $190 , and now for 14 Months is accumulating above the strong support at $100.
As the RSI ON Monthly is playing inside a falling channel, upside movement for SOL in the coming months to about $600 is very likely IMO.
