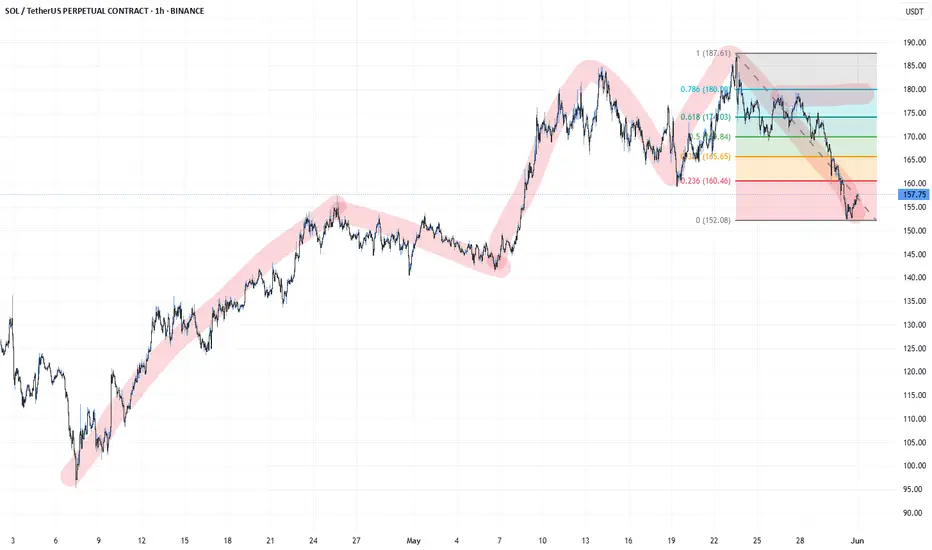
Wedge broken > Short expected until support zoneHello Folks.
As you can see, the descending channel has been broken, There is world where we can expect a short until the next support zone. It can fall even until 138 USD (realistic). Depending on how BTC will react this week end after official macro releases.
Trade with caution.
Regards
SOLUSDT trade ideas

HA-RSI + Stochastic Ribbon: The Hidden Gem for Trend & MomentumNavigating volatile markets requires more than just raw price action. The Heikin Ashi RSI Oscillator blends the power of smoothed candlesticks with momentum insights to give traders a clearer picture of trend strength and reversals.
At Xuantify , we use the Heikin Ashi RSI Oscillator as a hybrid momentum and trend tool. While the indicator calculations are based on Heikin Ashi values to smooth out noise and better capture trend dynamics, the chart itself displays standard candlesticks (real price data) . This ensures that all signals are aligned with actual market structure, making it easier to execute trades with confidence and clarity.
This dual-layer approach gives us the best of both worlds: clarity from smoothing and precision from real price action. MEXC:SOLUSDT.P
🧠 How We Use It at Xuantify
At Xuantify , we integrate the Heikin Ashi RSI Oscillator into our multi-layered strategy framework. It acts as a trend confirmation filter and a momentum divergence detector , helping us avoid false breakouts and time entries with greater precision. We pair it with volume and volatility metrics to validate signals and reduce noise. Note the Stochastic Ribbon Overlay as shown in the chart, very accurate for momentum.
⭐ Key Features
Heikin Ashi Smoothing : Filters out market noise for clearer trend visualization.
RSI-Based Oscillation : Measures momentum shifts with precision.
Color-Coded Bars : Instantly identify bullish/bearish momentum.
Dynamic Signal Zones : Customizable overbought/oversold thresholds.
Stochastic Ribbon Overlay : A powerful multi-line stochastic system that enhances momentum analysis and trend continuation signals.
💡 Benefits Compared to Other Indicators
Less Whipsaw : Heikin Ashi smoothing reduces false signals common in traditional RSI.
Dual Insight : Combines trend and momentum in one visual.
Better Divergence Detection : Easier to spot hidden and regular divergences.
Visual Simplicity : Clean, intuitive design for faster decision-making.
⚙️ Settings That Matter
RSI Length : Default is 14, but we often test 10 or 21 for different timeframes.
Smoothing Type : EMA vs. SMA – EMA reacts faster, SMA is smoother.
Overbought/Oversold Levels : 70/30 is standard, but 80/20 can reduce noise in trending markets.
📊 Enhancing Signal Accuracy
Combine with Volume Oscillators to confirm momentum strength.
Use Price Action Zones to validate oscillator signals.
Look for Divergences between price and oscillator for early reversal clues.
🧩 Best Combinations with This Indicator
MACD : For cross-confirmation of momentum shifts.
Bollinger Bands : To identify volatility squeezes and breakouts.
Support/Resistance Levels : For contextual trade entries and exits.
⚠️ What to Watch Out For
Lag in Strong Trends : Like all smoothed indicators, it may react slightly late.
Over-Optimization : Avoid curve-fitting settings to past data.
Standalone Use : Best used in conjunction with other tools, not in isolation.
🚀 Final Thoughts
The Heikin Ashi RSI Oscillator is a powerful hybrid tool that simplifies complex market behavior into actionable insights. At Xuantify, it’s a core part of our strategy toolkit, helping us stay ahead of the curve with clarity and confidence.
🔔 Follow us for more educational insights and strategy breakdowns!
We regularly share deep dives into indicators, trading psychology, and backtested strategies. Stay tuned and level up your trading game with us!

SOL - Prev Resistance to become support?SOL - Prev Resistance to become support?
SOL is bullish orange! If support stands, it will be good! Will re-enter on Green trend change!

Sol{
"name": "SOLUSDT 1H Trade Watchlist",
"created_at": "2025-06-01T15:13:40.499874",
"symbol": "BINANCE:SOLUSDT",
"timeframe": "1H",
"strategies": [
{
"type": "long",
"title": "Breakout Buy Above Resistance",
"conditions": ,
"entry": "Above 154.50",
"take_profit": ,
"stop_loss": "151.90",
"notes": "Confirmation with bullish candle & RSI strength"
},
{
"type": "short",
"title": "Breakdown Sell Below Support",
"conditions": ,
"entry": "Below 152.00",
"take_profit": ,
"stop_loss": "154.30",
"notes": "Watch for momentum continuation and bearish confirmation"
}
]
}

SOL(targeting breakdown) — Eyes on BreakerThe market structure suggests further downside, with no bullish trigger in sight yet.
Setup:
🔻 Primary Target: $130–140 zone
This area aligns with the weekly breaker, a key HTF support level for potential bounce. Until then — no reason to long.
🟥 Rejection Zone: $156–160
Monthly open + FVGs. Strong rejection confirms bear control.
🟩 Major Support: $122–123
If breakdown continues, this is the final HTF defense.
Plan:
• Expect continued bleed or spike into breaker at $130–140
• Swing short play from rejection, monitoring PA into breaker for reaction
📌 Let the flush play out. Best setups come at higher timeframe supports — not mid-trend.


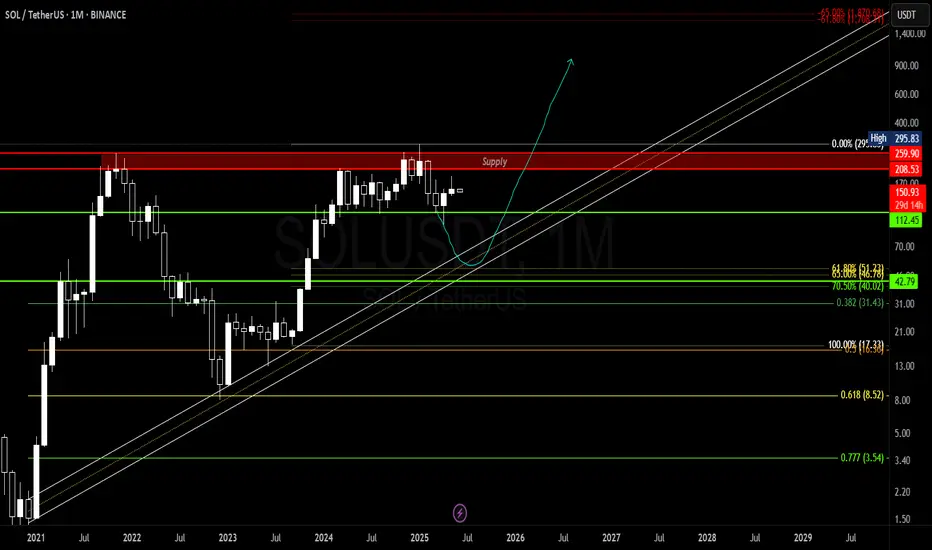
Solana UpdateStill leaning towards this old idea i had posted last year
we have taken good amount of liquidity on the upside already will be better if we take the lower side as well.
invalid once we start flowing above red zone, till then i am buyer for anything under 3 digits :)
SOL - Is it good for buys?SOL really looks good at the multiple points mentioned, Looks good for longs at the point marked!!

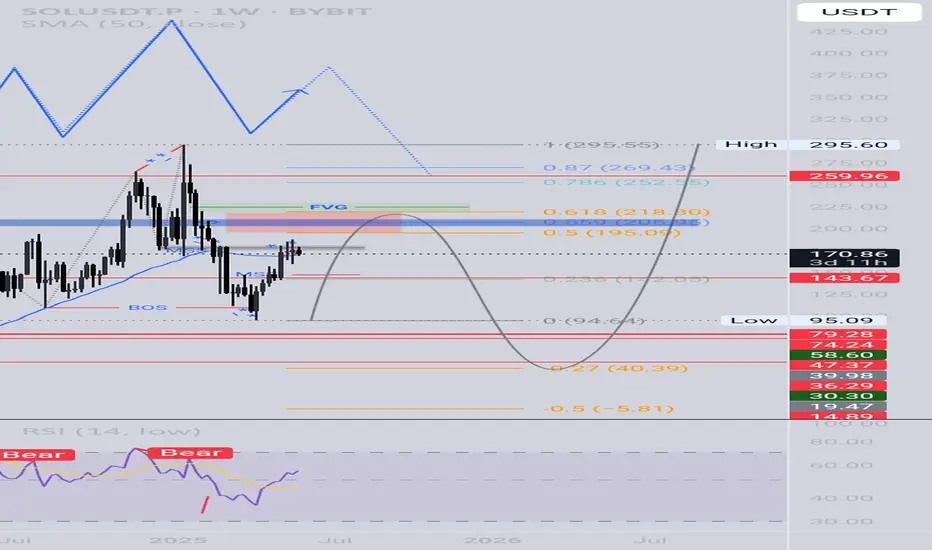
SOL - BOS ExpectationThe rising structure of the market signals deterioration. We will try to catch a short transaction both above fibo 50 and in the region corresponding to the liquidity zone.
Double Top Alert: SOLUSDT Setup Screams ReversalYello Paradisers, will you act like a pro and prepare for the next clean short opportunity on #SOLUSDT, or will you fall for the same breakout trap again just before the market punishes greed?
💎#SOLUSDT is displaying a textbook double top formation just under a well-respected resistance zone. This kind of structure is no joke—it’s a consistent precursor to sharp downside when liquidity gets taken from retail longs who are too eager to buy high. The market rarely gives second chances. What you’re looking at now is one of them.
💎Price has printed a double top around the $185 to $188 region. That zone has repeatedly acted as a ceiling, and buyers have failed to maintain any strength above it. The lack of follow-through is a major sign of exhaustion, especially after the second tap failed to even test the previous high with conviction.
💎Instead of breaking out, SOLUSDT has rolled over and is now struggling under the $176.23 minor resistance. That weakness is already being confirmed on lower timeframes. As long as this area holds as resistance, there is no justification for any probable aggressive long setups. This is a market preparing to punish overleveraged traders.
💎There’s a clear invalidation for this setup, and it’s extremely important to stick to it. Any 4H candle closing above $190.18 would break this structure and force us to step back and reassess the setup. Until that happens, the current bearish thesis remains firmly in play.
💎The nearest support sits at $168.86 which has highest probability that price may visit there. This level may act as a brief pause, but if the selling intensifies, it will likely break. A confirmed move below that level opens the door toward the true target of this breakdown, which is the $153.95 major support zone. That’s where we’ll be watching for a real reaction.
💎The current structure is heavily skewed toward the downside. Bears are clearly in control below $176.23, and the market has shown no signs of reclaiming key levels that would shift that control back to the bulls. Any bounce should be treated as corrective unless proven otherwise by a structural shift.
Strive for consistency, not quick profits, Paradisers. Treat the market as a businessman, not as a gambler. If you master that mindset, you’ll already be far ahead of the crowd.
MyCryptoParadise
iFeel the success🌴

Short trade
Entry: Day TF
Trade Type: Sell-side Trade — SOL/USDT
Date: Friday, May 30, 2025
Time: 4:36 PM — London Session PM
Observed Timeframe: 15min
Entry: 163.099
Take Profit (TP): 147.229 (−9.73%)
Stop Loss (SL): 164.373 (+0.78%)
Risk-Reward Ratio (RR): 12.46
Entry Rationale: The entry at 163.099 was based on a confirmed breakdown below a key support level, signalling potential for further downside movement. The take profit level at 147.229 was determined based on the next significant support zone, aligning with a previous consolidation area.

Solana (SOL) Rectangle (4H)BINANCE:SOLUSDT appears to be forming a rectangle, clearly visible on the 4H chart.
Key Levels to Watch
• $160: Support
• $185: Resistance
Measured Targets
Activated, respectively, with a 4H close with good volume below support or above resistance.
• $135: Rectangle Short Target
• $210: Rectangle Long Target

SOLANASolana (SOL) Current Bias, Dollar Relationship, and Bitcoin Correlation
1. Solana’s Current Bias
Bearish Pressure: SOL is trading near $160, down ~5% in 24 hours due to token unlocks, declining memecoin activity, and technical resistance at $187 .
Key support levels: $158–$163 (50-day EMA) and $140–$142 (critical demand zone). A drop below $142 risks a deeper correction to $133 .
Medium/Long-Term (2025–2026):
Bullish Outlook: Analysts project SOL could reach $275–$500+ by late 2025, driven by institutional interest, ETF approval prospects, and network upgrades .
2. Relationship with the Dollar Index (DXY)
Inverse Correlation: A stronger dollar (DXY↑) typically pressures SOL and crypto markets. Recent DXY surges have coincided with SOL’s 30% decline .
Current DXY Context: Testing 98.4 (May 2025). A breakout above 101.99 could further weaken SOL, while a drop below 97.92 may revive bullish momentum .
Fed Policy Impact: Expected rate cuts in 2025 could weaken the dollar, indirectly supporting SOL’s recovery .
3. Solana vs. Bitcoin (SOL/BTC)
Mixed Performance:
30-Day Trend: SOL is up 10.98% against BTC, reflecting relative strength in altcoin markets .
Recent Dip: SOL/BTC fell 5.75% in 24 hours to 0.001524 BTC, signaling short-term BTC dominance .
Key Levels:
Resistance: 0.001633 BTC (May 24 high).
Support: 0.001524 BTC (current level); breakdown risks a test of 0.0014 BTC .
Summary Table
Factor Solana (SOL)
Price (USD) ~$160 (down 5% in 24h)
DXY Correlation Inverse (stronger USD = weaker SOL)
BTC Correlation Mixed (recent gains vs. BTC, but short-term dip)
Key Support $158–$163 (EMA), $140–$142 (demand zone)
Key Resistance $187, $220, $243
2025 Bullish Target $275–$500 (institutional forecasts)
Critical Factors to Watch
Fed Policy: Rate cuts could weaken DXY, boosting SOL.
ETF Developments: Approval odds for SOL ETFs may drive institutional inflows .
Technical Breaks: A daily close above $183 could reignite bullish momentum toward $200–$210 .
Network Activity: Declining memecoin trading volumes and MEV concerns pose short-term risks .
Conclusion
Short-Term: SOL faces bearish pressure from DXY strength and technical resistance, but the $140–$158 zone is critical for maintaining bullish structure.
Long-Term: Bullish institutional forecasts and potential ETF catalysts support a $275–$500+ trajectory by late 2025.
Bitcoin Influence: SOL’s recent outperformance against BTC may resume if altcoin markets rebound, but BTC dominance remains a headwind.
Traders should monitor DXY trends, Fed rhetoric, and SOL/BTC technical levels for directional cues.
#SOL #CRYPTO #BITCOIN

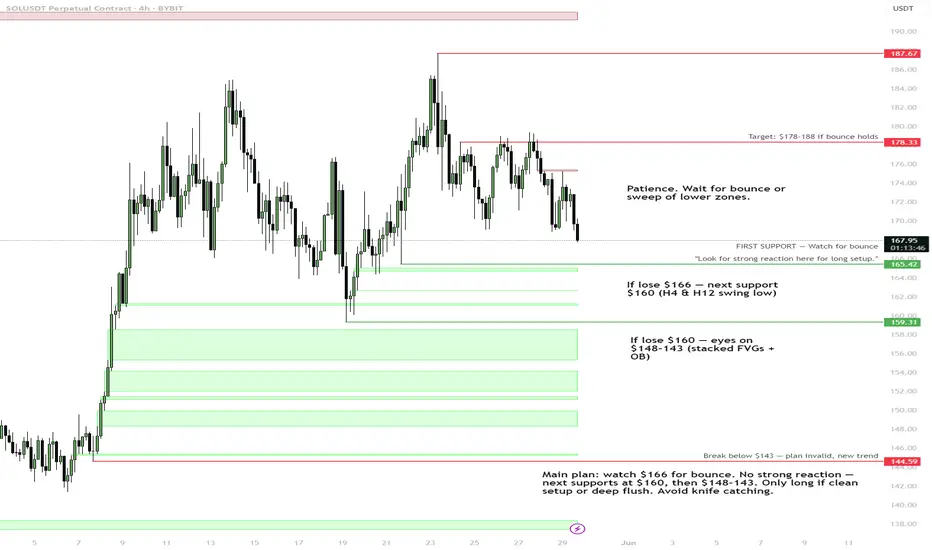
$SOL | 4h - 12h Wait for bounce or sweep of lower zonesKey support at $166 — watching for bounce.
If bulls fail, next stops $160 and $148–143.
Break below $143 — trend flips, bulls done.
No bounce, no entry. Let price come to the plan.
SOL/USDT"Solana, like the other two coins, is also poised for growth and is currently in the best possible position. What do you think, my friend? Do you think Solana can go up?


SOL pullback before HTF Demand LevelsSOL to continue its uptrend needs to pullback to HTF Demand levels.
H4 or H12 Demand Zones.
Right now we are forming liquidity on a ewave 4 and possibly going to sweep that liquidity up forming a wave 5 before the push down looking for that HTF level.

SOL – High Confluence Bullish Zone ($149.7–$143)SOL is approaching a high-confluence bullish zone between $149.7 and $143, where multiple technical factors align. This area marks a key weekly order block, overlapping with bullish harmonic pattern completion levels, suggesting potential for a reversal or continuation of the broader uptrend. Additionally, the Fixed Range Volume Profile shows significant historical volume activity in this region, indicating strong interest from buyers. A daily trendline also converges at this level, adding further technical support. This stacked confluence makes the zone a high-probability area to watch for a bullish reaction or entry setup.


That's why SOL will continue to OUTPERFORM ETHIn this cycle, SOL has been significantly stronger than the second cryptocurrency. It literally rose from the ashes, giving dozens of Xs when no one believed in it.
It even began to compete for the title of best blockchain. But will it be able to maintain this hype and continue the trend? Let's find out!
The current rebound across the crypto market has been accompanied by low trading volumes. But SOL, unlike others, has not experienced such a strong divergence in volumes during its growth. This indicates stable demand.
Metrics and indicators:
DMF - shows the movement of capital in the asset. Here we see that over the last three MONTHS, new liquidity has continued to flow into SOL. Neither ETH nor even BTC have seen such a trend.
DSRZ - we see that there is a strong support zone below us, currently even stronger than at the 120 level! This indicates interest in the token even at such prices.
DLD - liquidity depth shows that there is currently almost twice as much liquidity at the top. And as we know, the price moves towards the highest liquidity.
Conclusion:
However, there is currently a GAP across the entire market, and SOL is no exception. Unlike other tokens, however, it has only one small GAP. At levels 148-167.
Therefore, we may see a small local correction. In addition, of all the liquidity from below, the largest layer is located almost directly beneath us. A huge number of traders with leverage. Which cannot fail to attract attention.
It may already be starting to fill in right now. Personally, I see the first good opportunity for trading or buying on the spot market as being right at the end of this zone, somewhere around 148-150.

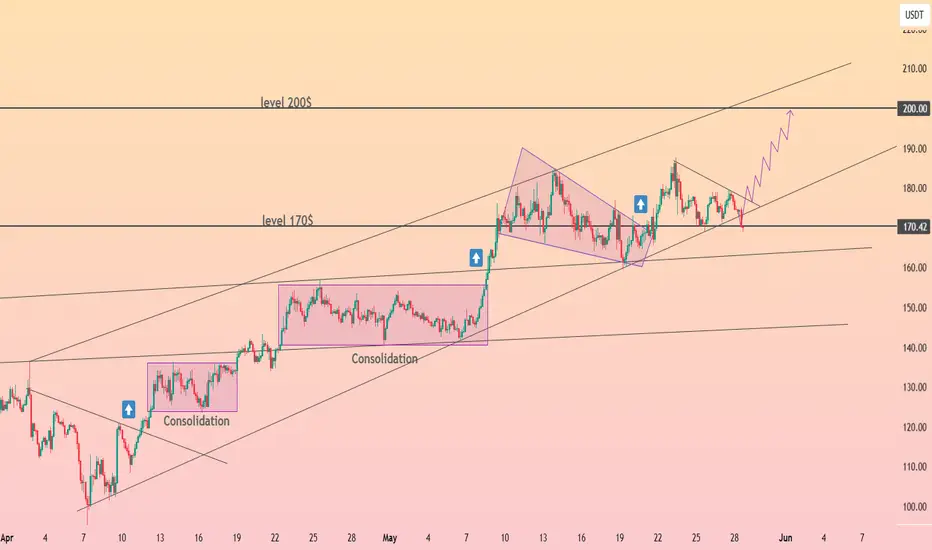
HolderStat┆SOLUSDCRYPTOCAP:SOL price radar: Solana escaped dual consolidations and now oscillates between 170 and 200 inside an ascending channel. Bulls defend trend-line support as a tightening wedge eyes 200. Chart structure and price analysis favor further upside momentum.
SOL in higher timeframe,could be a BIG SHORT?Seen this pattern a HnS pattern for Solana.Why this pattern has a big possibility to materialize? There's a market structure shift after the liquidity (the ATH),plus confirmed by a break of structure on its major swing low.Possible we are now on it's corrective move targeting the golden zone area.Another confluence is,there is a gap(green box) above the golden zone and it's a sign of inefficiency.But this could invalidate my short idea if there will be a candle close above this gap(green box).
Solana 8X Lev. Full PREMIUM Trade-Numbers (PP: 1088%)Good morning my fellow Cryptocurrency trader, I wanted to give you one more high profits potential, high probability, high certainty, great entry and timing, leveraged-trade.
The Altcoins market is about to go wild and this chart setup can be a life changer if approached with the right planning and mindset, if approached in the right away.
» SOLANA —SOLUSDT
I'll let you take care of the rest.
Full trade-numbers below:
____
LONG SOLUSDT
Leverage: 8X
Entry levels:
1) $182
2) $175
3) $165
Targets:
1) $195
2) $220
3) $253
4) $296
5) $343
6) $372
7) $420
Stop-loss:
Close weekly below $160
Potential profits: 1088%
Capital allocation: 5%
____
Thank you for reading.
If you enjoy the charts, numbers and content, consider a follow.
Namaste.
