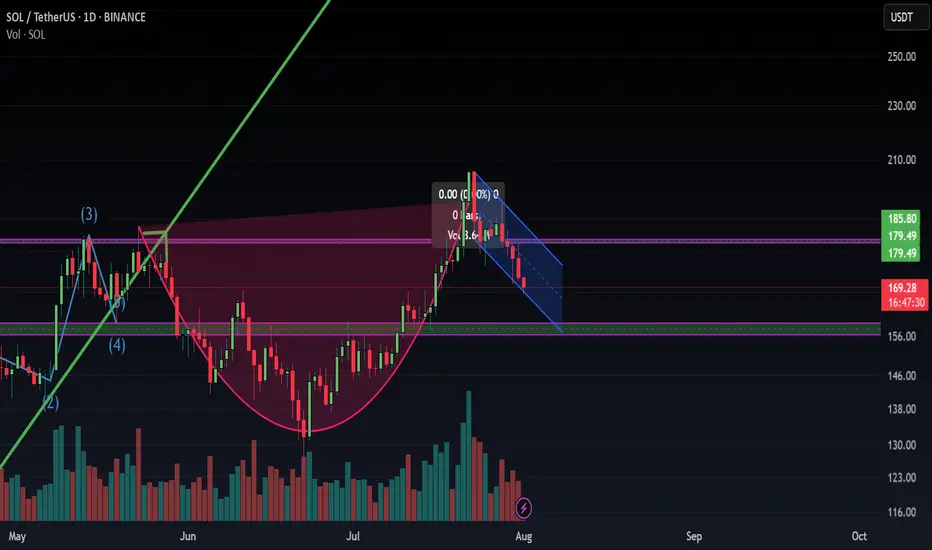
this is familier patternis this a cup of tea pattern? i see a cup and handle this is a sign of bullish in next week
SOLUSDT trade ideas
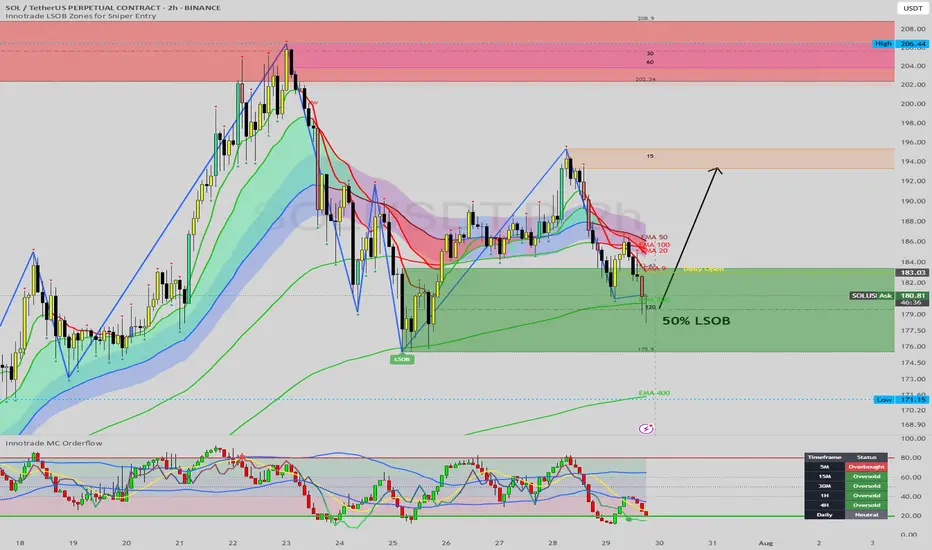
SOL Taps Major Demand: A High-Confluence Long Setup at EMA 200Hello, traders.
Today we are examining Solana (SOL), which has just pulled back into a technically significant area of interest after a strong rejection from the $206 highs. While the recent drop has been sharp, it has brought the price into a major demand zone that aligns perfectly with key long-term support levels.
This analysis provides a step-by-step breakdown of the confluent technical factors suggesting that the current level offers a high-probability opportunity for a bullish reversal and the continuation of the primary uptrend.
The Analysis: Stacking the Bullish Confluences
A robust trading idea is formed when multiple, independent technical signals align. On this 2-hour chart for SOL, we have a powerful convergence of factors:
1. Primary Market Structure (Uptrend Intact):
First and foremost, the context is bullish. The Zig-Zag indicator clearly shows a well-defined uptrend with a series of higher highs and higher lows. The current price action, while corrective, is still holding above the previous major low. As long as this structure holds, our bias should be to buy the dips in anticipation of the next leg up.
2. The Institutional Demand Zone (LSOB):
Price has now entered the large green LSOB (Liquidity Sweep Order Block), a critical zone spanning from roughly $175.5 to $183. These zones represent areas where significant buying interest and institutional order flow previously entered the market. The price has wicked directly into this demand zone, indicating a reaction from buyers.
3. Dynamic Support Confluence (The EMA 200):
Adding immense strength to this demand zone is the EMA 200, which is flowing directly through the middle of the LSOB. The EMA 200 is a widely respected long-term moving average that often acts as powerful, dynamic support in an uptrend. The fact that price has respected this level almost to the dollar is a strong confirmation of its significance.
4. Multi-Timeframe Momentum Exhaustion:
This is perhaps the most compelling timing signal. Our MC Orderflow oscillator is deep in the green "Oversold" territory, indicating that selling pressure on this timeframe is exhausted.
More importantly, the Dashboard reveals that this condition is widespread. The 15M, 30M, 1H, and 4H timeframes are all simultaneously flashing "Oversold." This cross-timeframe alignment of momentum exhaustion is a powerful signal that the corrective move is likely nearing its end.
5. Fibonacci Time Cycle:
A small but significant detail is the Fibonacci Time Cycle icon (the lightning bolt) that appeared near the recent low. These cycles can often mark key turning points in time, suggesting that the market is chronologically primed for a potential pivot.
The Potential Trade Plan
Based on this powerful stack of confluences, here is a potential trade plan:
Entry Zone: The current LSOB / EMA 200 area, from $179 to $181, represents a strong zone for entries.
Stop Loss: A logical stop loss can be placed just below the LSOB and the recent swing low, around $174.50. A break of this level would invalidate the bullish structure.
Potential Targets:
Target 1: A reclaim of the Daily Open at 186
Target 2: The intermediate supply zone and recent swing high around $194 - $196.
Target 3: A full retest of the major high at $206.
Conclusion
We have a textbook example of technical confluence: a pullback to a major LSOB demand zone that aligns perfectly with the long-term EMA 200, all while multi-timeframe momentum indicators show clear seller exhaustion at a potential time-based turning point. This presents a compelling, high-probability case for a long position on Solana.
Disclaimer:
This analysis is for educational purposes only and does not constitute financial or investment advice. Trading involves a high level of risk. Always conduct your own thorough research and consult with a licensed financial advisor before making any trading decisions.
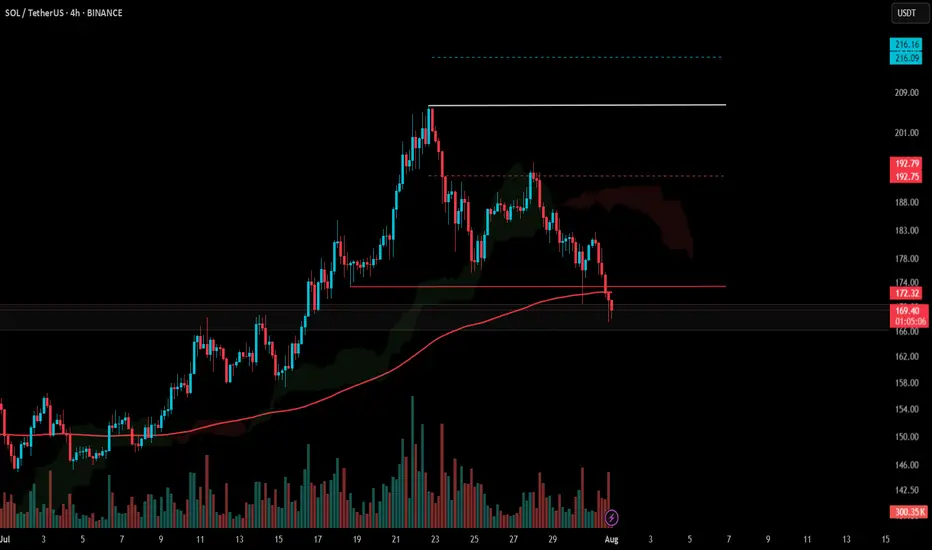
SOLANA'S GOLDEN CROSSSolana just printed a golden cross on the daily chart, with the 50-day moving average crossing above the 200-day. That’s usually a bullish sign, but here’s the kicker – price is sitting right at the crossover point, which is when these signals actually matter. That said, it is hard to tell if both MAs are support or resistance until the day closes.
Instead of running higher, SOL is hovering in no man’s land, stuck between two big levels: resistance around $187 and support near $140. After a nasty pullback from the $200s, price bounced at the moving average cluster, but hasn’t done much since. If bulls step in and push us back toward $170+, the golden cross could play out nicely. But if we drop below $155, it starts to look like just another fakeout. Either way, the next move should be telling.

SOLANASolana showing a great bounce and strong buy back with an active escalation. Expecting to hit $200 and above this days. IMHO.
NFA - DYOR

SOL SHORT : SHORT TERM REVERSALLooks like price reversal at the $200 resistance underway. Failed to close above .
Price retracing back to the lower channel support near 0.618 fib . Target next long positions with entries around $155

SOLUSD broke the 0.5 fib level is likely to go down SOLUSD yesterday broke the O.5 Fib level and price may further go down to trendline support from where price may get reverse.
SOLUSDT 1D - Bulls back in control with Golden Cross and channelOn the daily chart, SOLUSDT is forming a bullish continuation structure. After the Golden Cross (MA50 crossing MA200), the price is now pulling back toward the midline of the ascending channel and the 0.5 Fibonacci level at 166.38. This confluence with the broken trendline and 200 EMA makes this zone a prime technical area of interest.
Support: 166.38 (0.5 Fibo), EMA200 (161.77), broken trendline
Resistance: 182.84–189.67 (Fibo 0.705–0.79), 206.54, target - 255.93 (Fibo 1.618)
This retracement looks healthy, supported by higher volume during the prior bullish leg. As long as the 166.38–161.77 zone holds, continuation toward 206.54 and potentially 255.93 is on the table.
Fundamentally, Solana remains a key L1 narrative with strong traction in DePIN and AI-linked dApps. The rising TVL and investor sentiment support the trend.
Watch price action around 166 for confirmation - this is the battleground.

SOL - Support Broke, Is This Just a Retest Before The Pump?Solana just lost a key structural level on the 4H chart — the former range high (~163–166), which had acted as resistance throughout June and flipped to support in mid-July. Price is now sitting just below this zone, forming a weak retest without any real bullish momentum.
This setup often leads to trap scenarios: either a fast reclaim (bullish deviation) or a clean continuation to the next demand. So far, the price is holding below the EMAs and failing to reclaim lost ground — not a bullish look.
📌 Confluence for Further Downside:
Break and close below prior support
EMA 50/100 acting as dynamic resistance
No bullish divergence present (if RSI confirms)
Weak volume on current bounce attempt
If sellers stay in control, eyes are on the next demand zone around 144–146, which supported the last major breakout. Conversely, a clean reclaim above 166 and back inside the range would flip bias neutral-to-bullish.
Bias: Bearish unless 166 is reclaimed
Invalidation: Break above 177–180 (EMA cluster)
Next Key Support: 144–146
Potential Setup: Short on failed retest / Long on demand reaction
Do you see this as a breakdown or a trap? Let me know 👇
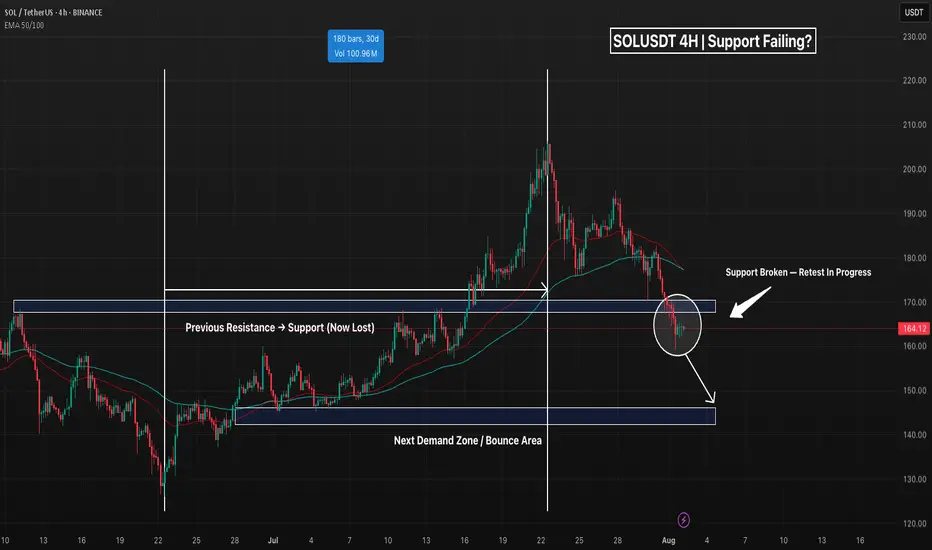
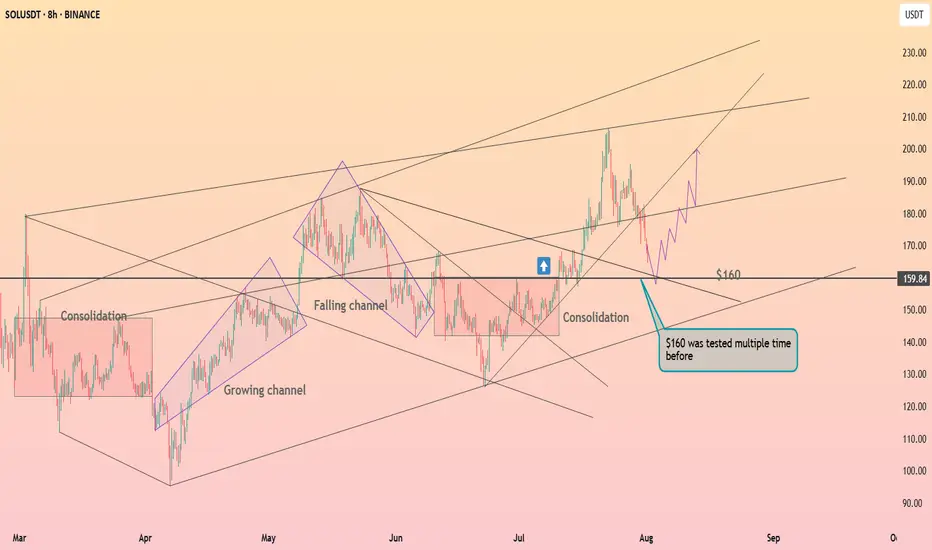
Solana above the $160 level ┆ HolderStatBINANCE:SOLUSDT is retracing toward the $160 support after failing to hold above $190. Price previously broke out from a falling channel and may find support at $160 again, where multiple reversals have occurred. A bounce here could fuel a move to $200.
$SOL Loses Key Support | Eyes on $140 & $95 Zones📉 CRYPTOCAP:SOL Loses Key Support | Eyes on $140 & $95 Zones
🕵️♂️ On the daily timeframe, #Solana has officially lost its key support near $140, which previously acted as a strong bounce zone. A failure to reclaim this level could open the gates for a deeper drop toward the $95–$100 support range.
📊 Indicators signal downside:
RSI is trending downward
MACD shows a bearish crossover
Stochastic RSI confirms continued selling pressure
⚠️ Macro pressure adds fuel to the fire: August 1st tariff tensions, with expected news from Trump on charging Paris, are weighing down global risk assets. Historically, August tends to be a bearish month for crypto markets.
🎯 Key Levels to Watch:
Immediate Resistance: $140
Major Support: $95–$100
🧠 Trade wisely and manage risk accordingly.

SOLANA could have a major retracement Solana completed a major ABC correction into a supply zone on the higher time frame (HTF), taking out the previous quarter’s highs.
On the daily chart, the RSI is overbought and signals the potential for a significant retracement.
Price action on the 4-hour chart shows a series of lower highs, indicating a bearish trend. If Solana fails to break above the previous high and trigger a market structure shift, the downtrend is likely to continue, leading to a deeper retracement on the higher time frames.


SOLUSDT on Fire! Bullish Wedge Fuels INSANE Upside Potential!BINANCE:SOLUSDT has been exhibiting strong bullish momentum, currently trading within a broadening wedge pattern. This technical structure often signals increased volatility and the potential for decisive moves in either direction. In the present scenario, the breakout above the psychological $200 resistance level suggests that bulls are firmly in control, fueling hopes of further upside.
The continuation of momentum hints at the market preparing for another leg up. The immediate price target lies at $300, where traders may expect some profit-taking and resistance. However, should momentum sustain and buying pressure persist, BINANCE:SOLUSDT has the potential to surge toward the $700 region, aligning with the pattern’s projected price expansion.
As always, managing risk is key. Use a well-placed stop loss below the support level to protect your capital. Breakouts can be explosive, but discipline and proper risk management make all the difference.
BINANCE:SOLUSDT Currently trading at $201
Buy level : Above $200
Stop loss : Below $150
Target 1: $250
Target 2: $300
Target 3: $500
Target 4: $700
Max leverage 2x
Always keep stop loss
Follow Our Tradingview Account for More Technical Analysis Updates, | Like, Share and Comment Your thoughts

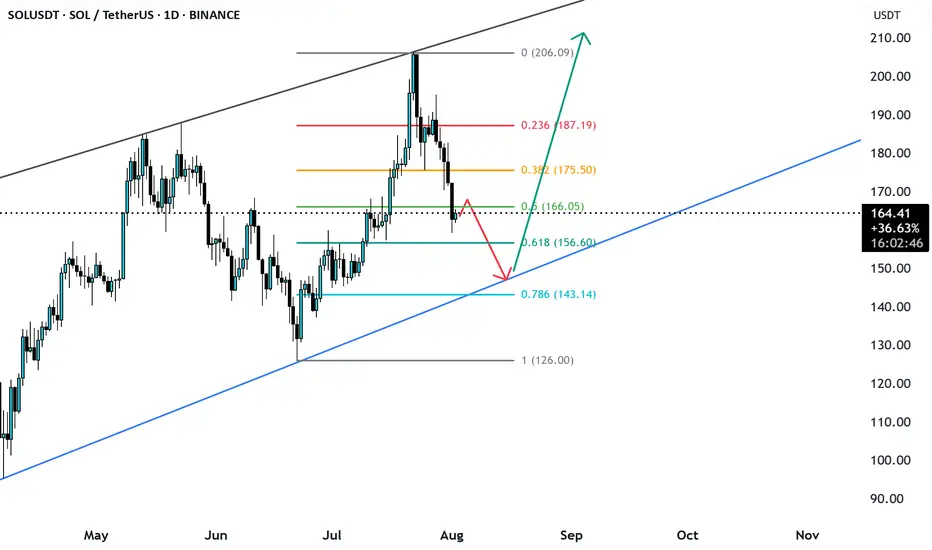
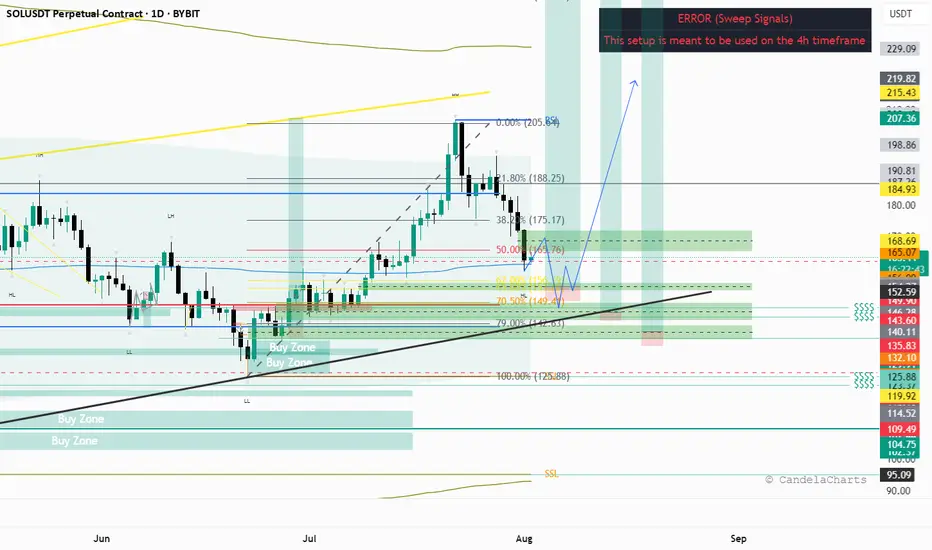
SOLUSDT- Golden Pocket Bounce: Bullish Phase or Another Fakeout?🔍 In-Depth Technical Analysis (1D Timeframe)
The SOL/USDT pair is currently showing a highly significant technical reaction as price bounces from the Fibonacci Retracement 0.5 - 0.618 zone (also known as the Golden Pocket), located between $166.63 - $157.13.
This level also aligns perfectly with a historical demand zone that has previously acted as a strong support during high-volume selloffs, creating a powerful confluence area.
---
🧩 Market Structure & Pattern
✅ Golden Pocket + Demand Zone: This overlap strengthens the probability of a valid bullish reversal.
🟠 Previous Movement: Price dropped from the recent swing high near $188 after failing to break through major resistance.
📉 Short-Term Downtrend: Currently in a corrective phase after an earlier bullish run.
---
🟢 Bullish Scenario (Rebound Confirmed from Golden Pocket)
If the price manages to hold above the $157 - $166 range and prints a bullish candle with volume confirmation:
1. A bullish breakout above $179 and more importantly $187.80 could open the door to further upside.
2. Potential midterm bullish targets:
🎯 Target 1: $205.69 (key psychological + structural level)
🎯 Target 2: $218.13 (previous reaction zone)
🎯 Target 3: $257.10
🎯 Target 4 (macro): $295.14
> The current zone offers an attractive risk-to-reward opportunity for swing traders, as long as the higher low structure is maintained.
---
🔴 Bearish Scenario (Breakdown from Key Support Zone)
Should the price break below $157 with strong selling volume:
1. That would invalidate the bullish setup and suggest a shift in structure.
2. Potential deeper correction targets include:
⚠️ Support 1: $140 (minor support from past structure)
⚠️ Support 2: $122 - $110 (major support zone from March–April 2025)
> A confirmed breakdown here would likely initiate a lower high – lower low structure, signaling a possible shift into a bearish medium-term trend.
---
📌 Additional Key Indicators to Watch
🔄 Volume Spike: Essential for validating any breakout or breakdown.
📉 Daily RSI: If RSI shows bullish divergence or bounces from oversold territory, that would strengthen the bullish case.
⏳ Daily Candle Close: Monitor the next 2–3 daily candle closes around this key zone for directional confirmation.
---
💡 Conclusion
SOL is at a crucial inflection point. The reaction around the $157 - $166 support confluence will likely determine the medium-term trend:
Bullish: If price reclaims $179–$188 zone with strong momentum
Bearish: If price breaks below $157 and closes with volume
This could be a high-reward opportunity for technical traders if confirmed properly.
---
🧠 Suggested Strategy:
🔹 Entry: Upon bullish confirmation in current demand zone
🔹 Stop Loss: Below $155 (for swing setups)
🔹 Take Profit Zones: $179 → $205 → $218 → $257+
#SOLUSDT #Solana #CryptoTechnicalAnalysis #FibonacciLevels #GoldenPocket #PriceAction #CryptoReversal #SwingTradeSetup #Altcoins #CryptoChart

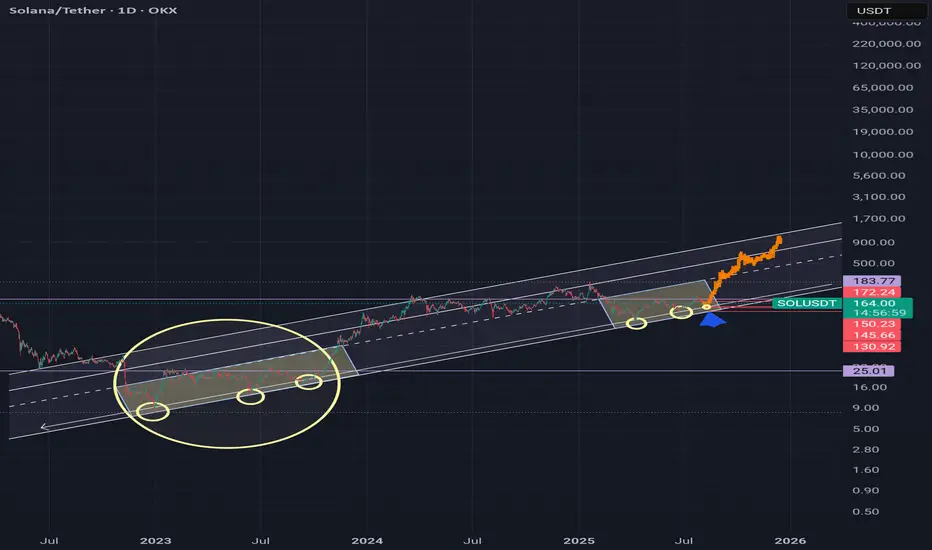
Longterm Uptrend still in a Process!Look at 3 contact below.
Currently price avout to put 3rd touch to lower zone of trend and it marks to $148-$151.
After that upside move will start to gain momentum in my opinion.
Macro view is still bullish roughly above $150.
SOL Sol next move idea.
Sol's final leg down before the final leg up for this bullrun. Fill the daily imbalances come to 70 % fib retracement level also a volume POC on a discount area below 50% of the dealing range and the daily trendline.
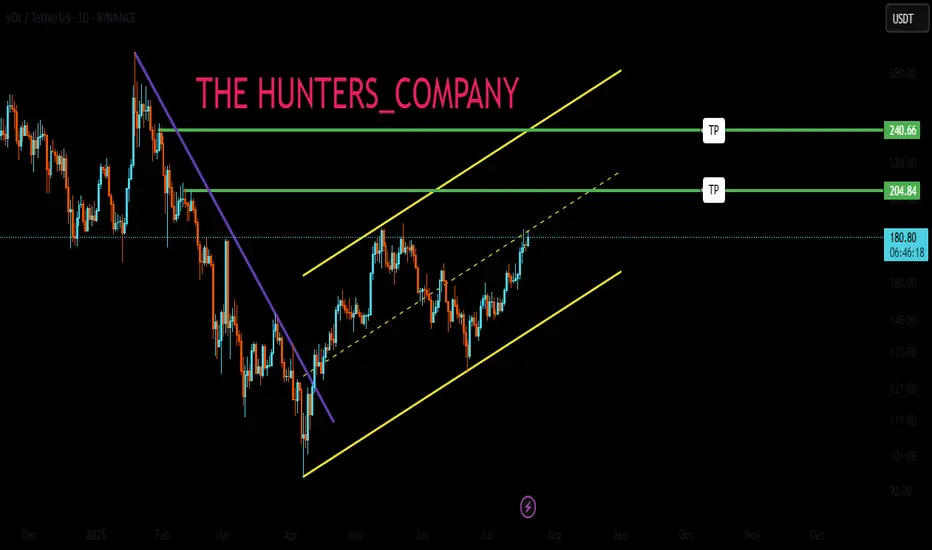
Long-Term Technical Outlook: Critical Decision Point Approaching
The chart illustrates a long-term technical structure where the price has been following an ascending channel after a prolonged bearish trend. However, recent price action indicates a breakdown below the green ascending trendline, raising concerns about a potential shift in market sentiment.
Currently, the $117 level is acting as a pivotal support zone. A sustained breakdown below this level — and more critically, below the red lower trendline — would validate the bearish scenario. This could trigger a deeper correction phase, with downside targets aligned along the red projection path. Such a move may lead to significantly lower price levels in the medium to long term.
🔽 Bearish Scenario:
If the price fails to hold above $117 and breaks below the red trendline, this would confirm the start of a bearish leg. Based on historical structure and projected trajectories, this could result in a descent toward the $93 level initially, with the possibility of extending further downward depending on market conditions.
🔼 Bullish Scenario:
On the other hand, if the price manages to reclaim the green trendline and more importantly, stabilize above the $204 resistance zone, it would signal renewed bullish strength. Such a move would open the path toward higher highs, potentially re-entering the previous upward channel and continuing the macro uptrend.
🧭 The price structure is now approaching a decisive zone, where either a confirmation of bearish continuation or a bullish recovery will likely unfold. Both scenarios have been visually outlined — green lines indicating bullish continuation, and red lines representing bearish momentum.
📌 Note: This analysis is for educational purposes only and should not be interpreted as financial advice.

#SOL Update #6 – Aug 01, 2025#SOL Update #6 – Aug 01, 2025
Unfortunately, Solana failed to hold the last low where its most recent impulsive move had started, and it closed below that level. This close also occurred below the MA200 band. In other words, Solana broke a very strong support on the 4-hour chart and moved downward, reaching the previous K-Level zone. It’s hard to say anything positive for Solana at this stage. If the current K-Level fails to hold, Solana may look for support around the $158 level. A long position on Solana is definitely not recommended. I also do not suggest a short position. However, unless there’s a strong reversal, it’s safe to say that Solana has entered a bearish phase on the 4-hour chart.
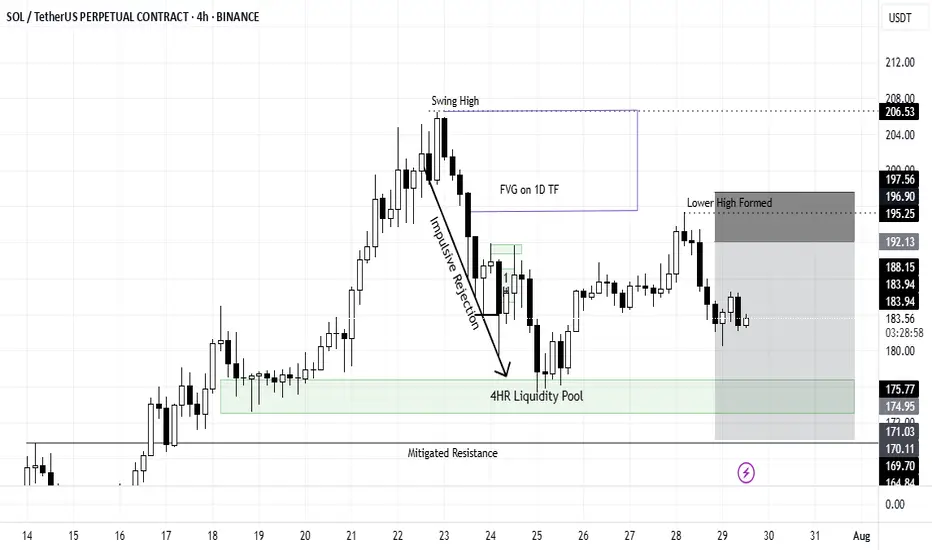
Mid Term SOL Short PlayOn the 4H timeframe, we can see SOL is currently facing resistance after breaking past $206.
It makes an impulsive move downward crating a Fair Value Gap visible on the Daily timeframe between 204.7 and 195.39.
It briefly touched the 4H Liquidity Pool before making an attempt to run up again.
However, the move got terminated at 195.25 forming a Lower High which is a signal of the downtrend.
Since it has not broken below 173.3 (Last swing low before breaking 206), it's still too early to call.
My mid term play would be to find entry between 191-193 and hold a short position to break below the FVG and bounce of the mitigated support.
Stop loss : 198
Target : 170
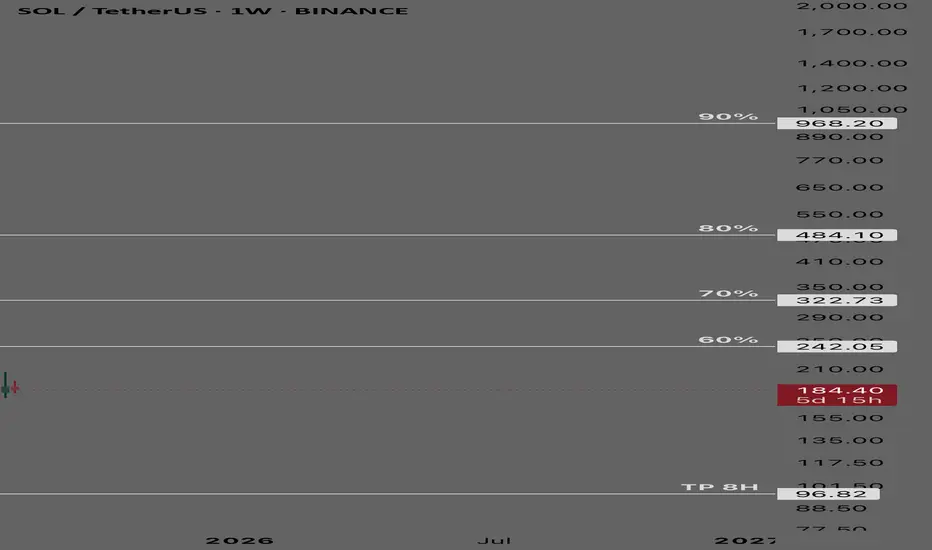
SOLUSDT - Long Term Sell Cycle SOLUSDT
long term sell cycle
TP at 96.82
% bubble ratio
Solana entered into a positive bubble with fair value at 96… cycle term is long
Spot Trading plan:
No entry ⛔️ in positive bubbles
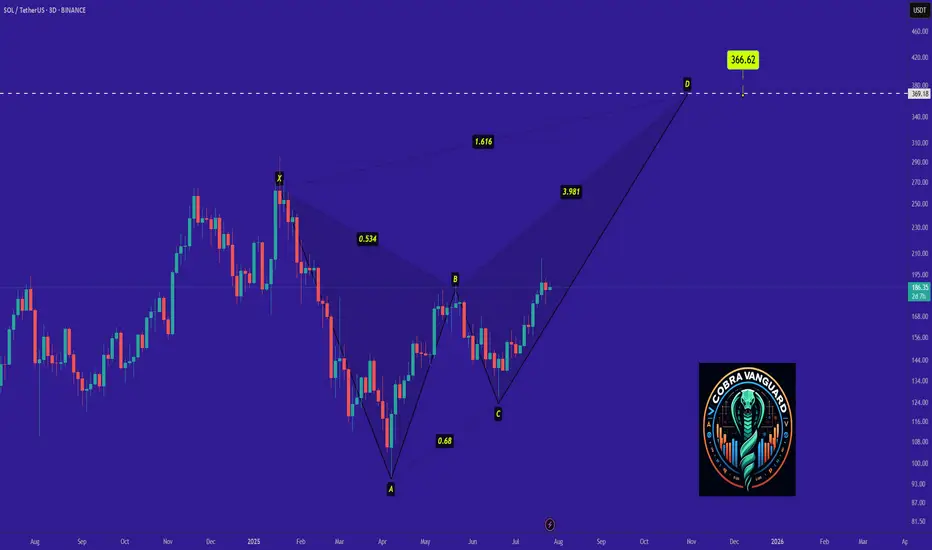
SOL - Time to buy again! (Update)Be careful with SOL !!!
we can hope that the price will act like a Crab pattern and the price will grow well.
I expect that the price will grow very quickly...
SOLANA UPDATEHello friends🙌
📉Given the decline we had, you can see that buyers came in and supported the price and were able to change the trend and create an ascending channel.
📈Now, considering that the price is hitting higher ceilings and floors, we can expect an ascending wave until the ceiling of the channel.
Don't forget risk and capital management.⚠
🔥Follow us for more signals🔥
*Trade safely with us*
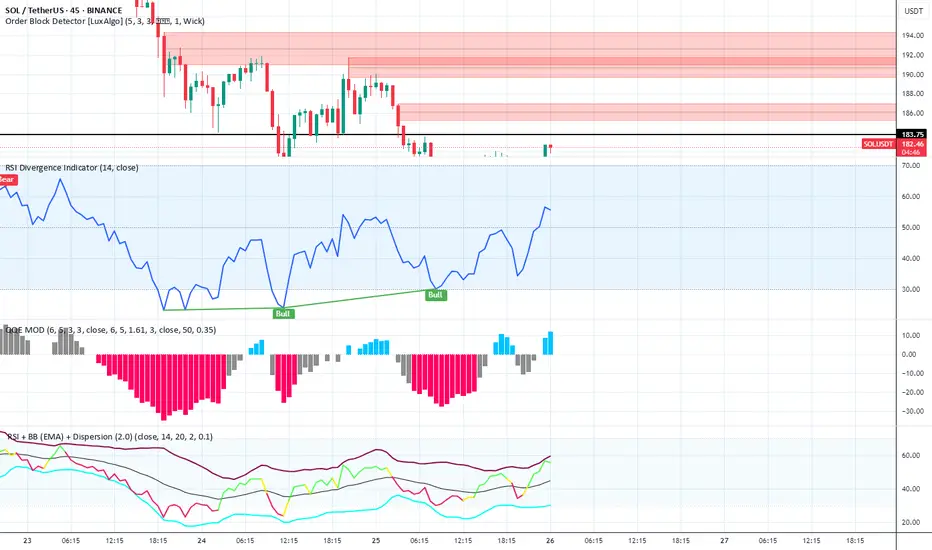
Vijay D - Smart Order Block + RSI Divergence Reversal SuiteIndicators Used in the Setup
Order Block Detector
Settings: (5, 3, 3), 1 Wick
Function: Highlights institutional order blocks to identify high-probability supply/demand zones.
Chart Insight: Multiple bearish order blocks marked in red between $186–$194, confirming strong overhead resistance. Price is reacting at the lower boundary (~$183.75), showing signs of rejection.
RSI Divergence Indicator (14)
Settings: 14-period RSI
Function: Detects bullish and bearish divergences between price and RSI.
Chart Insight: Bullish Divergence identified — price made a lower low while RSI made a higher low, signaling a potential trend reversal or bullish bounce.
QQE MOD
Settings: (6, 5, 3), Smoothing: 6.5, RSI Length: 14
Function: A momentum oscillator derived from RSI with smoothing and histogram representation.
Chart Insight:
Histogram flipped from red (bearish) to blue (bullish).
Bullish transition suggests increasing momentum in favor of bulls.
TSI – BB (EMA) + Dispersion
Function: Combines True Strength Index with Bollinger Band (EMA-based) and dispersion overlays.
Chart Insight:
TSI is rising toward midline with narrowing dispersion bands.
Indicates a potential volatility contraction before an expansion — likely upside if TSI crosses above signal.