SOLANA (SOL) – Bearish Breakdown Incoming? Watch These Key LevelHey Traders!
#SOL is currently showing strong bearish signals on the 2H timeframe:
🔸 Rising Wedge Pattern spotted — a classic bearish reversal structure.
🔸 Bearish Divergence on RSI — momentum is weakening while price continues higher.
🔸 Breakdown from the wedge already occurred — confirming the initial weakness.
Next Key Support Zone: $120–$130
This zone has held multiple times, but a clean break below followed by a retest could offer a high-probability short setup.
🎯 Trade Plan:
We’re watching for:
Break of the $120–$130 support
Retest of the broken level
Entry on confirmation with strict risk management
💬 What’s your take on #SOL? Are you bullish or bearish? Drop your thoughts below!
🧠 Trade smart, manage your risk, and follow for more TA like this!
📌 Like, comment, and share if you found this helpful.
#SOL #Solana #CryptoTrading #BearishDivergence #RisingWedge #TechnicalAnalysis #TradingSetup #ShortTrade #CryptoTA #Altcoins
SOLUSDT trade ideas

SOL?
Hi,
This asset passed earlier sell off. 145.500
Now trading 151.600
I need to be careful. 151.600 gap to 145.500 if Im buying now.
Due to bullishness in this crypto space recently. Further up n up likely,
Just be careful, reminder for myself.. to not be stuck at higher prices.
May wait for retraces.. 150.. if it wants
All the best
Not a guru

SOL/USDTInitially, there is a level, there is also a liquidity removal.. but I would like to show you the indicator that I came up with and prescribed and how it works. Thank you all so much!

SOL/USDT SOL currently testing support line of, as well as testing recent fair value gap. if your trade continue in solana then no need of close trade just update stop loss, for fresh the can start trade with
Target 01 : 164.00
Target 02 : 179.00
Stop loss : 133.00

SOL/USDTSOL/USDT looking good right now, it show divergence on daily time frame also break the down trendline with good volumes, currently react as the support line.
Need to break recent high for further confirmation

Solana (SOL/USD) Elliott Wave Update – Countertrend Rally in ProBINANCE:SOLUSDT
🟠 Current Elliott Wave Outlook
After completing Wave ③, Solana began a sharp correction. This is how the current structure unfolds:
The initial leg down unfolded as a clear (1)-(2)-(3)-(4)-(5) structure in black – forming the white Wave A of a larger A-B-C corrective pattern.
We are now in the corrective counter-move, forming Wave B.
🔄 Zooming into Wave B: Internal Progression
The early part of Wave B is unfolding as a small impulse:
→ Wave 1, 2, 3, 4 have already played out.
→ We are currently moving from Wave 4 into Wave 5, which is expected to complete the black (A) of white B.
The top of Wave (A) is already marked on the chart, coinciding with key Fibonacci Extension levels, which reinforce the probability of local exhaustion.
🟨 Next Structure – Building Wave (B) of B
After the black (A) completes, we expect a retracement wave (B).
This would then be followed by a yellow 1-2-3-4-5 impulse to the upside – forming the full structure of white Wave B.
📉 What Comes After B?
Once Wave B (in white) is complete (built from the black (A)-(B)-(C)), we anticipate another larger leg to the downside – white Wave C.
This would complete the full A-B-C correction from the macro top of Wave ③.
🎯 Key Zones to Watch:
Black Wave (A) Top = short-term resistance
Fibonacci Extension Area = likely exhaustion zone for the current rally
Wave B (white) = potential bearish trap before the real drop (Wave C)
✅ Summary
Solana is currently in a countertrend corrective phase after finishing a macro Wave ③ top. We are in the midst of building Wave B, starting with a local impulse that forms black (A). After a minor pullback (black (B)), a 5-wave push (yellow) could complete Wave B before another major leg down kicks off in Wave C.

Solana Long Term I think it will form a handle-cane pattern. I will open a short position when Solana reaches $180.
Volume must be observed while this pattern is forming.
The maturity of this position is 1-2 months. I will open a long position if it closes above $180 for 3 days.

solona SOL/USDT: Key Levels to Watch
SOL/USDT trades at 146.66 (+2.94%), showing bullish momentum but facing key tests ahead.
Critical Levels
- Support: 142.12 (immediate), 138.21 (strong), 130.00 (major)
- Resistance: 151.10 (breakout zone), 155.00 (next target), 160.00 (major hurdle)
Outlook
- Bullish: Holding 142.12 and breaking 151.10 could push SOL to 155-160.
- Bearish: Losing 142.12 may trigger a drop toward 138 or 130.
Watch RSI (60.57) and MACD (4.88) for momentum clues.
Trade wisely—always confirm with volume and price action.

Solana structur-update ElliotWaveBINANCE:SOLUSDT
I'm still anticipating the same pattern; the only change is an additional high in wave 3.

Trading Observation on SOLSOL has officially reawakened.
After respecting the GB11 Order Block in the $98–$130 range — a clean accumulation zone — price has initiated what appears to be a calculated delivery run toward the GB89 OB near $273. This move aligns perfectly with the Goldbach pathway (GB11 → GB89), signifying that smart money is in full control, executing a textbook liquidity sweep and redistribution cycle.
Recent PA shows SOL breaking structure above the OB with conviction, flipping resistance into support. The order block was mitigated cleanly, offering an optimal entry for those paying attention. With volume tapering into breakout and now expanding on bullish momentum, the roadmap is being laid out in real time.
I’m projecting price to magnet toward the unmitigated imbalance zones above — particularly the inefficiencies left between $200 and $240. These are natural resting points on the journey to GB89.
Bias: Bullish continuation
Entry: $130–$144 (Order Block Breakout)
Target: $273 (GB89 OB)
Invalidation: Clean break below $120 closes the path
Path of least resistance is up. Liquidity is calling. I’m watching SOL unfold with the patience of a general at war — calculated, focused, and positioned.
Lord MEDZ

SOLANA SHORT TERMIf the uptrend continues and we see a bullish Total chart (i.e. we get volume support) then this pose will work.

SOLANA; BEARISH ASCENDING WEDGECRYPTOCAP:SOL had a false breakout from a descending wedge around the $127 price area marked with a horizontal green trend line.
This false breakout appears as a bearish ascending wedge, which would eventually break down because there is a fast pace of higher lows and a very slow pace of higher highs, which shows that lots of traders have been looking to short from the $147 price area, which appears to be a major resistance.
I would be entering a short position around the $150 price area, and my TP will be at $130.

SOLANA → Pre-breakout consolidation relative to 136.00BINANCE:SOLUSDT relative to the range support forms a false breakdown. The market reacts quite positively and the price recovers, forming a consolidation in front of strong resistance
Bitcoin is also in consolidation, as well as SOL, in general the movements coincide, but lately bitcoin is leading relative to the stock market.
SOL is in consolidation in front of a strong resistance level at 136.00. The primary test may end with a small correction to 0.5 fibo, or consolidation near the level, but a breakout and price consolidation above the current consolidation will be a positive signal for continued growth. The global trend reversal is out of the question, we are aiming at local targets, such as 140, 147, 152.
Resistance levels: 147,152
Support levels: 129, 123, 111
In general, the global market situation is bearish, the local situation is neutral as the price is in a sideways range. A false breakdown was formed against the support of the current range. Technically, due to liquidity imbalance (after the false breakdown) the price may head towards such zones as 147 - 152
Regards R. Linda!

SOL/USDT:BUYHello friends
Due to the price correction, we can buy in two specified areas in a stepwise manner, with capital and risk management.
*Trade safely with us*

SOLANA BREAKS BULLSolana is putting on a clinic in technical structure.
The recent move through $147 wasn’t just a breakout - it was the first higher high since the downtrend began back in January. That’s a major shift in character. So far, we’ve also seen a classic break and retest of that level, which is now acting as support.
Price sliced through descending resistance, flipped the 50-day moving average, and hasn’t looked back. Volume backed the breakout, and while the 200 MA still sits overhead, SOL is showing serious strength.
We called this one at the breakout - and so far, it’s following the script perfectly.

$136 Resistance Crumbles: Solana Bulls Take the Lead...Solana Breaks Key Resistance – Eyes Set on $150 and $180 Targets
Solana (SOL) has successfully broken through the strong resistance level at $136 after several failed attempts, signaling a potential continuation of its current uptrend. This breakout marks a significant technical milestone for SOL, which had previously struggled to maintain momentum above this price zone.
If Solana is able to hold above the $136–$137 level, it could open the door for further gains, with short- to mid-term price targets around $150 and $180. The breakout aligns with broader bullish sentiment in the crypto market and may attract new buyers looking to ride the trend.
For traders or investors interested in entering a position, the $136–$137 range could offer a potential entry point, provided the breakout holds and is supported by volume. As always, proper risk management is recommended, and watching for confirmation on the next few candles could be key.


SOLUSDT SOLUSDT Analysis 📊
🔹 Support Levels: 118, 112, and 107 USD
🔹 Resistance Levels: 130 and 150 USD
✅ The price has reacted positively after testing the 118-112 USD support zone, showing a short-term bullish move with increasing volume.
📉 If the price fails to break 130 USD, a pullback to 118 USD is possible.
📈 A breakout above 130 USD could pave the way for a move toward 150 USD.
🔍 Conclusion: The bullish trend remains unconfirmed until 130 USD is broken.

SOL | Short-Term Long | Key Resistance | (April 2025)SOL | Short-Term Long | Key Resistance & Liquidity Flip | (April 2025)
1️⃣ Short Insight Summary:
Solana has reached a critical resistance zone after a wave of short liquidations. While the broader crypto market is showing strength, SOL is at a decision point that requires caution.
2️⃣ Trade Parameters:
Bias: Short-term Long (with tight risk control)
Entry: Around current price near resistance (approx. $125–$128)
Stop Loss: Just below recent swing lows (can adjust based on volatility)
TP1: $138
TP2: $131
✅ Quick partial profits planned due to high-risk reversal potential at current levels.
3️⃣ Key Notes:
We’re sitting at a strong resistance zone that has seen multiple overlaps in recent days. A major round of short positions was recently liquidated, which could fuel a push higher — but also makes this a tricky zone for continuation. Watch for reversal signs, and manage risk tightly. Overall market sentiment is leaning bullish, which supports the long-term potential for SOL if it can break through.
4️⃣ Follow-up Note:
Will reassess based on how price reacts around $131 and $138. May update if momentum picks up or structure changes.
Please LIKE 👍, FOLLOW ✅, SHARE 🙌 and COMMENT ✍ if you enjoy this idea! Also share your ideas and charts in the comments section below! This is best way to keep it relevant, support us, keep the content here free and allow the idea to reach as many people as possible.
Disclaimer: This is not a financial advise. Always conduct your own research. This content may include enhancements made using AI.


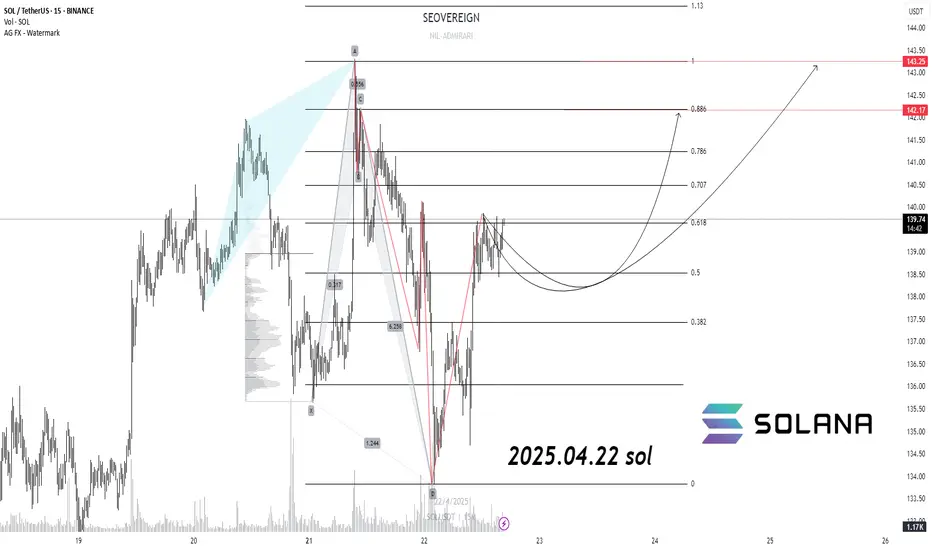
SOLANA 2025.04.22***Follow SEOVEREIGN to receive real-time alerts on our latest market insights.
**Your boost powers SEOVEREIGN to cover more assets and deliver broader, deeper analysis.
**We regularly publish in-depth research reports on the cryptocurrency market.
Solana appears to have recently completed a 5-wave structure and is now showing early signs of initiating a new bullish trend. This analysis takes a harmonic pattern approach, with a particular focus on the reaction following a 0.382 retracement — a level that has shown strong support and may now serve as the springboard for further upside.
From a technical standpoint, the 0.886 Fibonacci level is expected to act as a significant resistance zone, and this is where we've set our current target range. Based on this structure, we’re identifying two short-term price targets: 142 as the first target and 143 as the second.
This isn’t a simple price guess — it’s a strategic target based on the rhythm and symmetry of harmonic structures layered over prior wave formations. Harmonic patterns are more than just retracement percentages; they reflect the balance and energy distribution within the price cycle, making them a highly reliable tool for mid-range trade planning.
Even if you're not yet familiar with this approach, understanding how harmonics frame target zones can offer valuable insights and enhance your analytical toolkit moving forward.
Long trade
Trade Overview: SOLUSDT Long Position (Buy-Side Trade 2)
Entry Price: 139.079
Profit Target: 143.259 (+3.01%)
Stop Loss: 138.864 (–0.15%)
Risk-Reward Ratio: 19.44
🕑 Entry Time: 2:45 AM
📅 Date: Tuesday, 22nd April 2025
🌏 Session: Tokyo AM
⏱ Observed Timeframe: 5-Minute TF
Reason: Observing recent failed trade, decided to take another go...?
Profit target set at 143.259, a clear liquidity pool above recent highs, making it a logical magnet for price and a clean take-profit level before resistance or exhaustion.

