SOL/USDT Technical OutlookPrice may push higher towards the $194 resistance zone.
From there, a sharp rejection is expected, targeting the $171 support area.
If the market fails to hold $171, the next potential downside target lies around $140.
Key Levels:
Resistance: $194
Support: $171, then $140
Structure: Rising channel breakdown in play
📉 Bearish scenario activated if $171 fails to hold.
SOLUSDT trade ideas

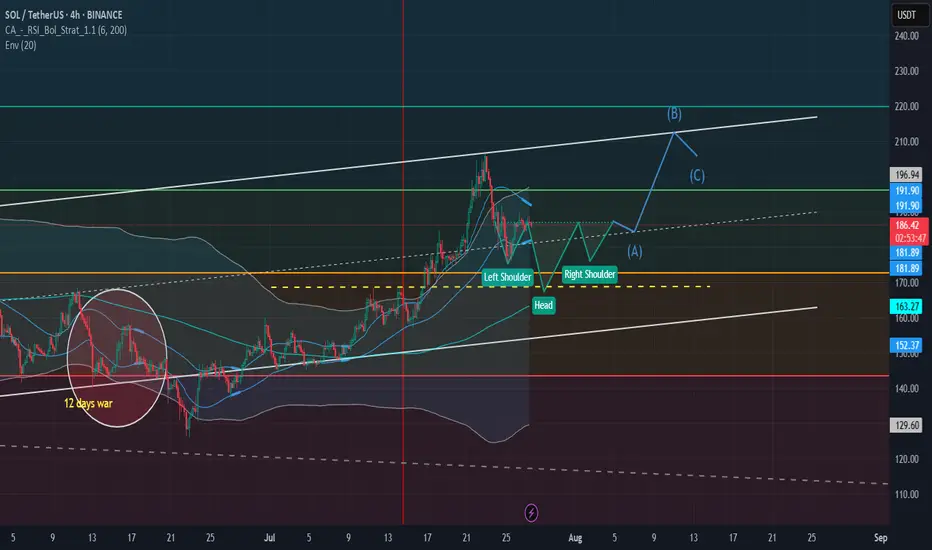
H&S Expected for Sol And Pyth until HHsPyth is following SOL and I expect a bit of a pullback for a better impusle to reach Higher Highs.
Technicals (RSI, Bollinger band) are showing overbought conditions and we can expect the usual End of months pullback. The pullback could reach the 168 - 170 Area before coming back to the current levels and after a potential light pullback to grab liquity and to create a new contraction before a new push toward 210 - 212 is expected.
This idea is only for educational content, please Do your own research before investing.
SOLANA $250 INCOMING? or $150 again?We can see a wedge is forming, price is at a major point, break above with a failed break below the resistance - we see high potential for $250.
Failed breakthroughs and a rejection? We see $150 once more.
Thoughts?

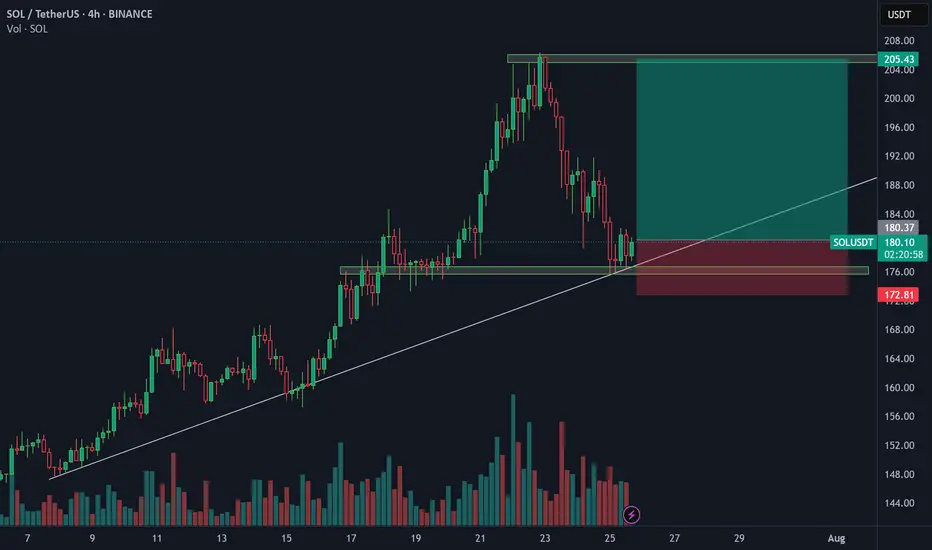
SOLUSD 4H — Holding the Line Before Altseason?Solana’s 4H chart presents a textbook continuation setup — a steady ascending trendline combined with well-defined resistance zones stacked overhead. This kind of compression within an uptrend often precedes explosive expansion, especially when aligned with broader altcoin market sentiment.
📊 Structural Breakdown:
Trendline Support:
Sol has maintained a rising trendline since early June, consistently bouncing off higher lows. This provides a dynamic support zone currently sitting around ~$175–180.
Horizontal Support:
The horizontal box at ~$175 represents prior structure highs turned into support — tested multiple times and aligning with the trendline. A breakdown here would be structurally significant.
Resistance Layers to Monitor:
$215 – Minor S/R flip and local liquidity cluster
$245 – Consolidation ceiling from Q1, where sellers previously took control
$270 – Clean weekly-level rejection from January
$300–310 – Final major resistance from the post-FTX crash range; breakout here signals full bullish expansion
Market Context:
The broader altcoin market is coiling, with majors like ETH and SOL holding structure while BTC ranges. If Bitcoin remains sideways or breaks slightly higher, capital rotation could drive a full “altseason” wave — with SOL as one of the first movers.
🔍 Key Conditions to Watch:
✅ Bullish Scenario:
Price holds ~$175 and breaks above $215 with strong volume
Clean retest of breakout zones confirms continuation
Targeting $245 → $270 → $300 in stages
❌ Bearish Invalidation:
Break and close below $175 trendline support
Would shift bias toward a wider range or even short-term downtrend
⚙️ Indicators to Watch:
4H RSI holding above midline (50) supports bullish continuation
MACD crossover + volume expansion = trigger confirmation
This chart is a reminder that you don’t need to chase green candles — spotting compression structures and planning for breakout zones is where the edge lies. Whether you’re positioning spot or looking for a leveraged entry, this structure rewards patience and timing.

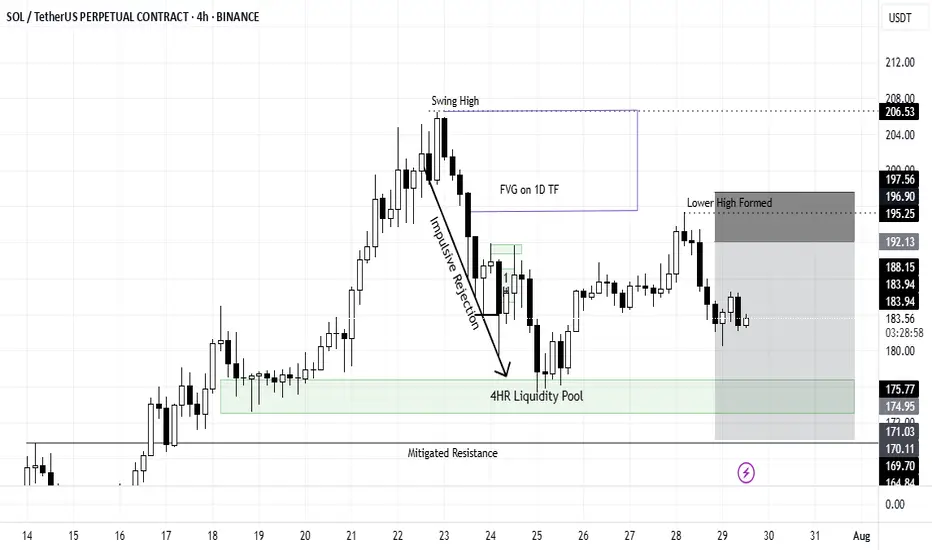
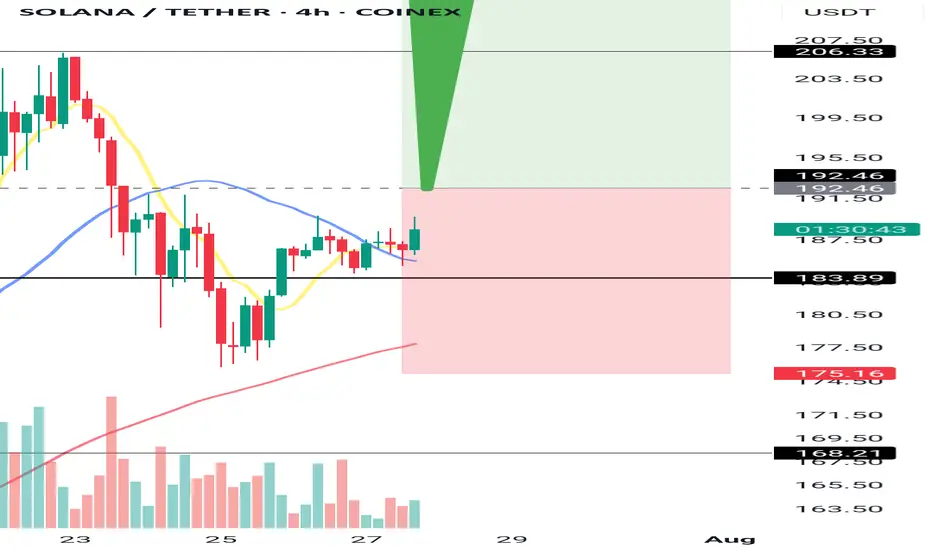
Mid Term SOL Short PlayOn the 4H timeframe, we can see SOL is currently facing resistance after breaking past $206.
It makes an impulsive move downward crating a Fair Value Gap visible on the Daily timeframe between 204.7 and 195.39.
It briefly touched the 4H Liquidity Pool before making an attempt to run up again.
However, the move got terminated at 195.25 forming a Lower High which is a signal of the downtrend.
Since it has not broken below 173.3 (Last swing low before breaking 206), it's still too early to call.
My mid term play would be to find entry between 191-193 and hold a short position to break below the FVG and bounce of the mitigated support.
Stop loss : 198
Target : 170
SOLUSD Good Buying Price - Target Weekly ZoneBINANCE:SOLUSDT pullback to weekly level, buying price is good and cheap
Note: Manage your risk yourself, its good trade, see how much your can risk yourself on this trade.
Don't be greedy.
Use proper risk management
Looks like good trade.
Lets monitor.
Use proper risk management.
Disclaimer: only idea, not advice

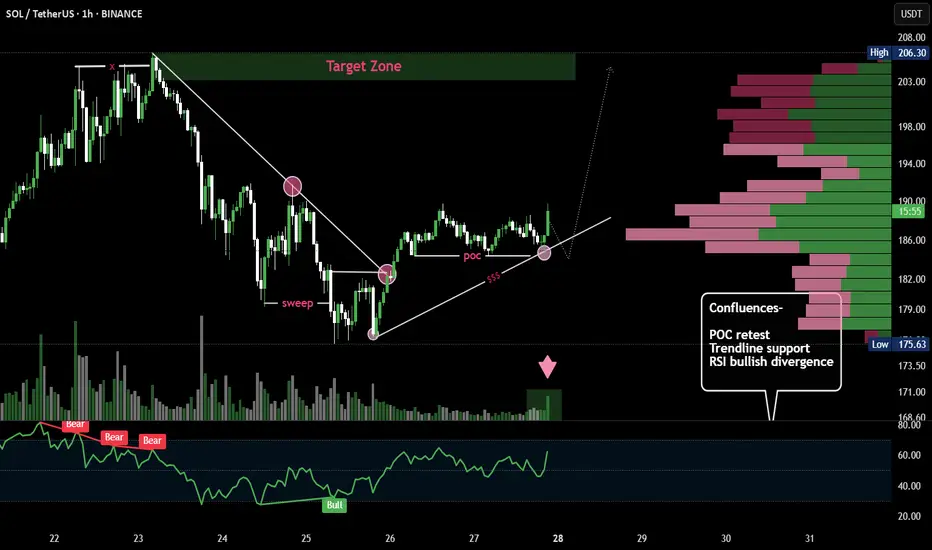
SOL/USDT 1H Chart – Technical Analysis BreakdownTrend Reversal Structure: Price broke out of a descending trendline after sweeping prior lows (liquidity grab), indicating a possible bullish reversal setup.
Point of Control (POC): Price is currently retesting the POC area (high-volume node), aligning with the trendline and prior support — a potential bounce zone.
RSI Divergence: Bullish RSI divergence marked near the sweep confirms the loss of bearish momentum, strengthening the case for upward continuation.
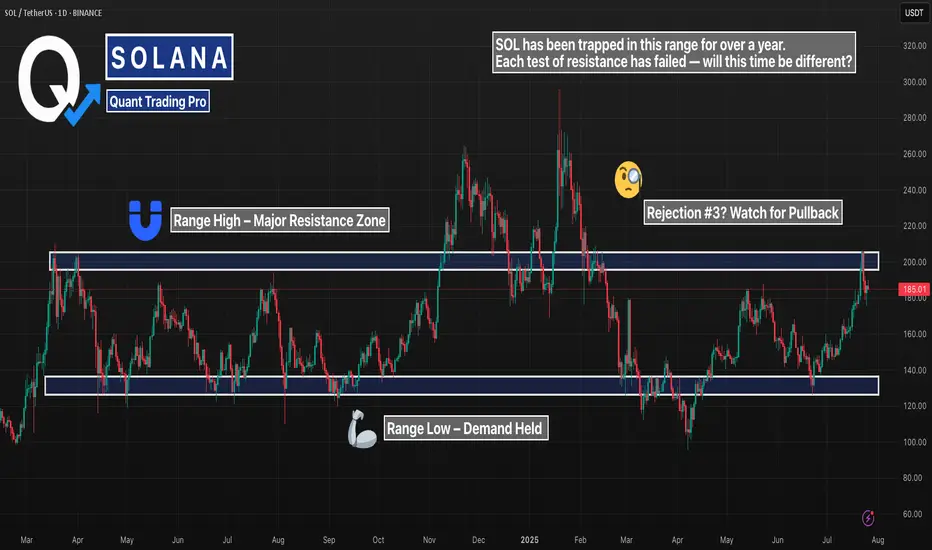
SOL 1D – Range High Rejected… Again?Solana just tapped major resistance — the same level that’s capped every rally since early 2024. This is now the third clean rejection off the $200 zone, and the structure couldn’t be more clear:
– Long-standing range between $115 and $200
– Previous rejections at the top led to full retracements
– This latest attempt? Rejected again — for now
If bulls want to flip the script, they’ll need a confirmed breakout with volume and a clean retest. Otherwise, this chart is screaming “range still intact.”
Until proven otherwise, this zone remains supply-heavy. Keep your risk tight — the next leg could move fast.
#Solana #SOL #RangeTrading #ResistanceZone #CryptoAnalysis #TechnicalBreakdown #QuantTradingPro #PriceAction
Your Technical Analysis Improved, But Your Account Didn't. Why?You're learning more. Your charts look cleaner.
But somehow... your losses just keep getting worse?
If that feels familiar, this breakdown might explain exactly why.
Hello✌️
Spend 3 minutes ⏰ reading this educational material.
🎯 Analytical Insight on Solana:
BINANCE:SOLUSDT is testing a key trendline and daily support that aligns with Fibonacci levels 🔍. A clear break above the psychological resistance at $210 could trigger at least a 16% rally, targeting $230 🚀.
Now, let's dive into the educational section,
🧬 The Precision Trap
The better your analysis gets the narrower your entries become.
You start avoiding trades unless every single box is ticked. But guess what Markets don’t tick boxes. They break them.
Overanalysis creates tighter stops smaller buffers and a mind that’s too afraid to pull the trigger.
💰 The Hidden Greed in Smart Trades
Better analysis often brings a false sense of confidence. You expect more precision more profit.
This turns into silent greed masked as logic. Suddenly you risk bigger positions because this one is obvious.
But pros don't risk more when they’re more confident. They risk consistently.
💭 The Mind That Blocks Your Profits
You didn’t lose because you didn’t know. You lost because you knew too much and became a slave to it.
When your brain seeks confirmation not clarity it sabotages trades that were ready to work.
Don't let analysis chain you to hesitation.
🔄 Analysis or Addiction
Ask yourself honestly
Are you using your analysis to take action or to avoid it
Charts should guide you not paralyze you. If you need six signals to feel safe you’re not analyzing you’re hiding.
🧃 Every Chart Has a Bias
What looks like a sell to you might be a buy to someone else.
Why Perspective. Some buy the bounce others short the breakdown.
So if your top-tier analysis still leads to losses maybe it's time to stop upgrading tools and start upgrading your lens.
🧨 The Overanalysis Spiral
Your brain can’t juggle thirty signals. But most traders try anyway.
This doesn’t make you smarter. It makes you slower more anxious and emotionally drained.
Good trading isn’t about more info. It’s about clearer action.
🧱 The Mind That Won’t Let You Win
The more you lean on your indicators the more you fear breaking their rules.
You skip solid trades just because one tool says maybe not yet.
At that point it’s not risk management. It’s dependency. Let tools guide not dominate you.
🛠️ TradingView Tools That Help Or Hurt Your Mindset
It’s not about what tools you use. It’s how you use them.
Here are a few tools that when used right can actually improve both your decision-making and emotional control:
Session Volume and VWAP
Don’t just chase setups blindly. Check price versus VWAP. Often entries you feel are great are just late reactions to intraday rebalancing.
RSI and Auto Divergence
Don’t focus on RSI values alone. Use divergence indicators that highlight hidden bullish or bearish signals. Many traders miss moves by ignoring the tension RSI reveals.
Long Short Position Tool
Try using this for mental reps. Plot fake trades. Watch how the market behaves without risking capital. Over time you’ll train your brain not just your account.
These tools won’t fix your psychology but they’ll mirror it. And that’s where real change begins
🎯 Final Thoughts
Great analysts don’t trade everything they understand.
They understand what not to trade.
If better charts aren't bringing better results stop upgrading your screen and start rewiring your mindset.
✨ Need a little love!
We pour love into every post your support keeps us inspired! 💛 Don’t be shy, we’d love to hear from you on comments. Big thanks , Mad Whale 🐋
📜Please make sure to do your own research before investing, and review the disclaimer provided at the end of each post.

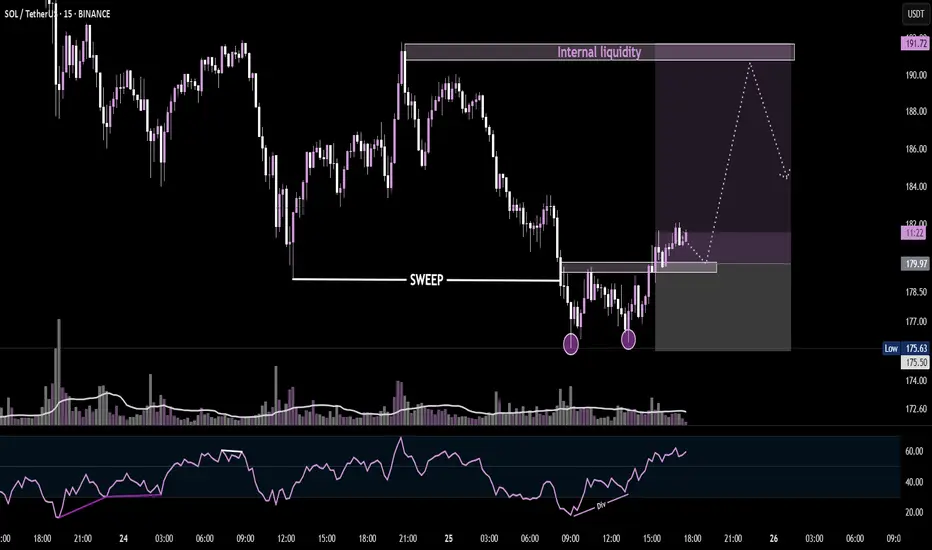
SOL/USDT - 15MINrice swept previous lows, formed a double bottom with bullish RSI divergence, and is now consolidating above the sweep zone. If support holds, we may see a rally into the internal liquidity zone around $191. Keep an eye on structure and volume confirmation for the next leg up.
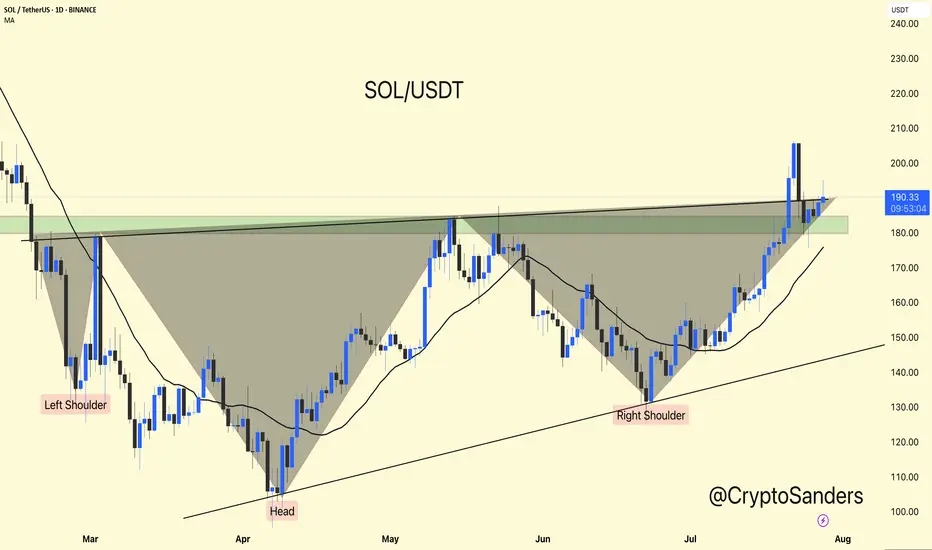
SOL/USDT Daily Chart Update:Solana has completed a classic Inverse Head and Shoulders pattern, breaking out above the neckline near the $185–$190 zone.
Currently holding above the breakout zone, showing bullish strength.
As long as SOL stays above the neckline support, continuation toward $210–$230 remains likely.
Trend remains strong above the moving average.
Stay updated and manage your risk accordingly.
DYOR | NFA
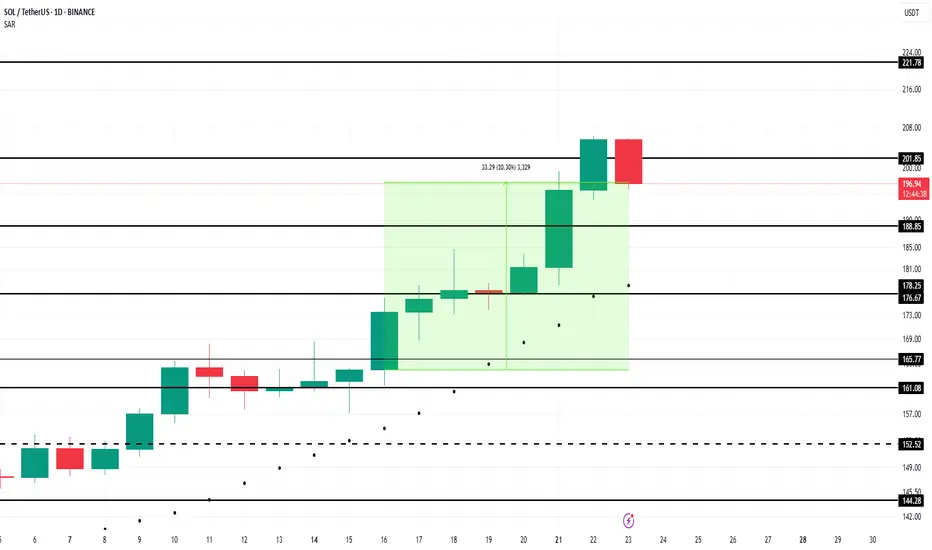
Solana Price Faces Reversal At $200 As Profits Hit 5-Month HighBINANCE:SOLUSDT price has risen 21% in the past week , now trading at $199. Despite breaching the $200 mark, Solana has failed to maintain this level, marking a five-month high.
The Net Unrealized Profit/Loss (NUPL) indicator for BINANCE:SOLUSDT shows that profits have reached a five-month high . This signals that many investors are in profit, raising concerns about a potential sell-off.
If these factors hold true, BINANCE:SOLUSDT price could decline toward the support levels of $188 or even drop to $176 . A move below these levels could erase a significant portion of the recent gains and shift the altcoin into a bearish trend.
However, if investor confidence remains strong and the market continues to show bullish signs, BINANCE:SOLUSDT could stabilize above $200 . Securing this level as support could propel the price back toward $221, invalidating the bearish outlook.
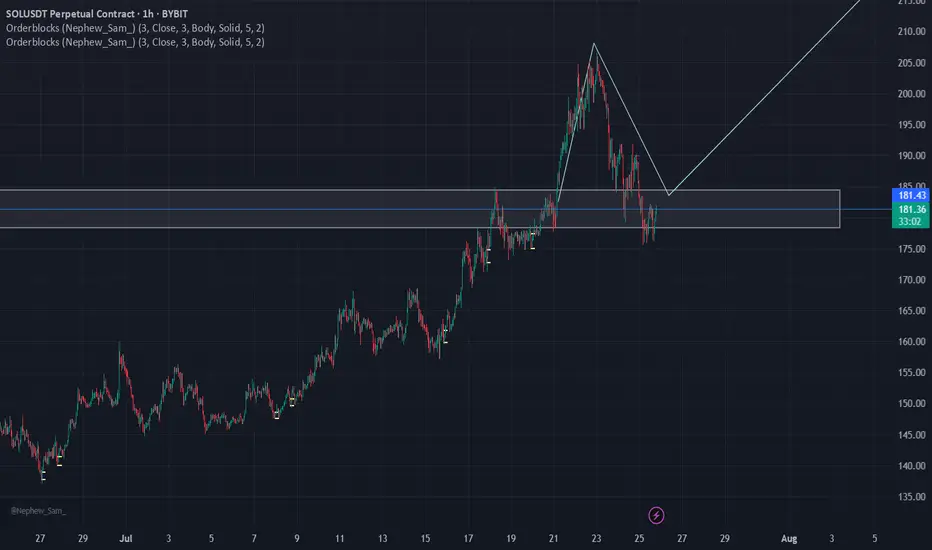
Lingrid | SOLUSDT Pullback Opportunity From the Support ZoneThe price perfectly fulfilled my previous idea . BINANCE:SOLUSDT is gaining upside traction after a clean breakout from the range zone and reclaim of the upward trendline near the 188.46 area. Bullish momentum from the higher low confirms buyers' control inside the rising channel, and price is now consolidating above key support. As long as the price holds above 188, the bias favors another move into the 220.00 resistance region. This ascending pattern reinforces the bullish structure with a likely continuation toward the upper boundary.
📉 Key Levels
Buy trigger: Break above 202.00
Buy zone: 188.00–194.00
Target: 220.00
Invalidation: Close below 188.46
💡 Risks
Failure to hold above 188.00 support
Loss of momentum after breakout
Macro-driven volatility reversal
If this idea resonates with you or you have your own opinion, traders, hit the comments. I’m excited to read your thoughts!


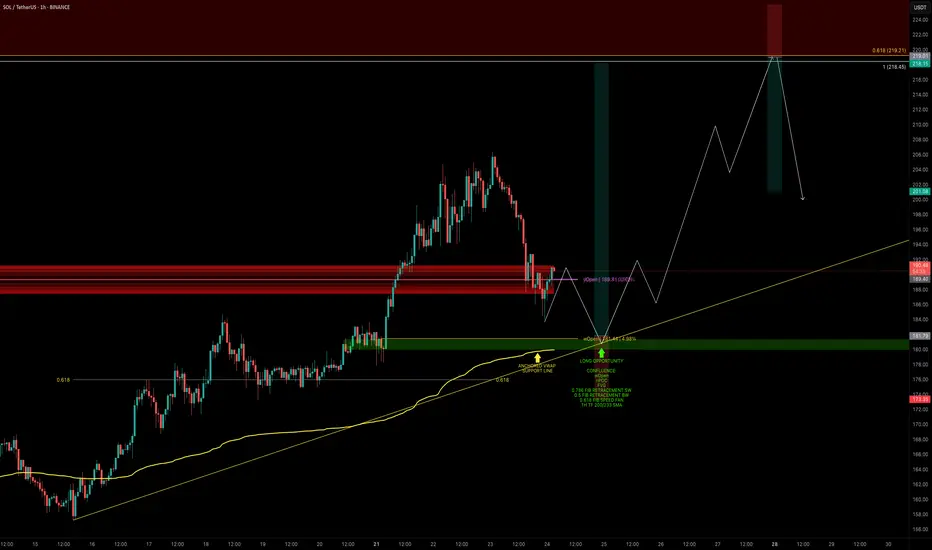
SOL — Bullish Retest in Motion: Time to Strike?SOL has finally broken through the $180 barrier decisively — a key zone it failed to clear back in May.
Now we’re seeing a retest, which may offer one final dip before continuation. Let’s break down the next high-conviction long opportunity.
🧩 Key Retest Zone: $182–$180
➡️ Retesting Prior Resistance as Support
SOL broke above $180 with conviction and is now pulling back.
➡️ First Reaction at $184
A clean bounce occurred at the anchored VWAP, but this might not be the final low.
➡️ Strong Confluence at $180–$182 Zone
This zone is packed with support elements:
Weekly Open (wOpen): $181.44
nPOC: $180.85
Anchored VWAP: ~$179.90
0.5 Fib retracement (of the larger wave)
0.786 Fib retracement (of the smaller wave)
0.618 Fib Speed Fan — projected for tomorrow’s price path
1H 200 & 233 SMAs supporting from below
SOL is currently trading at yOpen — another key pivot level to watch
🟢 Long Trade Setup
Entry: Laddered between $182–$180 (ideal long entry would be at wOpen)
Stop-loss: Invalidation at $173.35
Target (TP): TBFE 1.0: $218.45 / 0.618 Fib retracement: $219.21
R:R: ~1:4.5
Potential Move: ~+20%
🛠 Indicator Used: DriftLine — Pivot Open Zones
For this analysis, I’m using my own published indicator called "DriftLine – Pivot Open Zones " feel free to check it out on my profile.
It helps identify and visualise critical opens (daily, weekly, previous days), providing real-time support/resistance zones.
➡️ You can use it for free — just check my profile under “Scripts” and add it to your chart.
💡 Pro Tip: Support Zones Are Stronger with Confluence
Don’t rely on a single fib or level. When opens, VWAPs, SMAs, and fibs cluster, the probability of a strong reaction increases.
This is how smart traders define clear entries and invalidation.
_________________________________
💬 If you found this helpful, drop a like and comment!
Want breakdowns of other charts? Leave your requests below.
Solana maintains its upward structure ┆ HolderStatBINANCE:SOLUSDT is bouncing from the $170–172 zone, building higher lows just below resistance at $180. The structure is shaping into a rounded bottom with signs of accumulation. If SOL clears $180 with volume, targets lie at $188 and beyond. Trend remains bullish as long as price stays above the local demand zone.

Just like #AKRM, #SOL can also pump 100%Just like #AKRM, #SOL can also pump 100%..
SOL will also have this kind of exit rally. Whether there is a war between the US, Iran, and Israel or not, the market will crash very badly.

SOL LONGSolana is bouncing off the support level and the ascending trendline. Bullish movement is expected to continue and reach $205
Solana (SOL): Good Buying Opportunity Incoming | June 2025Solana is gathering buyside volume, and we are back near daily timeframes of the 200 EMA, which might be our breakout for an upcoming long position.
More in-depth info is in the video—enjoy!
Swallow Academy

Weekly Altcoin Analysis – XRP, BNB, SOL, DOGE, ADA
🚀🔥 Don’t forget to FOLLOW & hit the ROCKET button for more weekly altcoin setups! 🔥🚀
♦️ Weekly Altcoin Analysis – XRP, BNB, SOL, DOGE, ADA ♦️
Starting this week, I will publish weekly analyses of the top coins on CoinMarketCap.
Since I analyze BTC and ETH daily, this review will begin from the third coin onward.
💎 XRP
🚀 Entry Trigger: Breakout above 3.25 – entering here makes the breakout of 3.33 easier.
⭕ Resistance: 3.33 may act as a strong barrier.
❗ Stop-Loss: 2.90
💎 BNB
✅ Entry Trigger: The entry level was 786.1, which has already been surpassed.
🔄 Plan: Wait for a pullback, formation of new highs and lows, and then breakout of the new high.
💎 SOL
🚀 Entry Trigger: 192.5 for long positions.
❗ Stop-Loss: 176.4 (around 8% lower).
💎 DOGE
❓ Entry: No clear trigger yet.
⭕ Suggestion: Possible entry at 0.25 with lower capital and strict risk management.
❗ Stop-Loss: 0.221004
💎 ADA
🚀 Entry Trigger: Breakout above 0.8405.
❗ Stop-Loss: 0.7591.
🔥 Key Notes:
1️⃣ All setups are based on the 4H timeframe.
2️⃣ A drop in BTC dominance below 60.83 and then 60.42 = confirmation for holding long positions and a new trend formation.
3️⃣ TOTAL, TOTAL2, TOTAL3, and USDT.D levels remain the main factors for confirming these setups (explained in my previous analysis).
4️⃣ ⭕ Caution: There’s a high chance of fake breakouts and stop-outs in these positions. Use risk and capital management.
👇 Make sure to read my complete market, BTC & ETH analysis in the link below. 👇
🚀🔥 FOLLOW & smash the ROCKET to keep these analyses coming! 🔥🚀
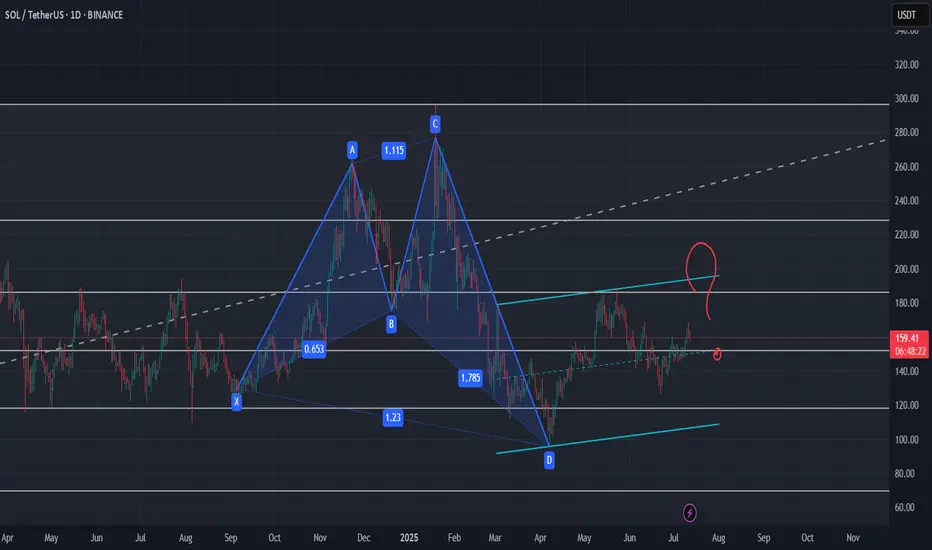
HARMONIC PATTERN on Daily for SOL ?I wonder if this pattern is the one which is highlighted by our friend and chart analyst @The_Alchemist_Trader_
Let's see if it need to test one last time the support of this channel or if it will break out for the long waited rally.
Level to keep an eye :
0.5 Fib support need to hold and clean breakout of the 0.382 Fib
Indicators : RSI, volume and volatility (liquidations)
SOL Uptrend Update➡️ Solana has been correcting for the last couple of days, but the trend is clearly up.
➡️ There are 2 confluence factors that should give price support: the gray ascending trendline and the green zone.
➡️ Initial Targets (purple lines) are:
218.45 (100% extension)
258.79 (beginning of blue potential supply zone)
