Solana is bouncing back from $175 ┆ HolderStatOKX:SOLUSDT is testing the $180 barrier. Breakout could extend gains to $186. If rejected, $172–$173 may act as reentry zone. Market structure favors continuation.
SOLUSDT trade ideas
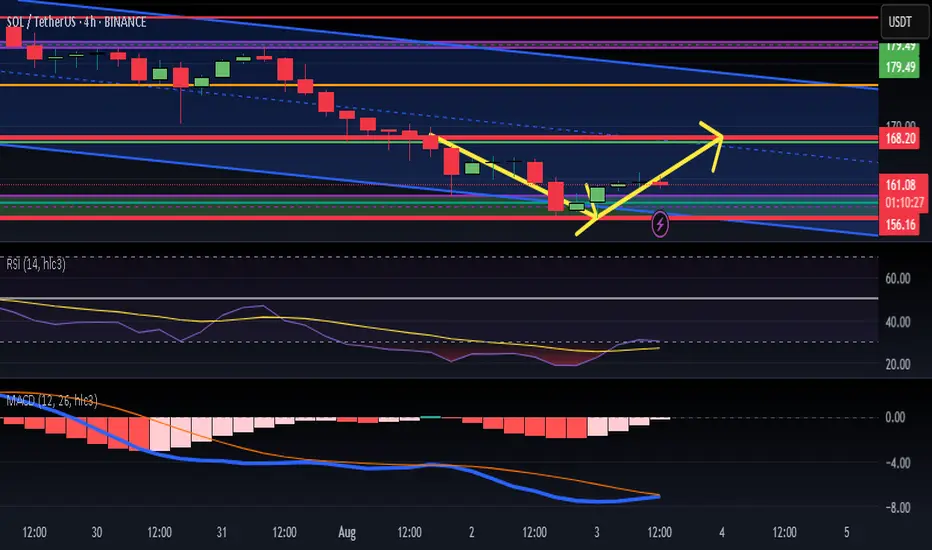
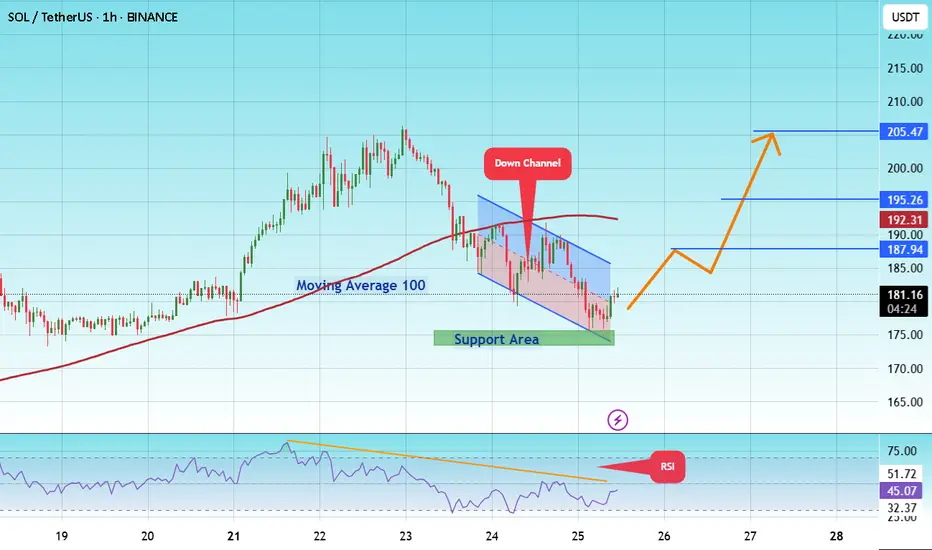
#SOL/USDT coin market structure analysis#SOL
The price is moving within a descending channel on the 1-hour frame and is expected to break and continue upward.
We have a trend to stabilize above the 100 moving average again.
We have a downtrend on the RSI indicator that supports the upward move with a breakout.
We have a support area at the lower boundary of the channel at 175, acting as strong support from which the price can rebound.
We have a major support area in green that pushed the price upward at 174.
Entry price: 181.
First target: 187.
Second target: 195.
Third target: 205.
To manage risk, don't forget stop loss and capital management.
When you reach the first target, save some profits and then change the stop order to an entry order.
For inquiries, please comment.
Thank you.
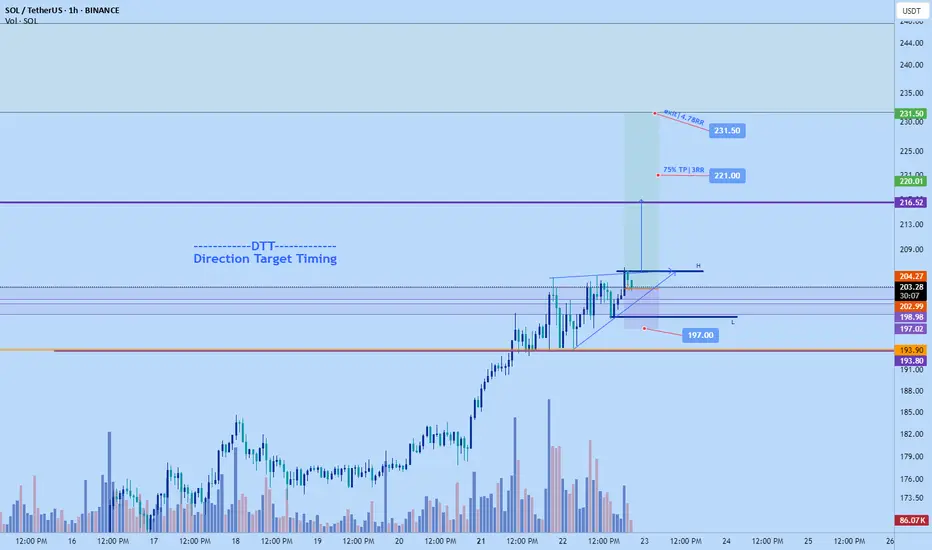
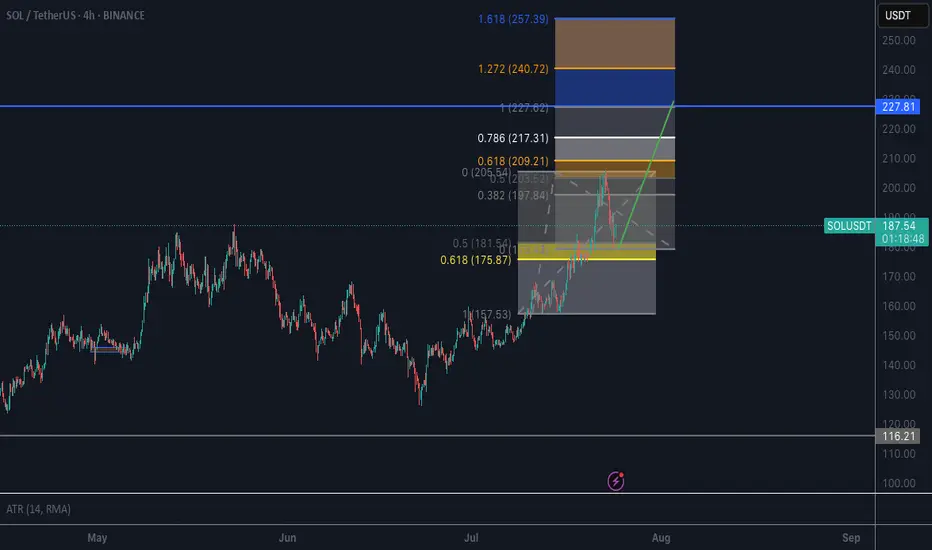
Swapped ETH for Sol long to $231.5Just abandoned the eth ship after holding it for a few days. Its price action is looking up but exited close to BE.
Solana on the other hand price action has been more positive and actually cleaner with less resistance ahead on higher timeframe compared to ethereum. In fact if all goes according to plan am expecting solana to start pushing for the $220 area tonight.
Stop is placed below 4hr HL structure at $197. Playing it conservative.
Market has free space to move into until $216.5 area thats why I have an alert there to monitor given all goes well as price could start reacting there.
I didn't go for a very precise entry. Rather I prioritize the fact that the market is at a daily prior resistance area which can provide quite a bit of support and my stop is below that area..so market has to break 4hr structure HL plus daily support to get to stop- decent protection and still can get a potential 3-5 RR which is great.
Time sensitive
SOLUSDT on Fire! Bullish Wedge Fuels INSANE Upside Potential!BINANCE:SOLUSDT has been exhibiting strong bullish momentum, currently trading within a broadening wedge pattern. This technical structure often signals increased volatility and the potential for decisive moves in either direction. In the present scenario, the breakout above the psychological $200 resistance level suggests that bulls are firmly in control, fueling hopes of further upside.
The continuation of momentum hints at the market preparing for another leg up. The immediate price target lies at $300, where traders may expect some profit-taking and resistance. However, should momentum sustain and buying pressure persist, BINANCE:SOLUSDT has the potential to surge toward the $700 region, aligning with the pattern’s projected price expansion.
As always, managing risk is key. Use a well-placed stop loss below the support level to protect your capital. Breakouts can be explosive, but discipline and proper risk management make all the difference.
BINANCE:SOLUSDT Currently trading at $201
Buy level : Above $200
Stop loss : Below $150
Target 1: $250
Target 2: $300
Target 3: $500
Target 4: $700
Max leverage 2x
Always keep stop loss
Follow Our Tradingview Account for More Technical Analysis Updates, | Like, Share and Comment Your thoughts

Solana is preparing to breakthrough $200 ┆ HolderStatOKX:SOLUSDT is trapped between $172 and $180. Break above $180 may unlock $188+. Watch for volume breakout.
SO LONG : Next Target $220 ZoneSOL price successfully broke above the 200 resistance zone.
Trend bias is upwards currently with the next projected resistance around 225 USD
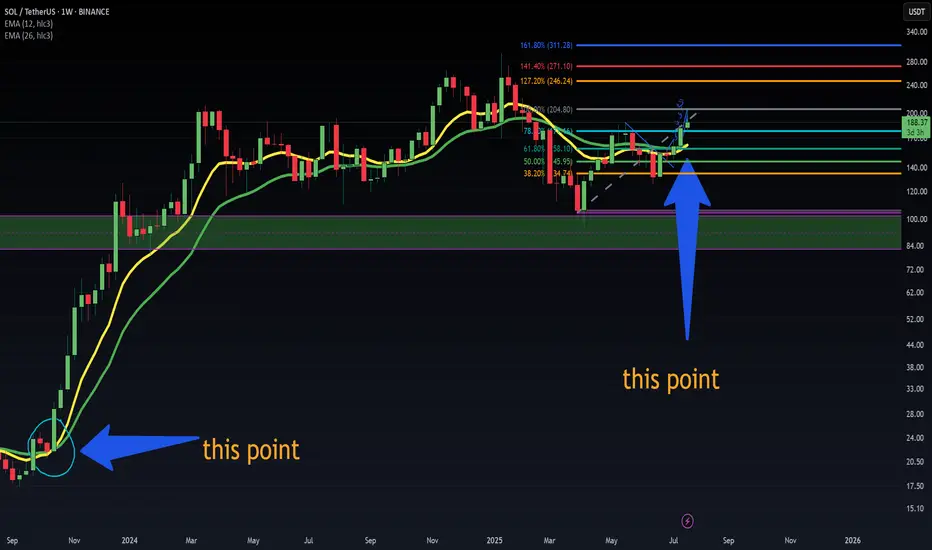
Solana is undervalued | New ATH coming very soon | $250++Solana is slowly but surely grinding up, following the altcoin king ETH. ETH is already near its 2024 highs of $4000. If SOL were to be in the same position as ETH in terms of price, we should be around $250.
In technical terms, SOL is showing huge bullish strength at the $180 resistance. In the last attempt in breaking above this level, it faced multiple rejections and consolidated before ultimately backing down. This time, there is little to no resistance.
The REX-Osprey SOL staking ETF continues to garner inflows, having only one outflow day since the launch date 2nd July. That's nearly $100 million net inflows and 11 inflow days out of 12 trading days. Imagine the demand the spot SOL ETF by big players such as VanEck, Grayscale and Fidelity will have once approved.
BTC dominance is breaking below 60%. Capital is flowing from BTC into ETH, and once ETH hits $4000, a good amount will flow from ETH to SOL as people look for better potential gains.

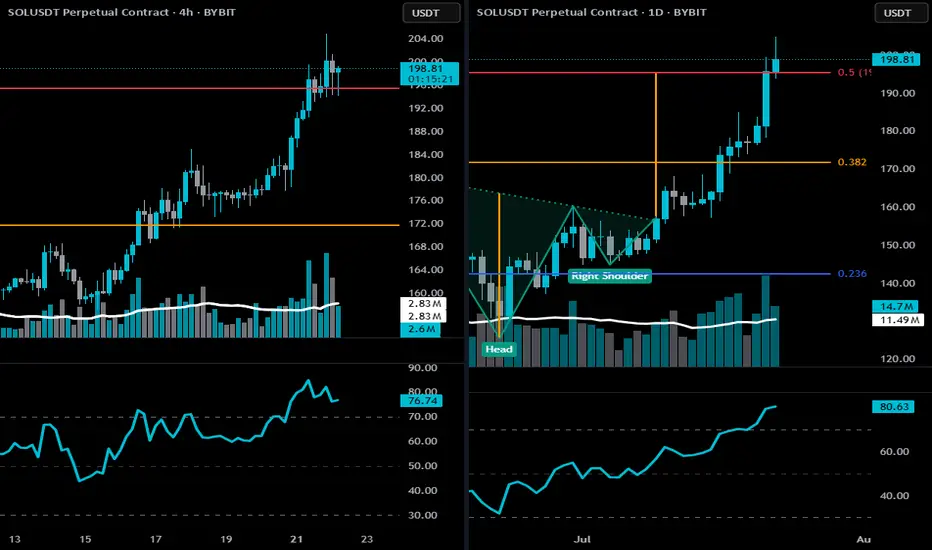
SOL CRUSHING-bearish risks developing🔻 4-Hour Bearish Thesis
🔸 Price Action Clues
SOL is currently stalling at the 0.5 Fibonacci retracement (~$198.18) of the full macro move — a classic profit-taking zone.
Multiple upper wicks and indecisive candles at resistance indicate supply absorption and buyer exhaustion.
After a steep rally, price is moving sideways in a rising wedge/flag, which is a bearish continuation pattern if broken downward.
🔸 Momentum + RSI
RSI at 76 is extended and flattening — often a zone where short-term pullbacks begin.
No confirmed bearish divergence yet, but momentum is weakening compared to earlier stages of the rally.
🔸 Volume Profile
Volume on recent pushes is lower than during breakout, suggesting diminishing bullish conviction.
Bearish if a breakdown below $194 occurs — that's the former breakout level and wedge support.
🧨 4H Breakdown Confirmation
Break below $194 (key short-term support) → opens downside targets:
🔻 $186–$182 (prior breakout base)
🔻 $171 (0.382 Fib retracement zone)
🔻 Daily Bearish Thesis
🔸 Price Action + Key Zone
Price is pressing against the neckline target ($198.18) of the inverse H&S pattern.
Stalling under the red resistance line and 0.5 Fib.
Recent candle closed with a small upper wick + reduced body size, hinting at hesitation after a parabolic run.
🔸 RSI Risk
RSI is at 80.41 — very overbought on daily.
While not immediately bearish on its own, this often precedes either:
Sharp correction, or
Prolonged consolidation
🔸 Fibonacci & Macro Resistance
$198–$200 is a confluence zone of:
0.5 Fib retracement
Previous structural resistance
Measured target of inverse H&S pattern ALREADY HIT.
This is not a great spot to initiate new longs — any weakness here invites a pullback.
⚠️ Invalidation of Bearish Thesis
A strong daily close above $200–$204, ideally with expanding volume, would invalidate the bearish outlook and shift momentum toward $219 (0.618 Fib).
🧠 Summary:
Yes, there is a short-to-mid-term bearish risk developing on both 4h and daily:
Overbought RSI
Stalling at major Fib resistance
Decreasing momentum
Vulnerable if $194–$195 breaks
Remember: this WILL MOST LIKELY BE A SHORT-SHORT pullback, not a confirmed trend reversal… yet. BUT I'VE INITIATED A STARTING POSITION!
THIS IS NOT FINANCIAL ADVICE. DrAnkin Smöökëē Whizkee. Edumacational Purpiz Only!
SOL long running - follow up on the Cup & Handle ideaPrice closed above both key levels I mentioned — 181 and the HTF S&R at 188 — with momentum and structure confirmation. That gave me enough conviction to enter a long.
🎯 Final TP aligns closely with the measured move target: 245.
📈 SL is already at breakeven after TP1 hit — risk-free from here.
Let’s see if SOL completes the full handle breakout.

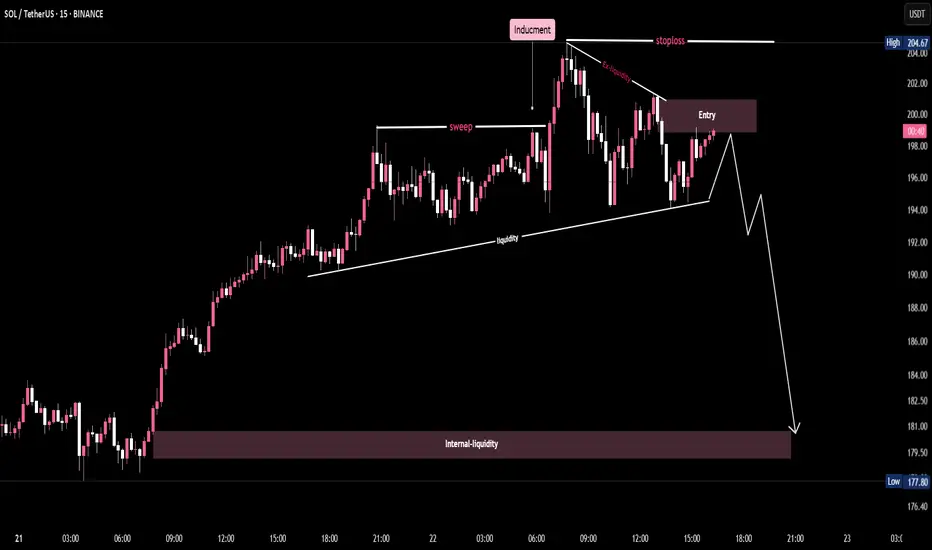
Bearish SMC Setup on SOL/USDT -15-Min chart🔑 Key Points from the Chart:
1.Inducement:
A price level engineered to trap breakout traders before reversing.
The chart shows a false breakout above the previous high, which induces buyers.
2.Sweep:
The market sweeps the prior highs (liquidity grab), enticing breakout traders.
Price shortly reverses after triggering stop orders above.
3.Ex-Liquidity (External Liquidity):
Refers to stop-loss clusters above the high.
This liquidity is taken out, leading to a reversal.
4.Entry Zone:
A supply zone where the price revisits after the sweep.
Ideal short entry indicated in the maroon box.
5.Stoploss:
Placed above the inducement high (post-sweep high).
Clearly labeled to show safe invalidation zone.
T6.rendline Liquidity:
Diagonal support connecting higher lows.
Acts as a trap—once broken, confirms bearish intent.
7.Internal Liquidity:
Major demand zone where price is expected to head next.
Target for the short setup, marked in a large maroon rectangle.
8.Projected Price Path:
White line showing expected bearish move.
Aims for internal liquidity zone below $181.
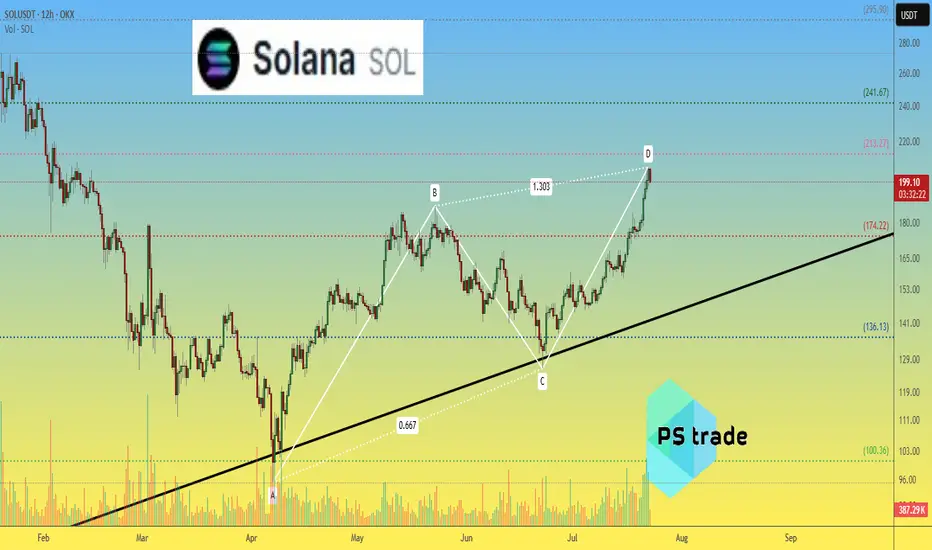
Solana SOLusdt: ABCD Completion & Reversal Candle Forming?The ABCD pattern on the 12H OKX:SOLUSDT chart is nearly complete near $213.
🔻 Current candle attempts to engulf the previous bearish one — an early reversal signal.
📊 Volume is declining after impulse — adding confluence.
📉 Correction targets:
$175 — Fibo 0.5 + support
$136 — consolidation area
$100 — start of CD move
❌ Breakout above $213 invalidates reversal scenario.
_____________________
Did you like our analysis? Leave a comment, like, and follow to get more

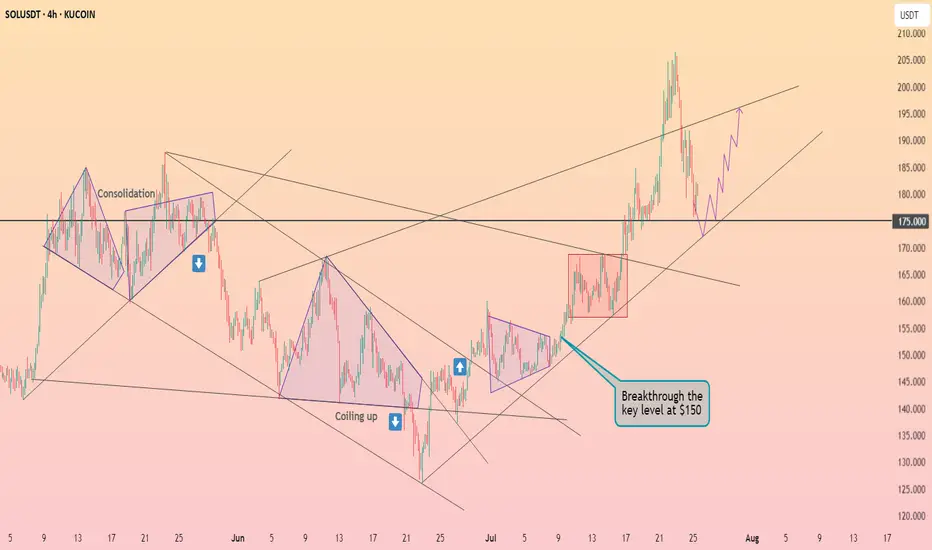
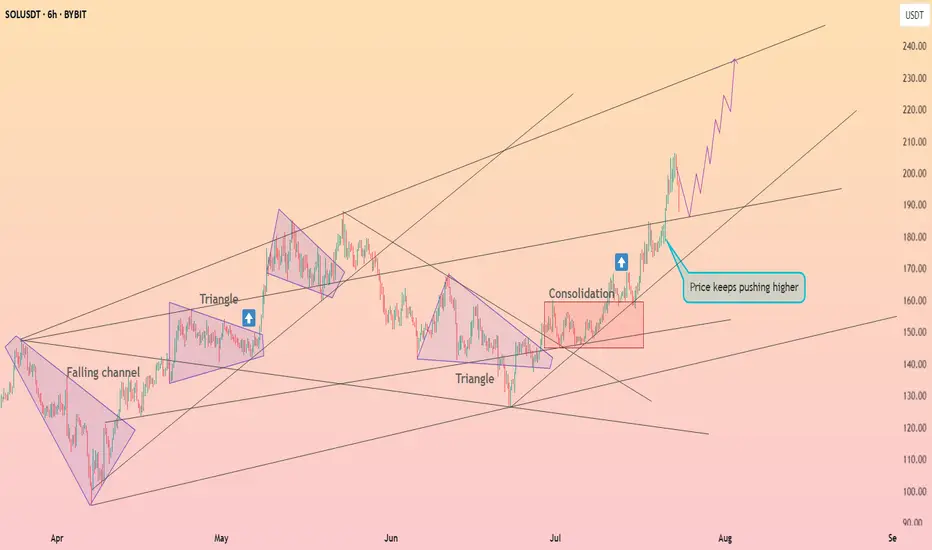
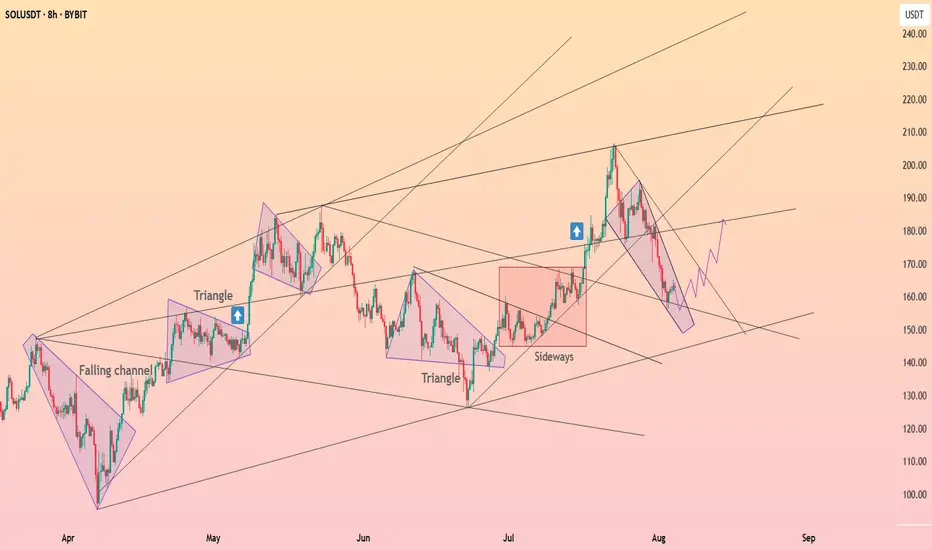
Solana is forming the falling wedge ┆ HolderStatBYBIT:SOLUSDT is moving within a falling channel after the recent drop from $200. Previous triangle breakouts led to rallies, and the current setup resembles earlier accumulation zones. A break above the channel could lead to $180 upside.
next important Supportif the support break in 160 price its become resistance and i think next and strong support is 151

Weekly trading plan for SolanaPrice is currently testing the weekly pivot point, but significant resistance remains overhead. We could see a fake breakout of the descending channel before a true downside move materializes.
Key Levels & Scenarios:
Primary Target: $136-146 range
Bullish Invalidation: A confirmed break & hold above $182 would shift bias, opening path to $200
Until we clear $182 decisively, the structure remains bearish. Trade the ranges carefully.

SOLUSDT📊 #SOLUSDT
⏱ TIME: 1D
⭕️risk: mid
📍The initial buying market: 168-169
📌TP1: 192$
📌TP2: 224$
⛔️SL: 144$
❌These analyzes are just to give a better perspective for you dear ones
Do not base on buying and selling❌

Solana Technical AnalysisBINANCE:SOLUSDT
Solana ( CRYPTOCAP:SOL ) Technical Analysis:
Last week, #Solana closed below its daily resistance level of $184.13 on Monday and subsequently declined by 13.44% over the next five days. The decline found support around the 200-day Exponential Moving Average (EMA) at $162.75 on Sunday. Notably, this EMA level aligns closely with the 61.8% Fibonacci retracement at $163.40, establishing a key support zone.
At the start of this week, SOL rebounded by 4.68% on Monday, and as of Tuesday, it is trading near $168.67.
If the 200-day EMA at $162.75 continues to hold as a support level, there is potential for SOL to extend its rally toward the daily resistance at $184.13.

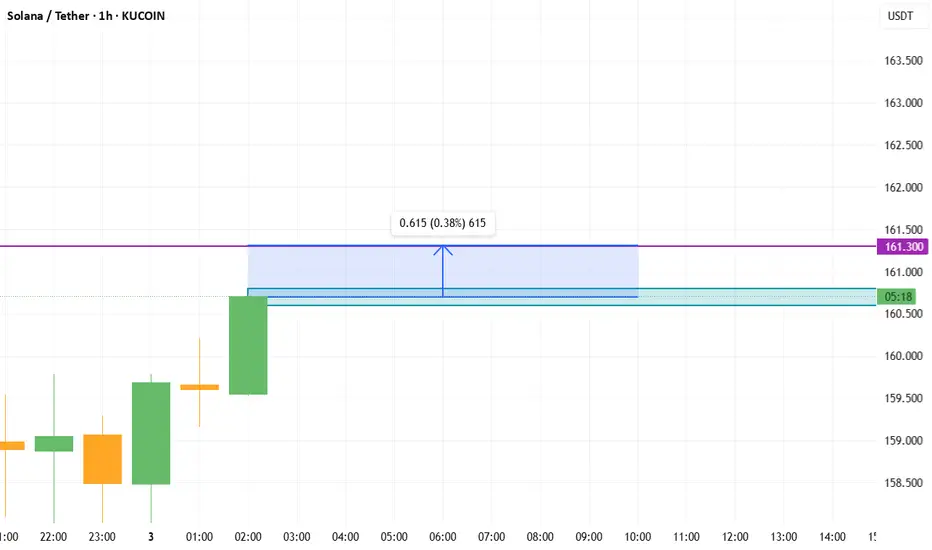
SOLUSDT Direction of operation: Long (Buy)Entry Points: 160.60 ~ 160.80 USDT Batch Pending Order Entry
Take Profit Target: 161.40 ~ 161.60 USDT Interval Gradual Take Profit
-Close all positions if you reach the take-profit limit, and don't get attached to the battle.-
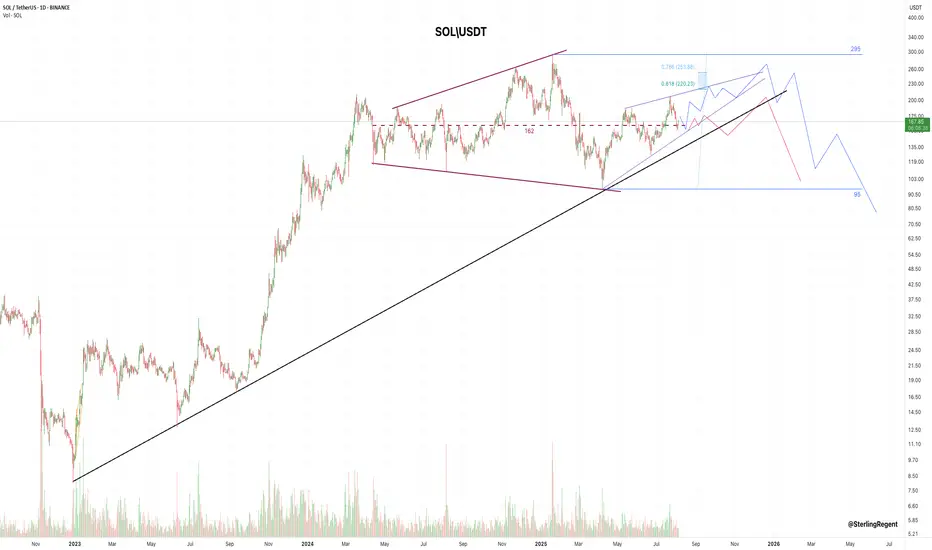
SOLUSDT: The Bears' Defense Holds Firm at the Golden Ratio. SOLUSDT: The Bears' Defense Holds Firm at the Golden Ratio. What's Next?
The Solana market has undergone a significant correction from its all-time highs, and the recent price action suggests the downtrend may not be over. The current structure is defined by a clear rejection from a formidable resistance zone, signaling that sellers remain in control for now.
The Bearish Rejection & Crucial Resistance 🔴🚨
Following the initial sharp decline, price made a notable attempt at a recovery, forming a rising intermediary support trendline. However, this recovery rally was decisively halted at a critical level—a confluence of a Crucial Resistance Zone and the 0.5 to 0.618 Fibonacci retracement levels. This red zone, from approximately $195 to $218, has proven to be a major supply area. The recent price action saw a strong rejection from this region, with the price now breaking below its intermediary support trendline.
The Breakdown of Intermediary Support 📉
The rising white trendline, which had provided support for several months, has been broken. This breakdown is a significant bearish signal, indicating a loss of momentum and a potential shift in the short-term trend from bullish to bearish. This event increases the probability of a move toward lower support levels.
The Ultimate Line in the Sand: Long-term Support 💪🟢
Should the current bearish momentum continue, the next major demand zone is the Long-term Support area, a wide green band from approximately $100 to $120. This region has historically served as a strong base of support and represents the last major line of defense for the bulls. A test of this zone would be a significant event, and a break below it could lead to further extended declines.
What to Watch For: The Path to Bullish Confirmation 🚀
For the sentiment to turn definitively bullish, Solana needs to demonstrate a new wave of buying power that is strong enough to overcome the current overhead resistance. The market must see a sustained break and close above the Crucial Resistance Zone ($195-$218), specifically above the 0.618 Fibonacci level. A successful push above this formidable barrier, especially with strong volume, would invalidate the current bearish outlook and signal a potential move toward new highs. Until then, the path of least resistance remains to the downside.
Disclaimer:
The information provided in this chart is for educational and informational purposes only and should not be considered as investment advice. Trading and investing involve substantial risk and are not suitable for every investor. You should carefully consider your financial situation and consult with a financial advisor before making any investment decisions. The creator of this chart does not guarantee any specific outcome or profit and is not responsible for any losses incurred as a result of using this information. Past performance is not indicative of future results. Use this information at your own risk. This chart has been created for my own improvement in Trading and Investment Analysis. Please do your own analysis before any investments.

SOL - He is Soul-less now!SOL - being moved to the point but i think it will retrace back and ideal buys positions are not intact!

two important level keywe stuck in two level important main support in 61.8 fib 157 and daily resistance in 167 i think market will try resistance three time and will try two time resistance in 167 and bullish trend is start