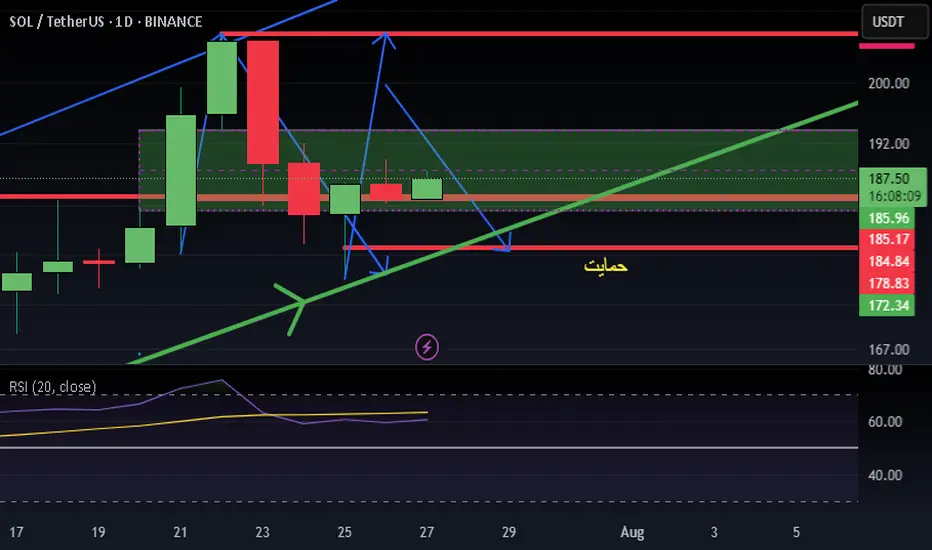
waiting for a bullish candleif a bullish candle complet we have morning star three candle we could hope next target is 164 and 168 !
SOLUSDT trade ideas

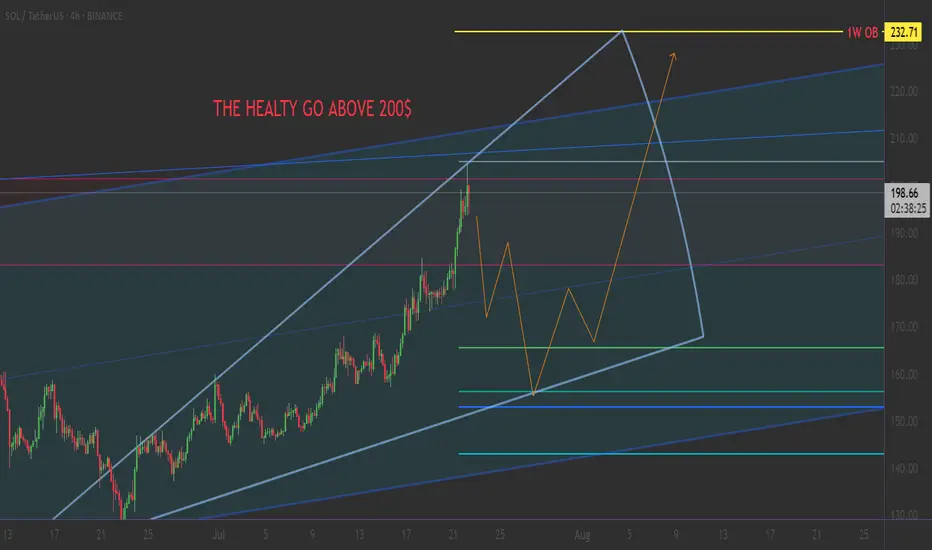
SOLANA: THE ULTIMATE TECHNICAL CONVERGENCE..📊 THE TRADING PLAYBOOK
🛡️ CONSERVATIVE SUPPORT PLAY
Setup: Buy at Fibonacci support levels🚨
Entry: $158-$165 (0.618-0.5 zone) 🌟
Stop: $140 (Below all major support) ❌
Target:
Tp1 : $200(25% gain) 💰
Tp2 : $232 (40% gain) 💰
⚡ Position Size: 3-5% of portfolio ⚡
Time Horizon: 3-6 weeks 🎯
______ NOTE _______
DYOR ⚠️ Not financial advice. This analysis is for educational purposes only. Always do your own research and never risk more than you can afford to lose.
#SOLANA #SOL #SymmetricalTriangle #Fibonacci #Breakout #Crypto #TechnicalAnalysis #AltSeason #DeFi #MemeCoins #TradingSetup
Downtrend not over yet !First upside attact till $171.
Then continue about to $150.
Up for 2 days, down for 2-4 days last time before the next mid term uptrend.

SOL BEARISH CONTINUATIONAs the market continues to create new lows, something caught my eye.
3 areas of unwicked impulsive moves (FVG's) lying around 165.18 - 166.80, 167.65 - 169.69 and 170.32 - 172
With this, I identified two order blocks
.
I'm traditionally wired to prefer the latter because there's more confluence factors;
A liquidity pool 169.70 - 170.3 established by price struggling to close above that level followed immediately by a FVG into an OB.
Price would have an instant reaction downwards if it traded to those levels.
However, the buying pressure might not be sufficient to push price to those levels before the crash.
Hence the other order block.
I'd be paying close attention to observe how it plays out.
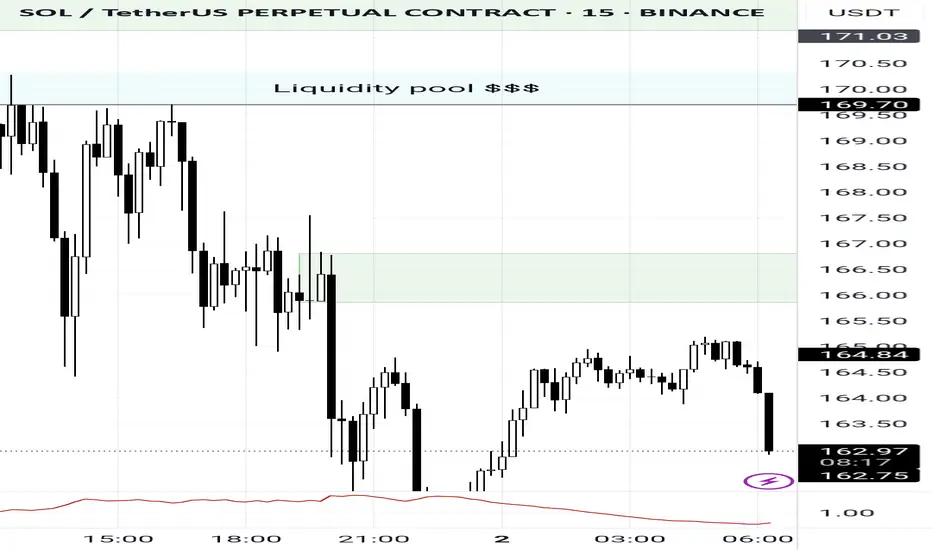
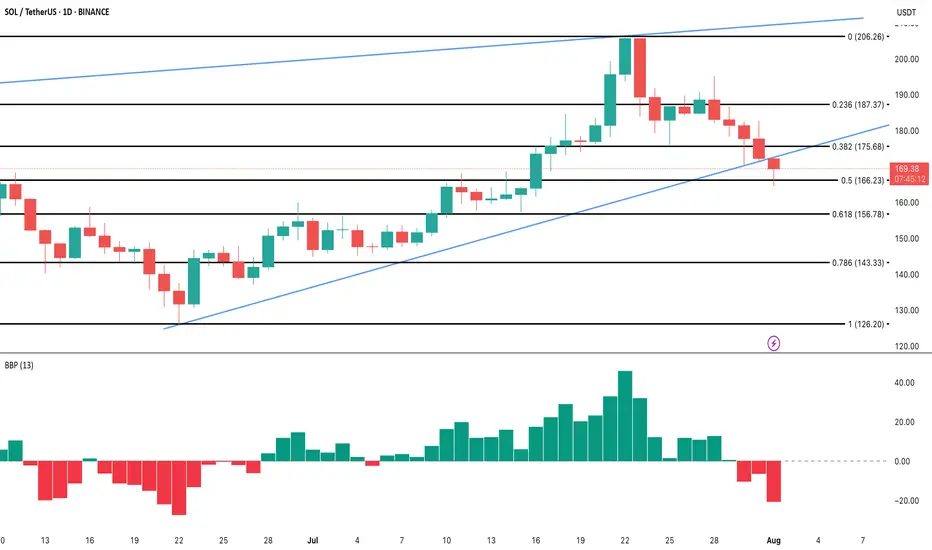
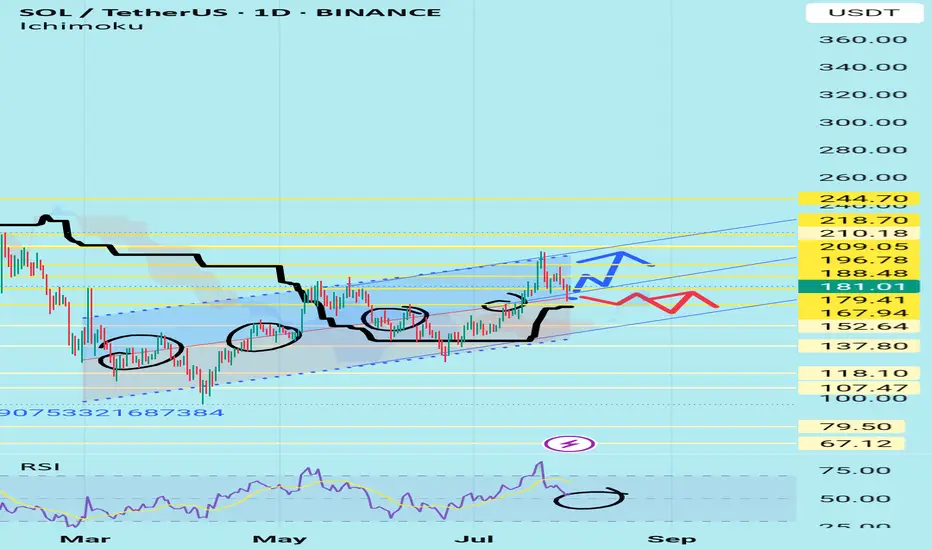
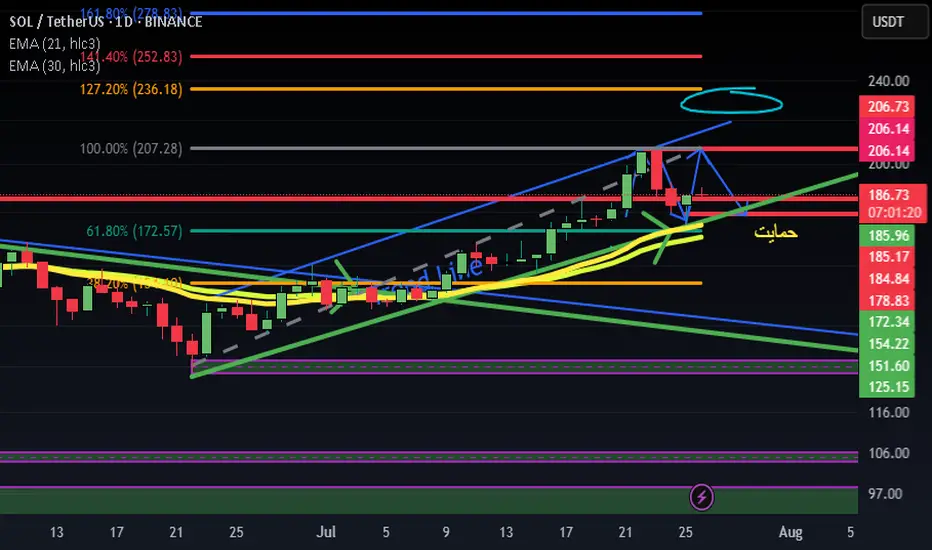
Chart Overview (SOL/USDT – 1D, Binance)Key Insights:
Support Zone: Around $160–165, aligning with Ichimoku support lines.
Fibonacci Levels: Price broke above the 1.618 level (~$175) and is now retesting.
Indicators Below: Showing a strong bullish crossover, supporting upward momentum.
Target Path: Drawn to reach $223, then $240–260 if bullish trend continues.
📈 Bullish Scenario:
Bounce from $160–165 zone
-Short-term target: $195–200
-Mid-term target: $223
-Long-term: $240–260
📉 Bearish Scenario:
If $160 support breaks:
Next support levels: $145, then $122
Worst-case retest: $95
✅ Conclusion:
Crucial zone now: Either a strong bounce or a bearish breakdown.
Current indicators and structure favor a bullish continuation if support holds.

SOL/USDT: High-Probability Long from Major Support OversoldHello traders,
Here is a detailed analysis for a potential long setup on SOL/USDT (4H Chart). This trade idea is based on a strong confluence between my LSOB price action indicator and the MC Orderflow momentum oscillator.
1. Trend & Context (The "Why")
The overall structure on the 4H chart has recently shifted bearish, confirmed by a Bearish Change of Character (ChoCh). However, the price has now pulled back into a major area of interest where a bullish reversal is highly probable.
Here are the key confluence factors for a long entry:
Major Support Level: Price is currently reacting to the EMA 400, a significant long-term moving average that often acts as strong dynamic support.
Liquidity Sweep: We have a clear Liquidity Sweep (LQDT) below the recent lows, which is a classic institutional tactic to grab stop losses before a potential move in the opposite direction.
Momentum Exhaustion (MC Orderflow): This is the most crucial confirmation.
The MC Orderflow oscillator is deep in the OVERSOLD territory (below 20), signaling that downside momentum is exhausted.
The MTF Cycle Table provides powerful confirmation: both the 4H and Daily timeframes are showing an "Oversold" status. When higher timeframes align like this, the probability of a reversal increases significantly.
2. Entry, Stop Loss, and Targets (The "How")
While the signals are strong, a disciplined entry strategy is key.
Entry: Look for an entry around $168 - $170. A safer confirmation would be waiting for the MC Orderflow oscillator to cross back above its yellow moving average.
Stop Loss (SL): $165.50. This places the stop just below the wick of the recent liquidity sweep, invalidating the trade idea if that low is broken.
Take Profit (TP) Targets:
TP1: $178.00 (Confluence of the Bearish ChoCh level and the 50/100 EMAs).
TP2: $192.00 (Targeting the next significant swing high/resistance area).
TP3: $202.00 (Long-term target at the major LSOB supply zone).
Conclusion
This setup presents a favorable risk-to-reward opportunity. The combination of a price action liquidity sweep into major MA support, confirmed by extreme multi-timeframe oversold readings on the MC Orderflow oscillator, creates a high-probability environment for a bullish reversal.
Disclaimer: This is not financial advice. This analysis is for educational purposes only. Always conduct your own research and manage your risk appropriately.
SOL/USDT Analysis – Breakdown or Bear Trap in the Making?The BINANCE:SOLUSDT price has tumbled more than 7.5% in the last 24 hours, breaking below its ascending wedge support on the daily chart. This technical breakdown has shifted market sentiment, with bears now pressing for deeper losses.
The Bull-Bear Power Index has flipped negative for three straight sessions, its longest bearish streak since June. This confirms growing sell-side dominance as BINANCE:SOLUSDT trades around $169, clinging to key support at $166. A clean break below this level could open the way to $156 or even $143, extending the downtrend.
While BINANCE:SOLUSDT price action dominates the picture, network demand has also weakened, with active addresses falling sharply since July’s highs. This dip in participation aligns with the breakdown, hinting that buyers lack the strength to defend key levels. Meanwhile, liquidation data shows that shorts significantly outweigh longs, adding pressure as bearish positions accumulate.
For this to become a classic bear trap , bulls need a swift rebound above $175–$180, forcing shorts to unwind and flipping momentum back positive. Until that happens, the technical setup and order flow favor bears, keeping downside risk firmly in play.
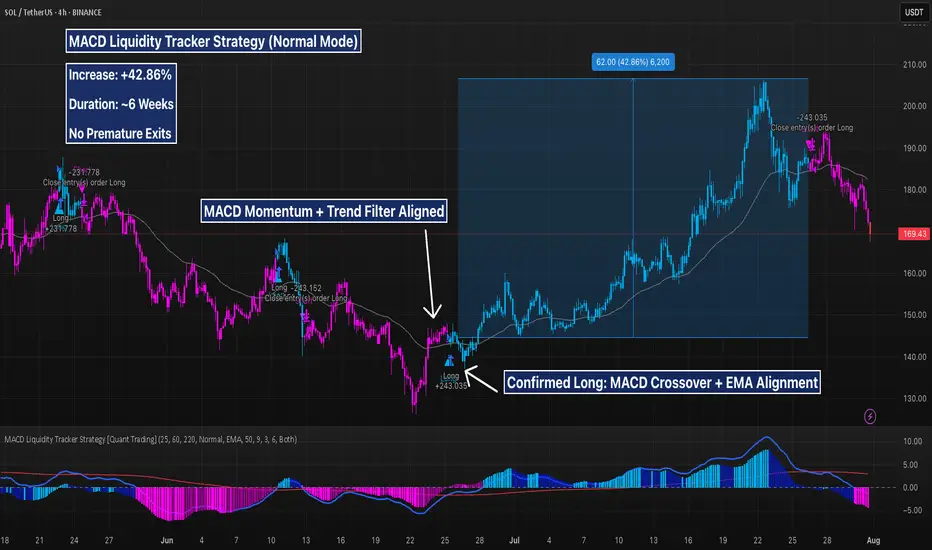
SOL 4H – 42% Win From Trend Filtered MACD Entry, But Is MomentumSOL just delivered a textbook 42.84% rally using the MACD Liquidity Tracker Strategy (Normal Mode). Entry was triggered once MACD momentum aligned with the 60/220 EMA trend filters — a clean breakout from consolidation with no noise or fakeouts.
The system captured the full leg up from ~$143 to over $205, holding through the expansion phase and exiting as bearish momentum began to show. Now, price has dipped below key EMAs and MACD is printing red — signaling a possible shift in structure.
📉 Will bulls defend the $165–$170 zone, or is a deeper pullback on deck?
📊 Strategy Settings:
MACD: 25 / 60 / 220
Trend Filter: 60 & 220 EMA
System Mode: Normal
Timeframe: 4H
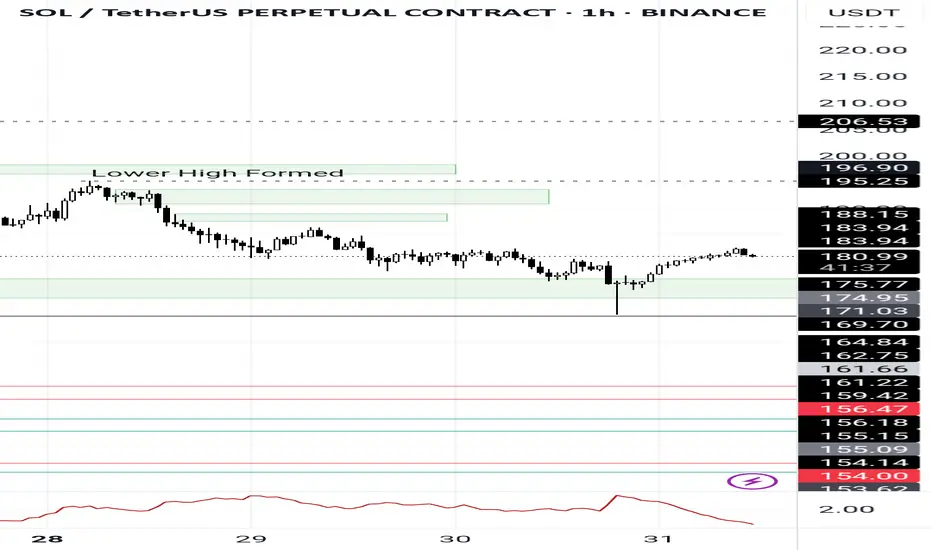
BEARISH TREND STARTI SEE ll and lh is bearish trend start ? just look at the hight and low its make ll and lh resistance area is about 182 support area is 170 to 172

SOLUSDTSix potential targets for SOL. I personally am bullish on SOL, but the price action confirms the final price.

Short Executed alreadyAs I predicted the liquidity pool was raided but it didn't go back to my entry before running.
Congratulations if you got in at market entry
SolusdtHi snipers. On the one-day timeframe, the price is fluctuating in an ascending channel. It has now reached the middle line of the channel and the 103-day moving average support line is below it, which will help the price to move up again and reach the channel ceiling. If this support is broken, the price is likely to fall to the channel floor. This analysis is just a possibility. It is not a trading recommendation.
SOL ideas, which one you think gonna play? green or blue?SOL and crypto likely in the last corrective wave before going much higher

Weekly trading plan for SolanaLast week BINANCE:SOLUSDT played out perfectly according to our orange scenario. Currently, we're in a correction phase, trading below the key weekly reversal level at $190
Key Observations:
Bullish divergence forming on the hourly chart
But 4-hour chart shows further downside potential
Critical Levels:
Break above weekly pivot + trendline → Targets $220
Failure to reclaim above hourly MAs → Opens path to $160
Trade carefully - this could go either way

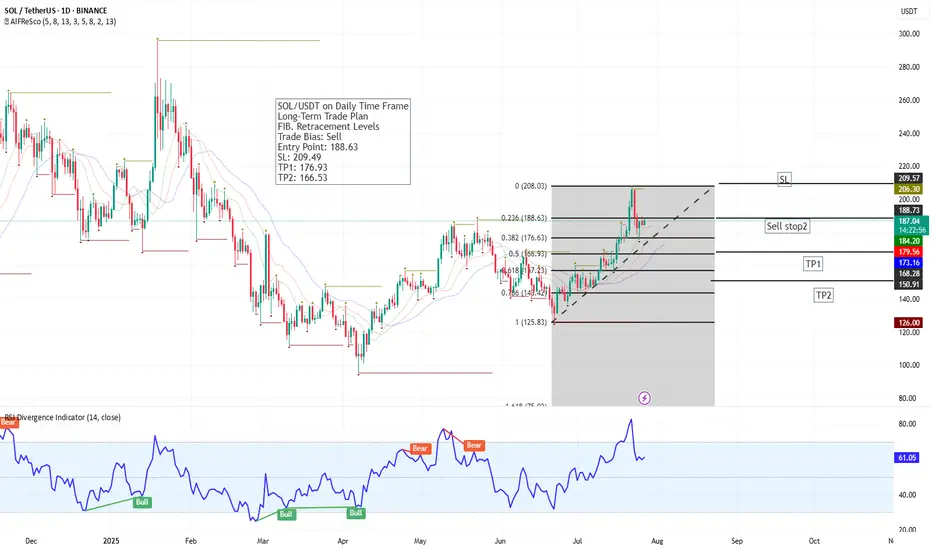
SOL/USDT – Daily Chart | Long-Term Fibonacci Sell SetupSOL has completed a strong bullish leg and is now reacting from the 0.236 Fibonacci retracement level at 188.63. A sell setup is developing based on this resistance zone and weakening momentum.
🔻 Trade Plan:
Sell Stop: 188.63
SL: 209.49
TP1: 176.93 (38.2% Fib)
TP2: 166.53 (50% Fib)
📉 RSI at 61.02 shows early signs of a bearish divergence. If price loses momentum at current levels, this setup could offer a solid retracement trade toward the mid-Fibonacci levels.
Watch for breakdown confirmation and manage risk accordingly.
new theoryi have new theory i change rsi lenght to 1 and i see over buy and over sell zone in short term what your idea when rsi reach above 70 we sell and open a short position after reach over sell zone we close the sell position and open a long position in future we make big money
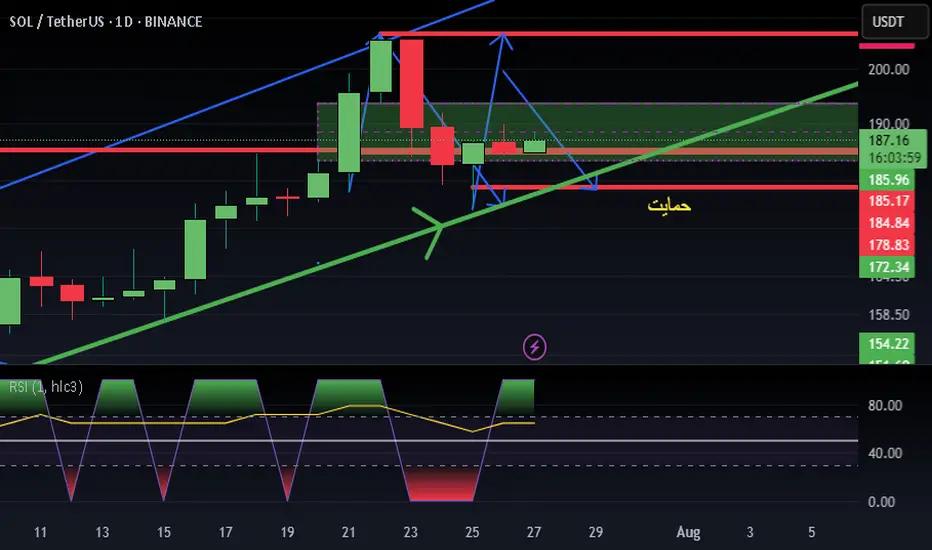
signal of buyingthis is morning star we need this cadle! i see a morning star candle in one day
this is strong bulish signal what is your idea>?

Solusdt bullish daily time frame A bullish iH&S/cup&handle pattern is forming. A close above 168 may activate the pattern.
Targets are 180, 200 and 220
Invalidation if closes below 157

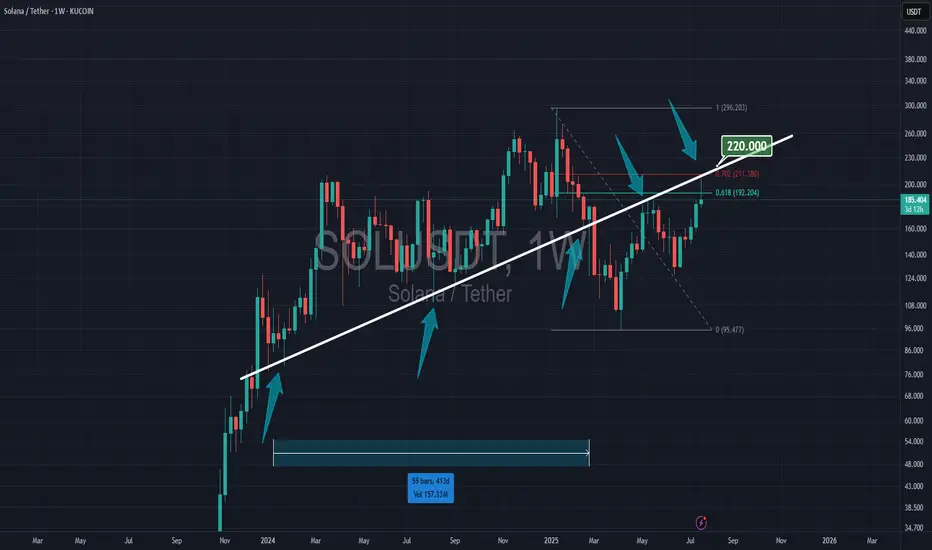
SOLANA & 220 RESISTANCESolana is at 61% of Fibonacci, and the trendline has held since early 2024. To stay in the bull run, Solana must break the 220 resistance.
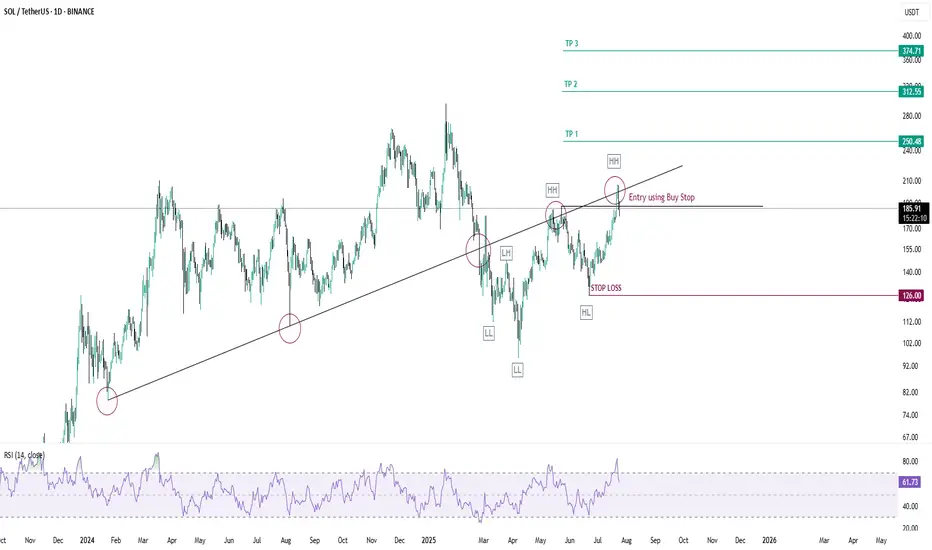
SOLUSDT-LONG IDEASOLUSDT has broken its trendline toward downside and now the structure is broken forming a higher highs and higher lows and reason behind its rejection is trendline but the structure is clearly bullish, trendline has gotten tapped two time now it has become weak take your entries using buy stop order it will give you great return again its a positional trade so if you have patience only then take this trade it will not gonna boom overnight stop loss entry and take profit points are mentioned in the chart.
need a green candleif a green candle apear we se morning star candle but hope still not dea!just a green candle
