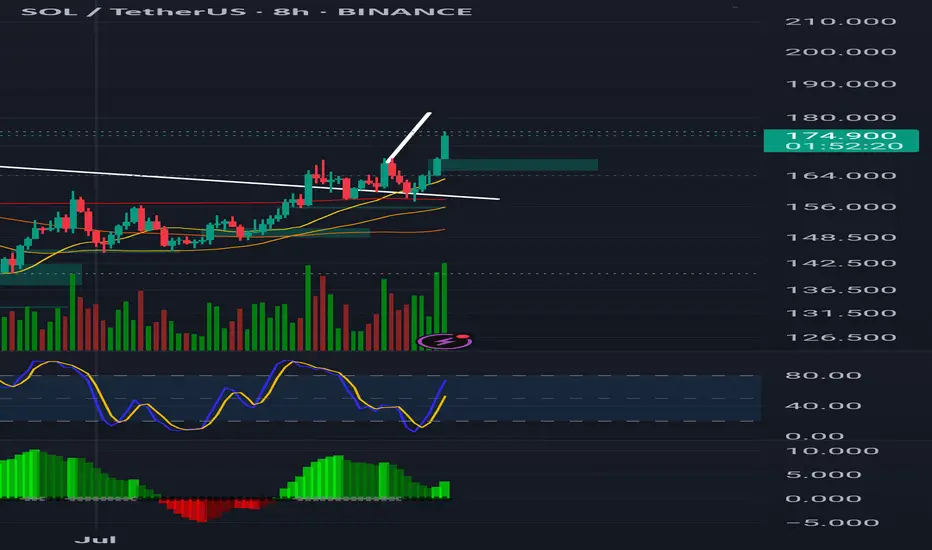
Solana starting to look bullish again | Target $180 - $260In my previous idea, I anticipated a liquidity hunt below the $140 level, and price action played out exactly as expected. SOL wicked below this key support zone, triggering stop-losses and inducing panic selling — classic behavior before a major reversal. Following this sweep, price quickly reclaimed the range, breaking out of the downward channel, and is now retesting a bullish break of a textbook cup-and-handle pattern, signaling a potential trend continuation to the upside.
📊 Technical Setup
Cup and Handle formation is evident, with the "handle" forming as a downward-sloping channel now being challenged.
Price reclaimed the $140 demand zone post-sweep and is now retesting.
Target zones: $180 → $220 → $260 based on historical resistance levels and measured move projections.
📉 Invalidation Level
A daily close below $120 (marked as the Invalidation Zone) would invalidate this setup and suggest bulls have lost control.
🌐 Macro Perspective
Fed Rate Cut anticipation and cooling inflation data are helping risk-on assets like crypto regain momentum.
SOL staking ETF launching this week, while SOL spot ETF approval imminent.
Solana's growing DeFi ecosystem, along with high TPS performance and low fees, continues to attract developer and user activity. SOL remains a top candidate for sector outperformance in a bullish H2 crypto cycle.
📌 Conclusion
With market structure turning favorable and strong macro tailwinds, SOL may be gearing up for a major breakout rally. Watch the $160 level closely — a decisive break and hold above could confirm the next leg higher.
SOLUSDT trade ideas

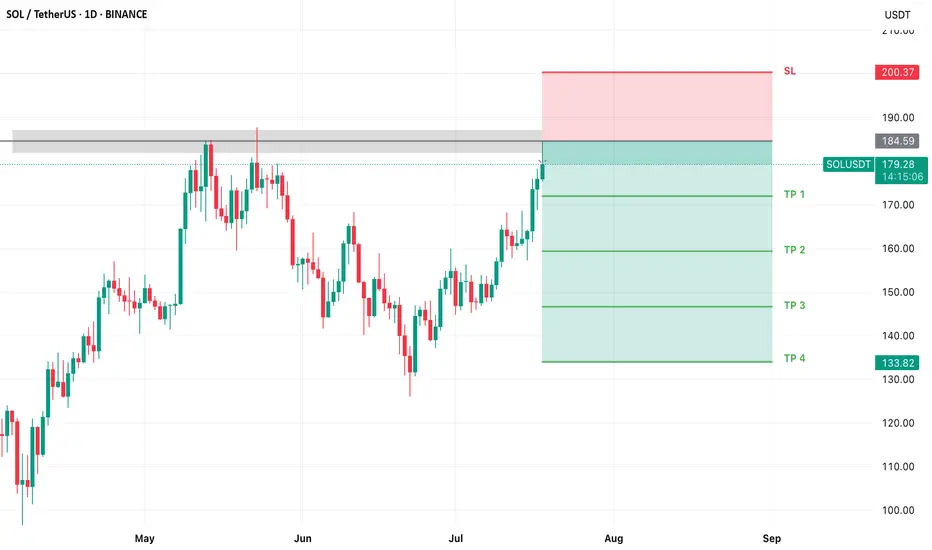
SOL USDT SHORT TRADE SETUPTechnical Analysis: SOL/USDT is currently holding at a strong resistance zone, with a high probability of an downward price move. With a very good risk reward trade.
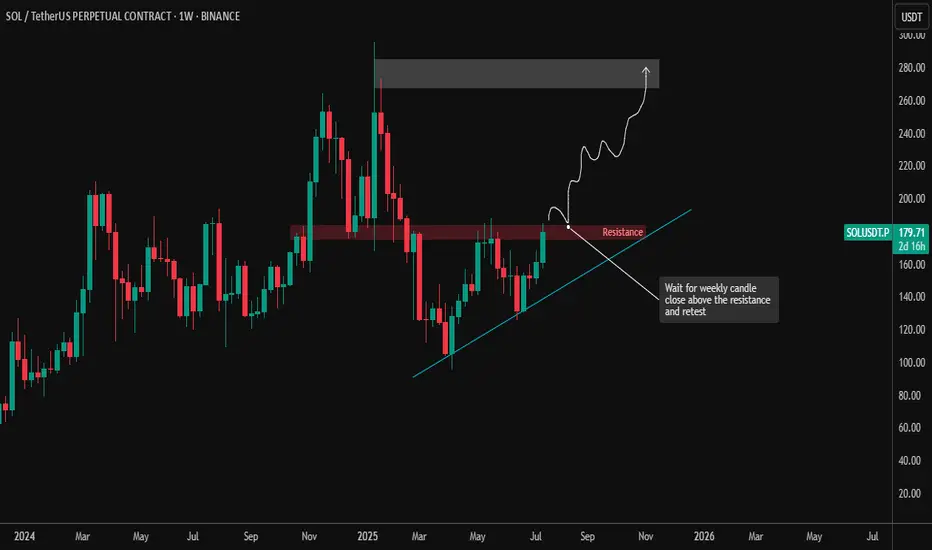
SOL/USDT – Weekly Chart Analysis (July 18, 2025)Solana is at a critical breakout point as price pushes against a long-standing horizontal resistance zone between $175–$180. This zone has been tested multiple times since late 2024, making it a significant level to watch.
🔹 Current Price: ~$179.66
🔹 Resistance Zone: $175–$180
🔹 Next Major Supply Zone: $260–$290
🔹 Trendline Support: Still intact and respected since the Q2 lows
📌 Key Setup:
SOL is attempting a breakout above the horizontal resistance.
Price structure shows a series of higher lows, indicating growing bullish momentum.
A weekly candle close above $180 followed by a successful retest would confirm the breakout and could open up upside toward the $260–$290 zone.
📈 Trade Plan:
Breakout Entry: After a confirmed weekly close + bullish retest of $175–$180
Invalidation: Break below trendline and failure to hold above $160
Target: $260–$290 zone, where previous supply stepped in
🧠 Patience is key: Wait for confirmation and don’t chase breakout candles. This level has historically acted as a trap — confirmation is critical for safer entries.
#Solana #SOLUSDT #CryptoTrading #TechnicalAnalysis #Altcoins #Binance
DeGRAM | SOLUSD seeks to confirm the breakout📊 Technical Analysis
● Bulls pushed back inside the broad rising channel and pierced the five-week gray trend-cap; the breakout has been retested at the 147-150 pivot (green strip), now acting as support.
● Price is carving a tight bull-flag on diminishing volume; its 1.618 swing and the channel median intersect with the May swing high near 173, while the upper rail aligns with 187-190.
💡 Fundamental Analysis
● VanEck’s late-June 19b-4 filing for a US spot Solana ETF trimmed perceived regulatory risk, and Firedancer’s public test-net timeline lifted developer sentiment, both fuelling fresh inflows.
✨ Summary
Long 147-150; flag break above 155 targets 173 → 187. Invalidate on a 16 h close below 140.
-------------------
Share your opinion in the comments and support the idea with a like. Thanks for your support!

#SOL Update #5 – July 18, 2025#SOL Update #5 – July 18, 2025
Solana has returned to the region where its last impulsive move was formed. It appears to be attempting another bounce, but when we look at the SOL/BTC pair, it is currently facing a strong resistance zone.
There isn't much room between this resistance and the 200 MA band, which makes this a critical decision zone. At the moment, I do not recommend entering either a Long or Short position — it’s best to wait and observe.
If Solana breaks out to the upside, the next target will likely be $179.

SOL ANALYSIS🔮 #SOL Analysis 💰💰
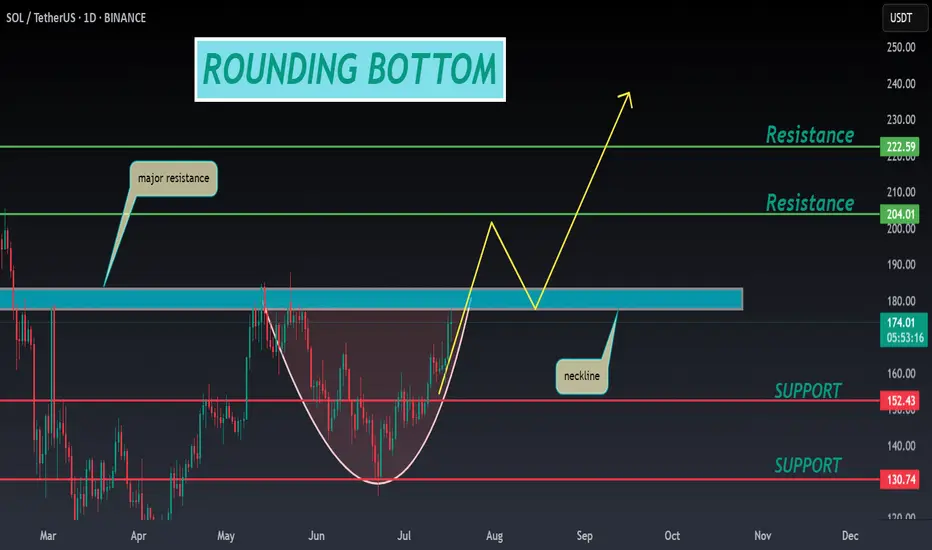
📊 #SOL is making perfect and huge rounding bottom pattern in daily time frame, indicating a potential bullish move. If #SOL retests little bit and breakout the pattern with high volume then we will get a bullish move📈
🔖 Current Price: $173.75
⏳ Target Price: $204.00
⁉️ What to do?
- We have marked crucial levels in the chart . We can trade according to the chart and make some profits. 🚀💸
#SOL #Cryptocurrency #Pump #DYOR
SOL - Excellent Trade Opportunity- Trade is giving us a trade with huge potential with huge risk reward ratio.
- Currently price is heading towards teh support around 160 range and this is strong support zone.
- I'm expecting price to bounce back from this zone and head towards the next target of 200 range
Entry Price: 163
StopLoss: 148
TP1: 172
TP2: 182
TP3: 200
Stay tuned for more updates.
Cheers
GreenCrypto

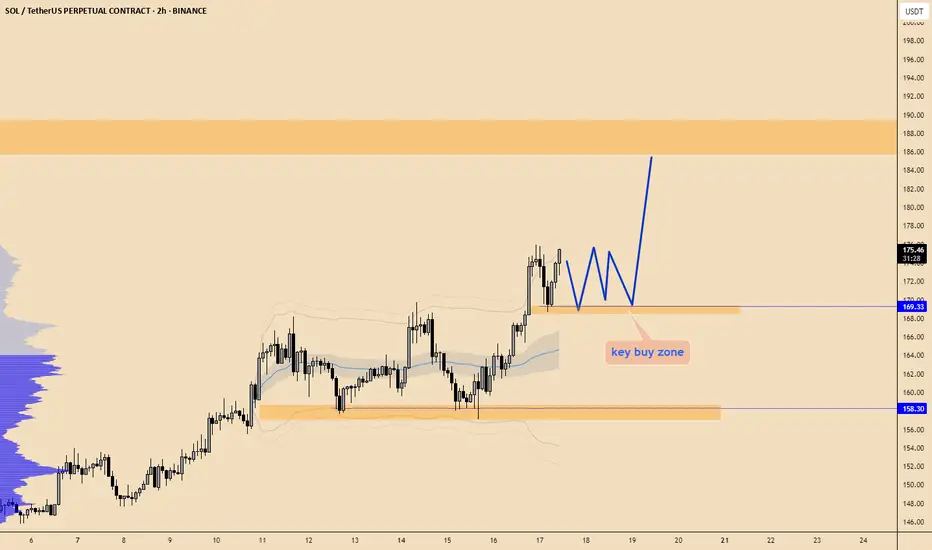
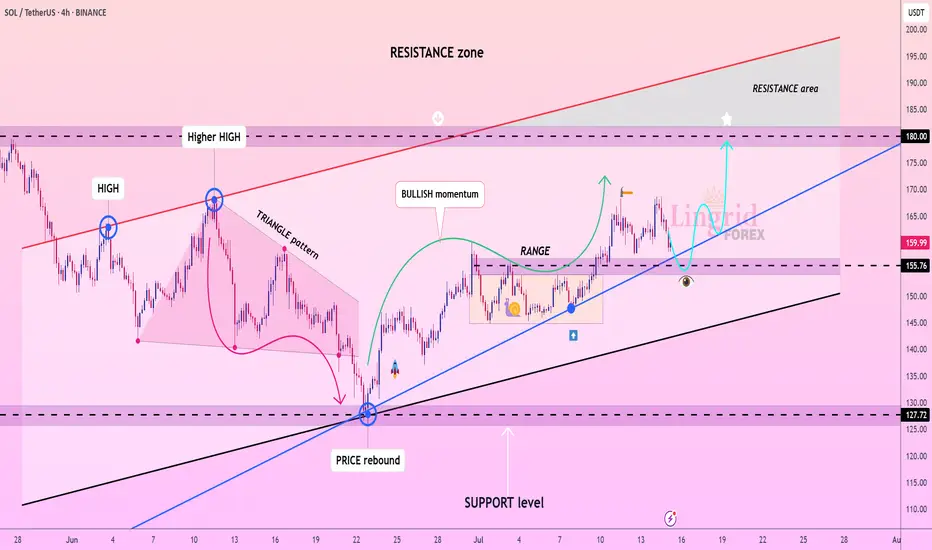
Lingrid | SOLUSDT trend Continuation TradeThe price perfectly fulfilled my previous idea . BINANCE:SOLUSDT found strong support around the 155.7 level after a brief pullback and continues to respect the ascending blue trendline. The previous bullish impulse followed by a healthy consolidation suggests a classic trend continuation structure. If buyers defend the current demand zone and reclaim upward momentum, a move toward the 180 resistance zone is likely. This setup aligns with broader bullish market structure and rising channel dynamics.
📉 Key Levels
Buy trigger: confirmed bounce from 155.7 trendline support
Buy zone: 155.7–158.0 (range floor and trendline confluence)
Target: 180.0
Invalidation: breakdown below 155.0 signals structure shift
💡 Risks
Volatility around trendline retest could trigger stop hunts
Failure to reclaim momentum above 165 may lead to ranging
Sudden market-wide weakness could pressure altcoins broadly
If this idea resonates with you or you have your own opinion, traders, hit the comments. I’m excited to read your thoughts!
Solana - The Cup is Almost FullSolana is printing a textbook cup & handle formation on the daily, and price is now pressing against the neckline resistance near $185, just below the psychological $200 zone.
This structure reflects months of accumulation and rising momentum. A confirmed breakout above the $185–$199 resistance would likely trigger the next upward leg.
This setup signals trend reversal continuation, and if SOL closes above $199 on high volume, momentum traders may pile in quickly.
📌 Invalidation below $150 = pattern risk-off.

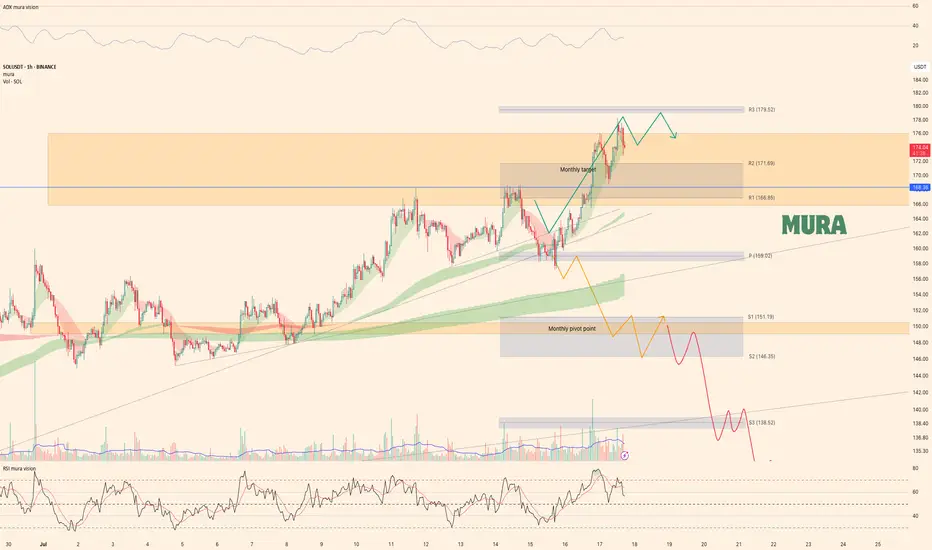
Solana - Weekly Technical UpdatePrice Action Summary:
Successfully met our weekly expectations following a minor correction
Broke both local trendlines and the weekly pivot point
Reclaimed position above weekly pivot during the bullish MA crossover (optimal long entry per plan)
Currently trading slightly above second monthly target at $175.9
Third weekly target remains active while price holds above $168.3
Technical Observations:
1 Momentum Warning Signs:
Trend weakening (declining ADX)
Bearish RSI divergence forming
2 Key Levels:
Upside: Weekly target continuation above $168.3
Downside: Potential correction if divergence confirms
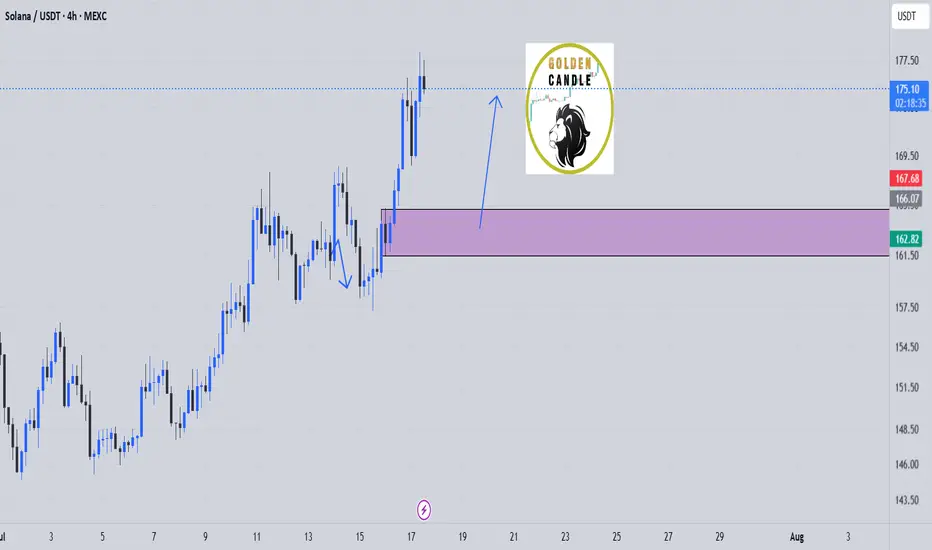
sol buy midterm"🌟 Welcome to Golden Candle! 🌟
We're a team of 📈 passionate traders 📉 who love sharing our 🔍 technical analysis insights 🔎 with the TradingView community. 🌎
Our goal is to provide 💡 valuable perspectives 💡 on market trends and patterns, but 🚫 please note that our analyses are not intended as buy or sell recommendations. 🚫
Instead, they reflect our own 💭 personal attitudes and thoughts. 💭
Follow along and 📚 learn 📚 from our analyses! 📊💡"
SOL/USDT : SOL Rebounds Strong – Is a 25% Rally Just Beginning?By analyzing the Solana (SOL) chart on the daily timeframe, we can see that after dropping to the $147.75 zone, the price experienced renewed buying pressure and has since rallied to around $159, delivering over 6% return so far.
This cryptocurrency shows strong bullish potential, with short-term gains possibly exceeding 25%.
The next upside targets are $168.5, $187, $220, and $263.
Please support me with your likes and comments to motivate me to share more analysis with you and share your opinion about the possible trend of this chart with me !
Best Regards , Arman Shaban

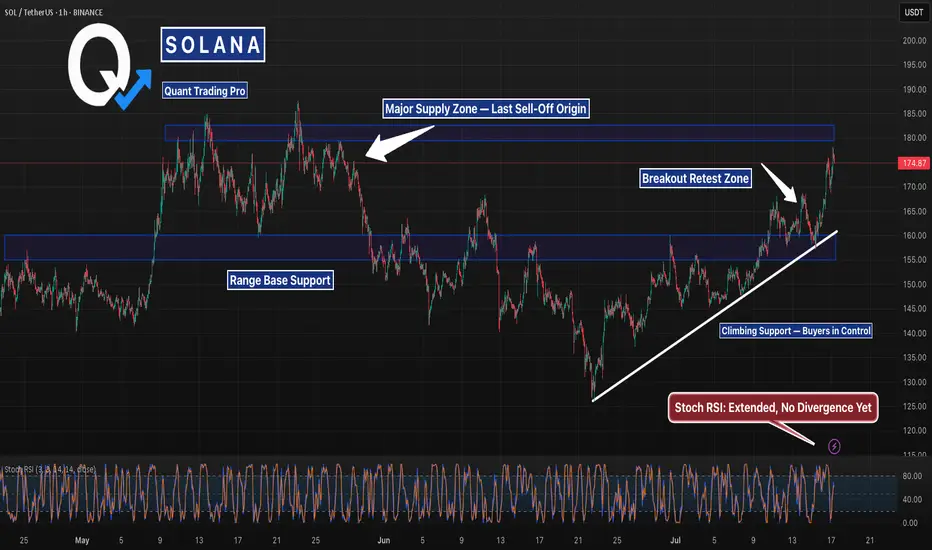
SOL Back at the Same Level It Dumped From — But with BackupSOL is right back where the last major dump started — but the structure this time is way cleaner. Higher lows, trendline support, and strong momentum behind the push.
If it clears this zone, we could see fireworks. But don’t fade resistance this thick without confirmation.
#Solana #SOLUSD #CryptoCharts #BreakoutWatch #ChartAnalysis #TrendlineSupport #CryptoTraders #QuantTradingPro #TradingView
SOL will continue its pattern till the endSince the start of Altseason, CRYPTOCAP:SOL has formed a swing channel in 4H time and has continued it for about a month. You should be aware of breaking the support line, as it will likely mark the end of the SOL rally.
Solana Update: Miss This Analysis, Miss the Next Leg!Hey, I’m Skeptic! 🩵 Solana’s recently kicked off a strong uptrend momentum , and there are solid triggers waiting to activate that could bring good profits. In this analysis, I dove into Solana on weekly, daily, and 4-hour timeframes, and checked SOLBTC and BTC.D too, to get a grip on the current liquidity flow.
💬What’s your trigger on Solana? Drop it in the comments, and if you want an analysis on a coin, write it for me so I can check it out.

SOLUSDT SELLGiven the resistance levels and the hidden divergence, it returned to the previous support level.
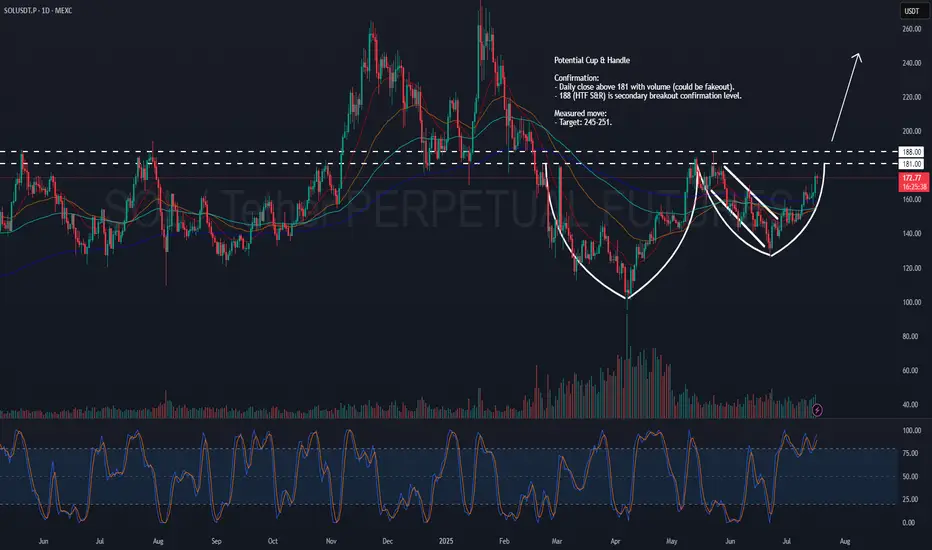
SOL – Potential Cup & HandleSOL might be shaping up to be a pretty clean cup & handle .
Could be big, but we’re not there just yet.
Levels I’m watching:
181: Main neckline. Want to see a daily close above with volume.
188: HTF S&R — secondary confirmation. Clears this, and I’d say the move is real.
Measured target:
Somewhere around 245–251 if it plays out.
Let’s see if SOL has more in the tank.
SOLUSDTThis chart BINANCE:SOLUSDT say to me that change of character. But we need to best confirmations for buy for example: pollback to 143 - 147 $ and higher high next pollback to level.
Support: 147 - 143 - 131.50
Resistance: 158 - 170 - 177 - 183
⚠️Please Control Risk Management in trades.


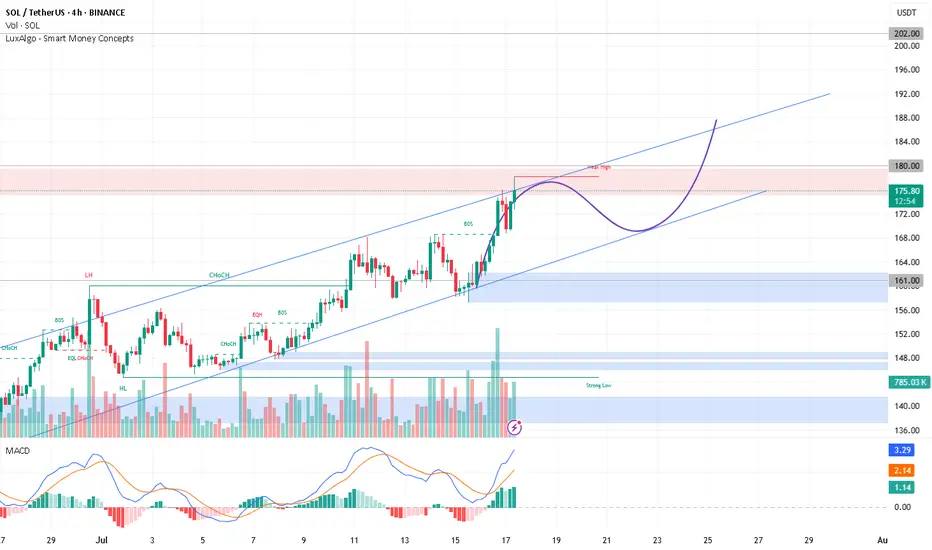
Solana should have another leg on this push.Solana needs to show strength by finishing this push with one more left taking us to 184 before consolidating there.
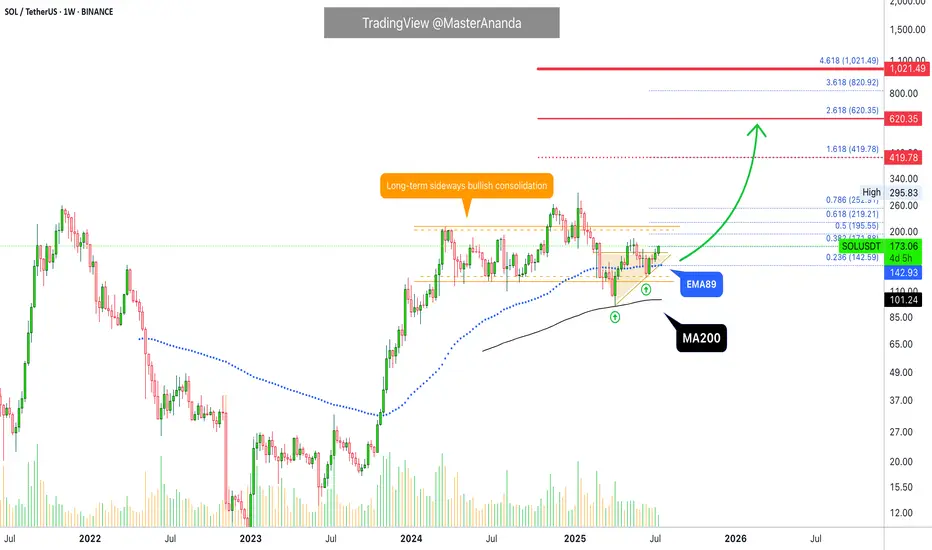
Solana Ultra-Bullish Above MA200 & EMA89 · $1,000 ExplainedOne guy was saying Solana was set to move lower because it already produced a "3,000% bullish wave." What nonsense... Solana is ultra-bullish. We don't do an analysis based on some unintelligent assumption rather, we focus on the data, the signals, the indicators, the chart.
Solana corrected and found support perfectly, exactly at MA200 in April 2025. Boom! It never went below so it was never bearish to start. A true long-term bull market a la Bitcoin.
And more recently, on the 16/23-June weeks, it traded briefly below EMA89 just to recover and later start rising. This is a strong bullish signal on its own. The fact that bears tried to push prices lower and failed; bullish. The fact that there is a strong higher low between the test of MA200 and EMA89. The fact that we can make mistakes with our interpretations but the chart is never wrong.
The fact is that Solana is going up with the next easy but strong target being $420. It can reach, later down the road, $620 and even higher to peak at $1,000+. Can you see what I see? Crypto is going up.
Bitcoin is going up. Solana is going up. Ethereum is going up. Cardano is going up. XRP is going up. Dogecoin is going up. We are going up. The new financial market is growing. It is not just these projects but Cryptocurrency will replace the old financial system, this is another fact. The older system will be left behind because Crypto's market cap. will grow so strong and so fast, maybe a 10 years long bull market will do the trick, we will start with four.
If you want to be high more forever rich, buy Crypto. Solana is a good choice.
Thanks a lot for your continued support.
Namaste.
SOL will outperform ETH once againHello, everyone!
⚡️ It's time to take a look at the SOL idea and see how it's doing. Let me remind you that I started building my position at prices of $141 and below.
The first thing we see is that on July 8, the price broke through the six-month sloping resistance and broke the long-term downtrend.
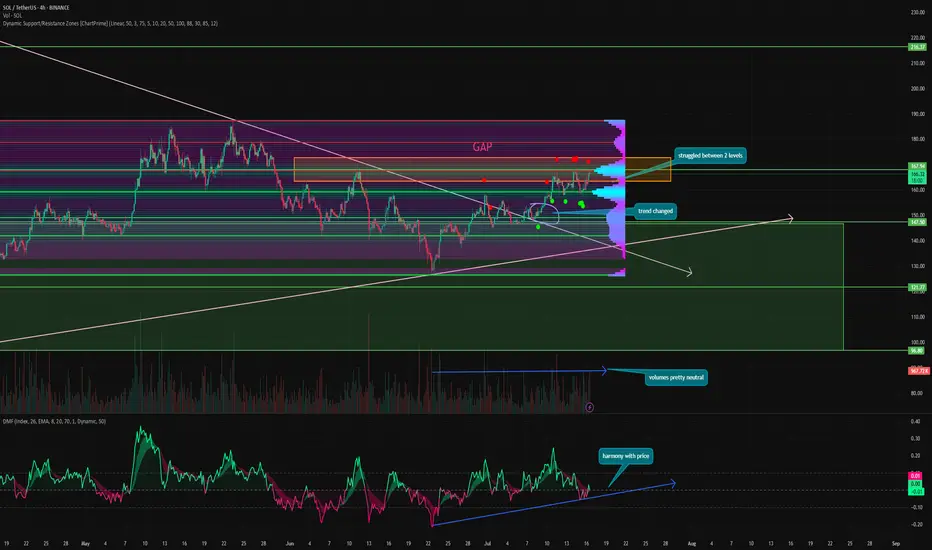
Then, the gap at $172.72 - $163.62 was almost completely closed. It was this gap that attracted the price as the nearest source, and after its closure, this is the first moment when a reversal can be expected.
⚙️ Metrics and indicators:
Volume - purchase volumes remain flat. This signals a lack of interest in the token at this stage. This means that it is not yet close to being overpriced.
Money Flow - in harmony with the price. Liquidity inflows have been continuing for over a month, since the end of the correction.
Support/Resistance - the price has now consolidated above strong local support at $159 and is attempting to break through the next level at $167.99.
After that, there will be another significantly smaller level at $179 and a fairly untraded space, which could trigger parabolic growth.
📌 Conclusion:
So far, SOL is moving completely in line with our expectations from previous ideas. And the lack of high purchase volumes signals that the token is not even close to its euphoria, being so far from its ATH.
And now, when Bitcoin stops growing, liquidity will begin to flow into altcoins, which is already happening gradually. And SOL, for which a decision on the ETF should be made soon. It looks very promising!
Have a nice day, everyone! 🔥