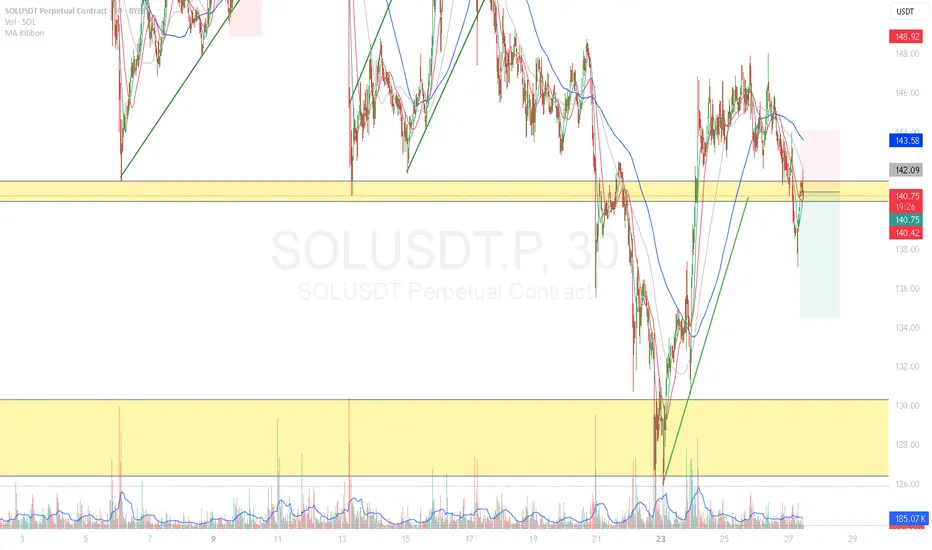
#Sol ShortBias: Leaning bullish short-term (1–3 days), backed by momentum and price structure.
Caution: Funding remains slightly negative—and RSI is near overbought, so a minor consolidation is possible before another leg up.
Trade ideas:
Aggressive: Long near $142–144 with stop below $140, target $150+.
Conservative: Wait for confirmed breakout above $146 before entering long.
SOLUST trade ideas

SOL - It won't take your soul!SOLOLOL - SOL basically can go direct or if not a halt and a move! But all is interlinked and intertwined to btc!

Is SOLANA SOL Ready for a Breakout? Bounce from Falling Channel?
🔍 Chart Pattern and Price Structure Analysis
This chart illustrates a well-formed descending channel (parallel falling channel) that has been developing since mid-January 2025. Currently, the price is approaching the upper boundary of this channel — a key decision area.
🟡 Technical Pattern
Descending Channel: This pattern is characterized by a series of lower highs and lower lows, representing a medium-term bearish trend.
The price is now testing the upper resistance of this channel, a crucial point that could either trigger a breakout or result in another rejection.
📈 Bullish Scenario
If the price successfully breaks out above the upper trendline (around $152–$154), several resistance targets come into play:
1. $164.5 — A minor horizontal resistance and key psychological level.
2. $182.2 — A strong historical resistance zone.
3. $210–$217.8 — A previous consolidation/resistance zone.
4. $237.7, then $261–$280 — Key bullish targets if momentum sustains.
5. Ultimate target near $295.1–$295.7 if broader market sentiment remains strong.
📌 Bullish Confirmation:
Valid daily candle breakout above the channel.
Strong breakout volume.
Successful retest of the breakout area as new support.
📉 Bearish Scenario
If the price fails to break above the channel and gets rejected, we may see a continuation of the downtrend with potential moves to these support levels:
1. $140–$138 — Current minor support zone.
2. $128 — Recent consolidation support.
3. $115.5 — Major support from April.
4. $95.2 — The lowest support zone on the chart.
📌 Bearish Confirmation:
Strong rejection candle (e.g., bearish engulfing) from upper channel.
Weak breakout attempt with declining volume.
Break below the lower channel support or creation of a new lower low.
📊 Conclusion
The current setup is a classic descending channel, indicating a strong mid-term bearish structure.
Price is now at a make-or-break zone — a breakout could signal a trend reversal, while a rejection could extend the current downtrend.
Traders should wait for a confirmed breakout or clear rejection before entering a position.
#SOLUSDT #Solana #CryptoAnalysis #TechnicalAnalysis #DescendingChannel #BreakoutAlert #CryptoTrading #BullishScenario #BearishScenario #Altcoins #CryptoTA

DeGRAM | SOLUSD retest of the 136 level📊 Technical Analysis
● Price bounced at 136 where the rising-channel base meets a long-held internal trend-line, locking in a higher-low and printing bullish RSI divergence.
● A micro falling-wedge is fading; clearance of the wedge roof/150 round turns bias up toward the 158.8 horizontal pivot and the channel mid-band near 187.4.
💡 Fundamental Analysis
● Solana’s daily active wallets and DEX volume have risen ~20 % since 20 Jun as new DeFi incentive programs (Jupiter, Pyth, Kamino) go live, hinting at returning user demand despite broader crypto lethargy.
Summary
Buy 137-145; confirmed break above 150 targets 158.8 → 187.4. Long thesis voided on a 16 h close below 130.
-------------------
Share your opinion in the comments and support the idea with a like. Thanks for your support!

Weekly trading plan for SolanaLast week, the downtrend continued, but after the weekend, the price staged a fast recovery. Right now, it’s trading above the weekly pivot point but hasn’t managed to break the descending trendline yet. We might see a short pullback before another push higher toward the weekly targets and the monthly pivot. However, if negative news hits or the price shows weakness after breaking the weekly pivot, we could get another leg down toward the 3rd monthly target
Write a comment with your coins & hit the like button and I will make an analysis for you
The author's opinion may differ from yours,
Consider your risks.
Wish you successful trades ! mura

SOL Long Idea Going Pretty WellTime Frame - D
Confluences
Turtle Soup
EOB
Breaker Block Confirmation
Retest of EOB
I am targetting atleast 158. Ideal entry was around 142.
#NFA, #DYOR

Give me your SOL!!SOL not SOUL!! Just look at it and understand your stances whats gonna happen if it happens!

The price can reach $160-170 and then drop to $80-90.The price can reach $160-170 and then drop to $80-90.
If you want to invest, this is not a good place to enter.
It is a downtrend.
Please do not buy on the downtrend.
you must think to Short in downtrends.
Let it go lower and buy when change to bullish.

sol updateentry price 169.14
stop loss update 169.14
take profit
160.1
145.1
131.5
result full target

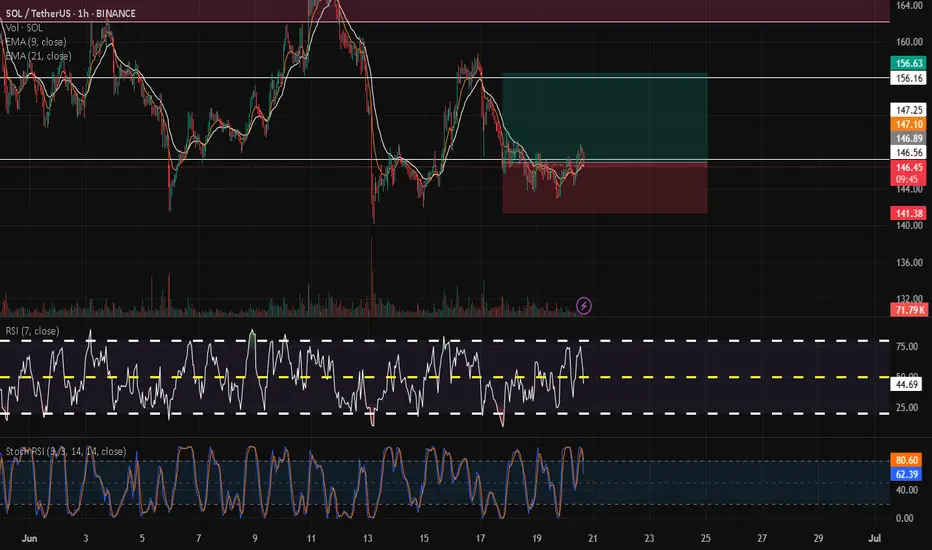
SOL NEXT MOVES 🧠 Scenarios:
1️⃣ Break above $149.50 → Possible push to $154–161
2️⃣ Rejection from red zone → Drop toward $132
3️⃣ Dip to $126–132 → Bullish recovery expected
📊 Plan your entries with structure & confirmation. No chasing.

SOLANA BEAR SEASONCurrently i believe that Solana already confirmed bear season last month.
Monthly candles show us that price retest completed to previous 3 candles and turned direction down.
In my opinion highly likely $295 was all-time-high for this cycle and price will continue to drop until the end of year.

Weekly trading plan for Solana Last week, BINANCE:SOLUSDT price followed our bullish (green) scenario perfectly and hit the first target. At this point, the upward corrective phase may be complete, so we could reasonably expect a pullback to either the weekly pivot point or support zone
Write a comment with your coins & hit the like button and I will make an analysis for you
The author's opinion may differ from yours,
Consider your risks.
Wish you successful trades ! mura

Solana (SOL): Gameplan Remains The Same | Aiming at $100 Solana's game gameplan has not changed for us, where we are still looking for that downward movement to form a proper support zone near the psychological area at $100.
More in-depth info is in the video—enjoy!
Swallow Academy

SOL LONGSolana price flipped bullish as bears fail to push price below $140
Next target areas for resistance are $160 and $170

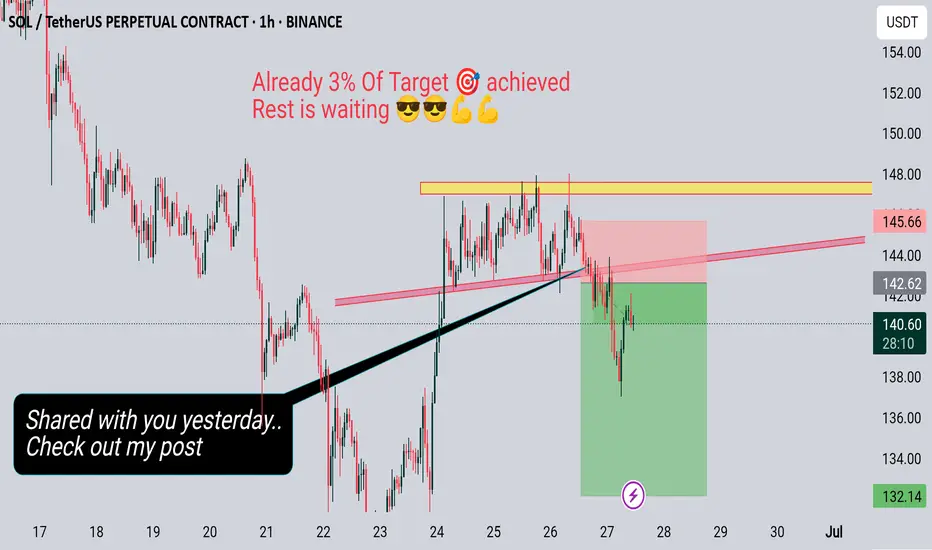
Solana 3 % Target Achieved Waiting for rest..Hello trader's
Here's the Solana update
How many off you traded after breakdown
🎯 Comment
bitcoin update right so this is what im seeing, the chart showing right now
a pullback to 102800 approx is absolute for a healthy change in trend. this pullback is backed by 3 points,
1 no such volume in the pole and flag pattern breakout
2 liquidity which works as a magnet is more in down, market will eventually make a new ATH but it wont make that ath until grabbing all the liquidity and leaving retailers in fear.
3 we're at a good strong resistance and the daily close today was showing sign of weakness and possible change in trend.
a short with sl above 109000 can be done,
wont short eth but i have some alts in mind with some scalp short chances
ethfi, cake, aave, link. trading in alts are risky so make your own judgement, im no financial advisor
thanks

SOL 2D BULLISH, Entry points New HH coming up?So guy as we have seen a downtrend SOL from 180 price resistance and so now price trading on very critical area. We have fvg on 2D around 120-123 and still haven’t not been taken. So there is two scenarios and mostly like price will reject from fvg and head toward to W fvg which we have Above on Weekly TF. The confirmation will be respect to fvg and overall market conditions. Also I am bearish on SOL 2 weekly TF, which we should not forget. If price respect to fvg and overall market conditions was bullish then we can enter around 120-130 and TP will be 210-220

Solana head and Shoulders ?This pattern need to be confirmed by the second shoulder, then keep an eye on the volume, the RSI and the pattern neck line to take a trade and aim for position to TP

#SOLUSDT LONG-TERM SETUPMEXC:SOLUSDT.P showing again an good price zone for entry i made this entry 2 days ago
still at the same point, it has a potential to perform to the target
you can take some entry at this point
meanwhile as you all know there is tension b/t #irna_israel so any thing can be happen so if you are planning to take position use low margin and apply some risk to reward ratio into your trade
#Hamm_crypto
Solana SOL price analysis📞 Rumor has it that as soon as the global geopolitics reach a “temporary lull”, the following ETFs will be launched
Solana ETF is the most likely to be the next one (but there are at least 2 coins more on the list, which we will talk about in the coming days)
🪙 So, are you ready to buy CRYPTOCAP:SOL in your investment portfolio? For example, in the range of $117-123
🤖 Maybe we need to launch a long trading bot OKX:SOLUSDT so that it can buy in micro portions on the current possible price correction to get a “tasty price” as a result
◆ Would you like to join such a trading bot and copy them?
◆ And then compare the results with all “ETF candidates”
_____________________
Did you like our analysis? Leave a comment, like, and follow to get more

Solana Breakdown Incoming? These Are Key Levels To WatchYello, Paradisers! Are you ready for the next major flush? After failing to gain momentum since the May double top breakdown, #SOL is now showing even more bearish signs, and the market might be about to punish late bulls one more time.
💎Following the confirmed double top in May, SOL has struggled to reclaim any upside momentum. Now, on the 12-hour chart, a classic head and shoulders formation is emerging, a pattern that often precedes larger trend reversals when the neckline breaks.
💎#SOLUSDT is hanging onto critical support between $142 and $140. This zone is the neckline, and it’s the last stand for bulls. If bears break it, we get a clear breakdown confirmation, with a clean path down toward $130–$127, which marks the first major demand area.
💎That initial support likely won’t hold for long. If pressure continues, SOL is expected to drop further toward the $115–$110 region. This is not just a technical support, it’s also the target area of the H&S formation, making it a magnet zone for price.
💎Adding to the bearish developments, a death cross has now been confirmed on the 12-hour chart. The EMA-50 has crossed below the EMA-200, reinforcing short-term downside pressure. Even if a relief bounce occurs, the $155 region, where the EMA-50 sits, will likely act as fresh resistance and attract renewed selling.
Paradisers, strive for consistency, not quick profits. Treat the market as a businessman, not as a gambler.
MyCryptoParadise
iFeel the success🌴

Solana Bearish Divergence, 20% Drop Incoming?Hey Realistic Traders!
Bearish Signal Flashing on BINANCE:SOLUSDT , What Signals Are Showing?
Let’s Break It Down..
On the daily timeframe, Solana has formed a double top pattern, followed by a neckline breakout, which is a classic sign of a potential shift from a bullish to a bearish trend.
This breakout was confirmed by a break of the bullish trendline, accompanied by rising selling volume, which reinforces the bearish momentum. Adding to this, a bearish divergence has appeared on the stochastic oscillator. Bearish divergence occurs when price makes higher highs while the oscillator forms lower highs, signaling weakening buying pressure and increasing the likelihood of a reversal.
Given these technical signals, the price is likely to continue moving lower toward the first target at 134.13, with a possible extension to the second target at 114.96.
This bearish outlook remains valid as long as the price stays below the key stop-loss level at 180.26.
Support the channel by engaging with the content, using the rocket button, and sharing your opinions in the comments below.
Disclaimer: "Please note that this analysis is solely for educational purposes and should not be considered a recommendation to take a long or short position on Solana.
