SOLUSDT Upward or downward?Hello,
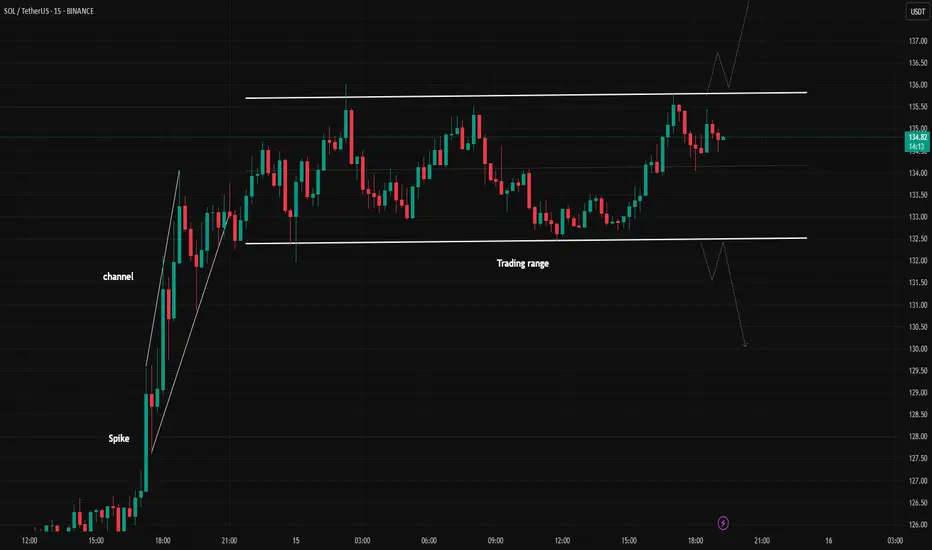
In the 5-minute timeframe, you can sell at the top of the trading range and buy at the bottom of the trading range (by observing reversal candles and patterns).
Alternatively, you can wait for a breakout and enter in the direction of the breakout.
Be mindful of fake breakouts.
May your trades be profitable!
SOLUST trade ideas
BULLISH SCENARIO I'm seeing a Bullish Harmonic Cypher Pattern for Solana. Congratulations to those who have shorted it :) A technical bounce is on the way...

SOLANA - PATH to 145 to again 125!Its SOL, I already mentioned its gonna boom to 240 but before that it needs to settle somehow to the point of 146, so i pref wanna say its long till 145 and again short from the tops to the bottoms, 126 is inevitable

SOLANA COUNTER TREND LONG TRADENotice that on the weekly timeframe, the price is very heavily bearish
Firstly, price have shown reasons as to why it should rally to the upside
I want to see price to breach the entry and take profits at 180

$SOL LTFCRYPTOCAP:SOL Ltf
Several Ltf BB starting on 23h; entry above 21h wick.
Tp1 at BOS
Trailing after that into 4D Supply zone.

SOLUSDT (30M) Analysis - Should You Short?📉 SOLUSDT (30M) Analysis - Should You Short?
Based on the 30-minute timeframe, SOL is currently trading at 132.85 USDT (-0.52%). Here’s an analysis to help you decide whether to open a short position.
⸻
🔎 Factors Supporting a Short Position
✅ Bearish Signal (50% Down)
• Increased selling pressure with indicators signaling a potential downtrend.
✅ Fibonacci Retracement Suggesting Downside Targets
• TP1: 130.31 USDT (-4.5%)
• TP2: 128.48 USDT (-6%)
• TP3: 126.64 USDT (-7.6%)
• TP4: 124.02 USDT (-9.8%)
• TP5: 122.46 USDT (-11%)
• TP6: 120.69 USDT (-12.9%)
✅ EMA 20 Acting as Resistance
• If the price stays below the EMA 20, it could confirm a continued downtrend.
✅ Key Support Level at 130.11 USDT
• If SOL breaks below this level, the price may drop further toward 128 - 126 USDT.
⸻
🚨 Risk Factors to Consider Before Shorting
❌ Support at 130.11 USDT May Cause a Bounce
• Monitor whether SOL holds above this level before entering a short position.
❌ Stop Loss at 139.93 USDT (If the Price Reverses Upward)
• If SOL breaks above the 136 - 139 USDT resistance zone, it could flip bullish instead.
⸻
📊 Recommended Trading Strategy
📌 Short Entry Conditions:
• If SOL closes below 130.11 USDT, a short position targeting 128 - 126 USDT could be considered.
• If SOL retests the 136 - 139 USDT resistance and gets rejected, a short entry may be valid.
📌 Long Entry Conditions (If Trend Reverses to Bullish):
• If SOL breaks above 139 USDT, wait for confirmation before considering a long position.
⸻
✅ Final Recommendation
• Wait for a break below 130.11 USDT before shorting for better confirmation.
• Set a stop loss at 139.93 USDT to manage risk.
• Use volume and RSI indicators for further validation.
📉 Overall: Shorting is viable if SOL breaks below 130.11 USDT, but monitor support levels closely! 🚨

Solana SOL Will Bounce, But Then Scam!Hello, Skyrexians!
Couple of weeks ago we told you that BINANCE:SOLUSDT will reach $110 in the wave 5 inside the major wave A. You can find this analysis here . Exactly from this zone we have seen the bounce. This bounce is a major correction and those who listen this analysis could already be in the great profit. But anticipated bounce is not the bull run continuation and finally Solana will drop hard because its era is finished.
Let's take a look at the weekly time frame. Here we can see that 5 Elliott waves with the Awesome Oscillator's divergence. After that the major correction has been started. Wave A has been finished at $110 with the green dot at the Bullish/Bearish Reversal Bar Indicator and now we will see wave B, which will reach the Fibonacci 0.5 approximately at $200. From there we will see the scam drop in wave C. It will likely break the major Fibonacci 0.61 support. In this case game is over and Solana can fall for a years or even scam.
Best regards,
Skyrexio Team
___________________________________________________________
Please, boost this article and subscribe our page if you like analysis!

SOLANA I Weekly CLS, KL - Order Block , Model 1Hey Traders!!
Feel free to share your thoughts, charts, and questions in the comments below—I'm about fostering constructive, positive discussions!
🧩 What is CLS?
CLS represents the "smart money" across all markets. It brings together the capital from the largest investment and central banks, boasting a daily volume of over 6.5 trillion.
✅By understanding how CLS operates—its specific modes and timings—you gain a powerful edge with more precise entries and well-defined targets.
🛡️Follow me and take a closer look at Models 1 and 2.
These models are key to unlocking the market's potential and can guide you toward smarter trading decisions.
📍Remember, no strategy offers a 100%-win rate—trading is a journey of constant learning and improvement. While our approaches often yield strong profits, occasional setbacks are part of the process. Embrace every experience as an opportunity to refine your skills and grow.
Wishing you continued success on your trading journey. May this educational post inspire you to become an even better trader!
“Adapt what is useful, reject what is useless, and add what is specifically your own.”
David Perk ⚔

Chart is crystal clear. Reaction on divergence at support.All liquidity on the upperside are left open. No reason to not go down while these are open.

How far can $125 support SOLANA from fallingSolana (SOL) Price Analysis and Forecast: Can the $125 Support Hold?
Solana (SOL) recently experienced a sharp dip to the $110 zone before rebounding swiftly. From a technical analysis (TA) perspective, the $125 support level is currently a key defence zone for the asset.
If SOL maintains its position above $125, we could see a continuation of bullish momentum. However, a decisive break below this level could expose the cryptocurrency to further downside, with the next major psychological support resting at $100.
For long-term investors, the current price action presents potential accumulation opportunities.
Maintaining a strategic approach with proper risk management will be crucial as market volatility persists.

Are we going to the moon ?! SOLUSDTHere are some potential targets for SOLUSDT if we are going up grom this point ....
BULLLLIISSHH

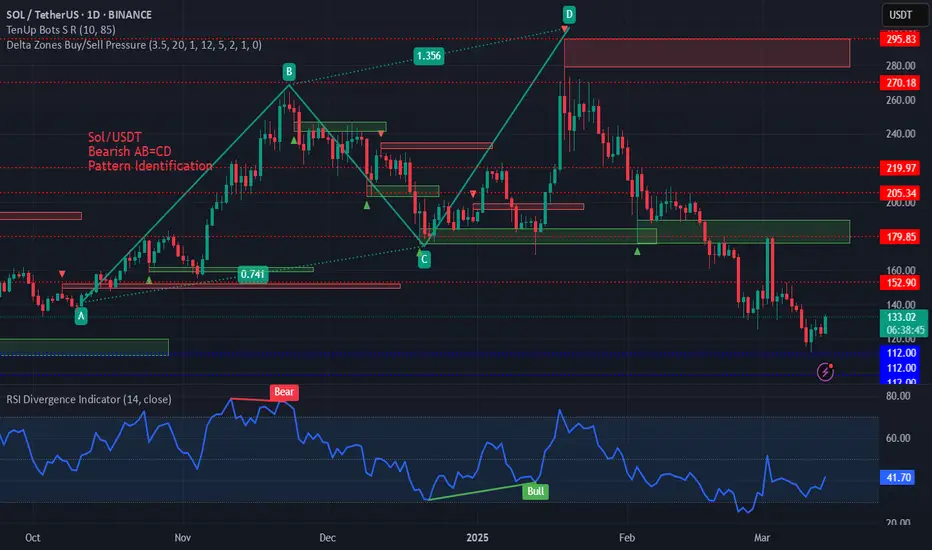
Pattern Identification on SOL/USD AB=CD Pattern on SOL/USDT on daily time frame.
These are harmonic patterns and these can be seen on hourly, 4h, 1day etc. time frames and the trader can take positions in the market according to the trend.
SOLUSDT: Strong Bounce from Major Support!!BINANCE:SOLUSDT has shown a strong recovery after hitting a major support zone around $110. This bounce is accompanied by good trading volume, indicating growing interest. Investors who missed the previous rally are now accumulating, which adds further strength to the bullish sentiment.
As market conditions improve, the entry of bigger players could push SOL towards higher highs. If momentum continues, there’s potential for SOL to breach its previous all-time high, with a long-term target of $500 in sight.
For investors, this presents a solid buying opportunity to hold for the long term. Traders, however, should manage their risk carefully and always set a stop loss to protect their capital.
BINANCE:SOLUSDT Currently trading at $132
Buy level: Above $110
Stop loss: Below $90
Target : $500
Max Leverage 3x
Always keep Stop loss
Follow Our Tradingview Account for More Technical Analysis Updates, | Like, Share and Comment Your thoughts

$SOL to $80Solana ( CRYPTOCAP:SOL ) is currently at a critical level from a technical perspective.
The $120 level has historically served as strong support, having been tested and respected on multiple occasions in the past. However, I’m skeptical about its ability to hold this time around, given the current market dynamics and momentum.
Should $120 fail to hold, the next significant support level I’m monitoring is around $80. This level is particularly noteworthy as it aligns with two key technical indicators: the volume weighted average price (VWAP) , which reflects the average price adjusted for volume and often acts as a magnet for price action, and the 1.618 Fibonacci retracement level , a widely watched extension in technical analysis that frequently marks reversal zones in trending markets.
The confluence of these factors at $80 suggests it could serve as a strong potential support zone if price continues to decline.

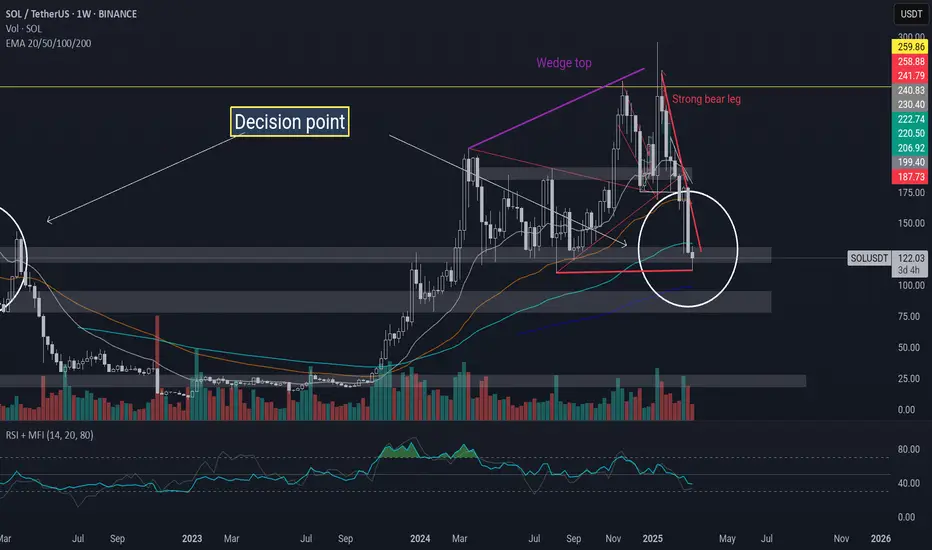
Price action based analysis of Solana The same break point of the previous move, which has become a resistance. However, a decision point!
SOL to 55$ soonI am only long if weekly candle closes above the red resistance line
other wise price has to fall to 55$

Solana (SOL) Price Analysis: Key Support & Resistance LevelsCurrent Market Structure
SOL is holding a major support level around $110, which could act as a launchpad for a short-term rally.
This support has historically served as a strong demand zone, attracting buyers looking for a potential rebound.
Upside Potential: Resistance Zones to Watch
If SOL maintains $110 support, it could rally toward:
$140 (first key resistance level)
$150 (historical rejection zone)
These levels have previously triggered selling pressure, so traders should watch for possible rejections.
Downside Risk: Key Support Levels
If SOL fails to hold $110, further downside could lead to a test of:
$80, a stronger support level from previous price action.
Conclusion & Strategy
Bullish Scenario: Holding $110 could trigger a move toward $140–$150, but a breakout above these levels is necessary for sustained upside.
Bearish Scenario: A break below $110 could accelerate losses, leading to a retest of $80 support.
Key Watchpoint: Reaction at $140 resistance—a rejection here could indicate another leg down, while a strong breakout could confirm further bullish momentum.

BullishHi Guys,
Market looks bullish today. I believe it will go down to "High VOL Asia Session" and move back up to break yesterday's swing high.

Solana SOL Weakness Continues: Is the Next Leg Lower Coming? 📉 Solana ⚡ is showing signs of weakness, maintaining a clear bearish trend on this 4H timeframe. Price action has traded into a key support zone, with a potential pullback offering an opportunity to enter short at a premium before the next leg lower 🔻.
If sellers remain in control, we could see a continuation to lower levels 📉.
⚠️ Not financial advice—always manage risk appropriately!

Solana 4-hour time frame bearishSolana is moving towards liquidity floor using block orders on the 4-hour timeframe.

Sol compression to expansion On the hourly timeframe, a push into the EMA 200 then rejecting back to the hourly trend while both reestablishing the trend and the horizontal level could set up for a nice move going into the weekend. Might be a good idea to book profits before Monday NYO if it works out to play it safe.

SOLUSDT - Move Down to Stronger Trend LineTrend Line in green is a good position for price to reverse in the bulls favor
This aligns well with the 0.786 fib line
As you can see it has broken down out of a small channel shown in the green dotted section
Weekly timeframe

SOL/USD Short Trade ideaThe price hasnt made any new LL's and is showing possibility on a double top...the price is at a ridiculous price point and is a high possibility for a buy momentum to happen. Watch for fake breakouts, look for right confirmations and use logical thinking in crypto about the price movements. Yes we had a high reached, we had price rising slowly from a very low point back to the ressistance GWS and on smaller TF's we can see no new LLs made...lets see how it plays out and where we can find a trade.
