SOLUST trade ideas
SOL | Solana Drops 54% | WHERE TO NEXT?The recent ByBit hack seems to have sent the market into a downward spiral. But, if you look at it from a few weeks back, prices were already beginning to drop even before the news of the hack.
Solana follows Ethereum pretty closely, and considering the hard sell-off on ETH, SOL followed suit with a -26% drop over the past week.
This is quite a substantial correction, and considering the past 6 candles were red - it's likely that we can expect a bounce from next week, or at least a green candle. If we fail to bounce here, the short term is looking bleak for SOL:
____________________
KUCOIN:SOLUSDT


SOL LONG SETUPALL trading ideas have entry point + stop loss + take profit + Risk level.
hello Traders, here is the full analysis for this pair, let me know in the comment section below if you have any questions, the entry will be taken only if all rules of the strategies will be satisfied. I suggest you keep this pair on your watchlist and see if the rules of your strategy are satisfied. Please also refer to the Important Risk Notice linked below.
Disclaimer
SOL LONG SETUP
ENTRY : 113.63
PROFIT : 165.26
STOP : 96.57

SOLUSDT 6DSOL ~ 6D Analysis
#SOL Buy gradually from here with a short -term target of at least 15%+ from here.


Solana Faces Heavy Selling—Is Capitulation Over?Solana has been on a wild ride since hitting its all-time high of $295.83 in January. The once high-flying altcoin has now fallen to levels not seen since October, triggering panic among traders. But here’s the twist—on-chain signals suggest a recovery could be closer than many think.
RSI Signals an Oversold Market—Time for a Rebound?
📉 Solana’s RSI just dropped below 30 for the first time since June 2023—a strong signal that the asset is oversold. Historically, when RSI enters this zone, a price reversal often follows as traders scoop up discounted tokens.
📌 Why It Matters – When an asset reaches oversold territory, it means selling pressure may be running out. If buyers step in, SOL could stage a strong recovery.
Market Sentiment at a Low—A Buying Opportunity?
🔹 Crypto analyst Miles Deutscher calls this Solana’s “capitulation moment”—a period when panic-driven selling could mark the bottom.
🔹 When weak hands sell off, stronger buyers often step in, driving a price recovery.
Key Price Levels to Watch
📌 Support: $136.62 – Holding this could trigger a rebound.
📈 Resistance: $182.31 – A breakout here could push SOL above $200 to $222.14.
📉 Bearish Scenario: If selling continues, SOL may fall to $120.72.
The next few days are crucial—will buyers take control, or is more downside ahead?

SOL/USDT – Double Zigzag Completed! Is a Bullish Reversal Next?Solana (SOL) has likely completed a Double Zigzag (WXY) correction, with Wave C of Y bottoming at $130.60 (1.0 Fibonacci extension). This suggests a potential trend reversal, but SOL must first break key resistance at $146-$150 to confirm a bullish move.
🔹 Elliott Wave Analysis & Bullish Scenario
If the Double Zigzag correction is complete, SOL could begin a new impulse wave, targeting:
✅ $169-$173 (0.5 Fibonacci retracement, previous Wave B resistance)
✅ $180-$195 (0.382 Fib & major supply zone)
✅ $220+ (Wave 3 extension target)
🔻 Bearish Scenario – Extended Correction?
If SOL fails to break $150, it could indicate that the correction is not yet over, leading to:
❌ Retesting $130 support
❌ Possible extended correction towards $113-$100 (1.272 Fib extension)
📌 Key Level to Watch:
🔹 A break & close above $150 signals bullish continuation.
🔹 A rejection could mean further downside.
📊 Is SOL ready for a breakout, or will we see another leg down? Share your thoughts below! 👇🔥

Solana Bullish Setup I created a Entery and sl point according to 4 hr if you guys have knowlegde about technical you can easily get more rr in smallar Timeframe

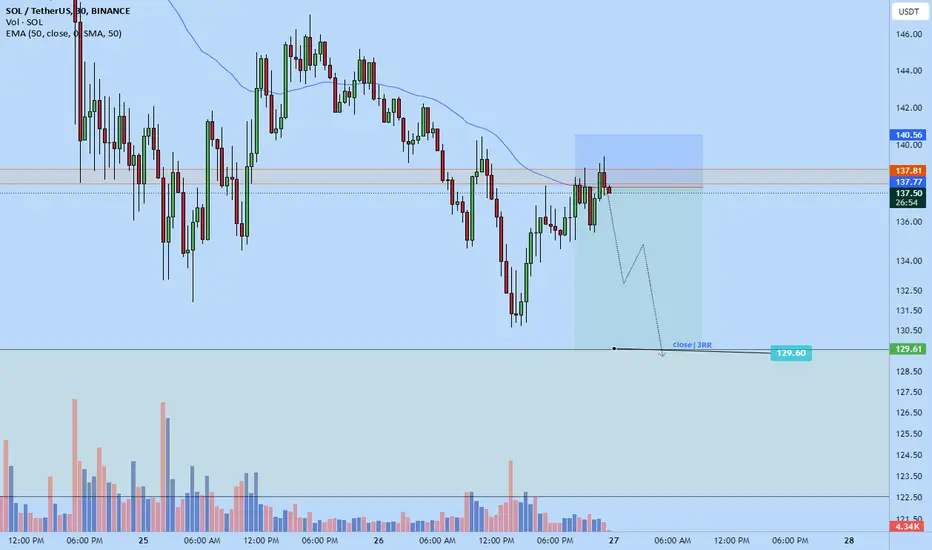
Solana short to $129.6I just opened a solana short position if anyone wants to follow along.
Roughly 3RR
Based on my analysis I think the market is gonna push to make a lower low soon and will likely fall to the $129.6 area and maybe lower but i might be a sleep so setting a hard target at that area so that Its likely to get hit.
I did not wait for any special type of entry confirmation here I think its high enough and my stop is at good invalidation point in a relatively safe area and good level. I don't expect much upside movement from here. This should be an attract area for other sellers to get in.

#SOL/USDT Analysis📉 CRYPTOCAP:SOL is testing the Daily +OB**—a crucial level to hold!
⚠️ If this +OB fails, SOL could drop below $100.
🔹 Major Resistance: PMH $168.33
Watching for a reaction here! 👀


SOLANA bargainSOL returned to demand zone. This is good entry point as this chain has huge future potential thanks to it´s performance.

#SOL Crash like something never imagined. 60 $#SOL Crash like something never imagined. 60 $
260-270 is the pullback level where we can close our long positions. After that, a crash will come, whether due to War or Tariff hikes. But SOL can go below $60.
CRYPTO IS NOT SAFU NOW..
Previous SOL Trade FULL DONE.
Already Attached..

SOL Potential drops -55% to $131? Here’s WhyBINANCE:SOLUSDT might be forming another right shoulder of a W-bottom (light blue line). The target drop is around $131, which happens to be the mid-point (0.5) of the descending channel—a reasonable support level.
The first right shoulder has already formed, and its drop was exactly the same as the left shoulder—both at -47%.
However, the best-case scenario would be if it finds support at the upper boundary of the descending channel. Let's see if it can hold there.
🔴 Read my signature & publications for more info you don’t want to miss.
🔥 for more future "guesses" like this!
🔥 I've dropped an analysis for the 2025 altseason on the right hand side if you're using computer, and scroll down a bit to see the link if you're using mobile.

Solana update:big funds loaded up SOL from FTX at these levels with some OTC buys even higher.
SOLANA is mispriced, Buy,DCA & HOLD.
Targets: $420-520$


SOL High Selling Pressure ...Wait For PullBack For ShortSOL High Selling Pressure ...Wait For PullBack For Short..
When should we go long on Sol? It is likely to experience a pullback in Sol when BTC reaches 3355. Once BTC starts to drop from 3355, Sol will move upwards. This will be a chance to open a short position, and for those who have long positions, it will be time to close them.
BTCD Chart Attached..
For Timely Updates DM US ..

Technical Analysis for Solana (SOL)
Current Sentiment: Bearish
#### 1-Hour Timeframe Analysis:
Resistance Level: The price is currently facing strong resistance at the $200 mark, which has proven to be a significant barrier to upward movement.
- Support Levels: Key support levels to watch are at $184 and $180. A breakdown below these points could trigger further sell-offs.
Chart Pattern: A head-and-shoulders pattern has formed, indicating a potential reversal in price direction. This bearish pattern suggests that if the price breaks below the neckline, we could see a decline toward the support zone from around $155 to $160.
#### 1-Day Timeframe Analysis:
Longer-Term Outlook: The daily chart indicates that if the bearish momentum persists, the price may potentially retrace to the $135 to $140 range. Given its historical significance as a support zone, this level could serve as a strong buying opportunity.
Volume Analysis: Monitoring volume can provide insights into the strength of the current bearish trend. Increasing volume on a downward move would confirm bearish sentiment, while lower volumes could indicate a weakening trend.
#### Conclusion:
The current price action in Solana suggests a bearish outlook, especially with the formation of the head and shoulders pattern on the hourly chart. If the price breaks through key support levels, notably $184 and $180, it could lead to a test of the $155 to $160 area, potentially a longer-term plunge to $135 to $140.
Strategy:
- Consider short positions below $184 with protective stops above $200.
- Look for buy opportunities if the price reaches $135 to $160, ensuring risk management practices are in place.
Disclaimer: This analysis is for informational purposes only and does not constitute financial advice. Always research and consult with a financial advisor before making trading decisions.
Happy trading, everyone! If you find this analysis helpful, please follow, share, and like for more updates. Stay tuned!


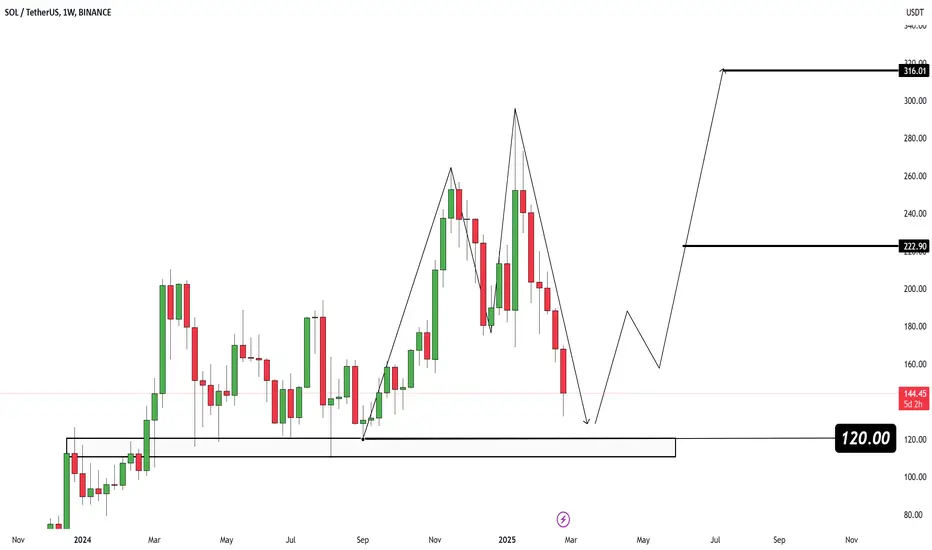
SOL USDT💰 #Solana (SOL/USDT) Analysis
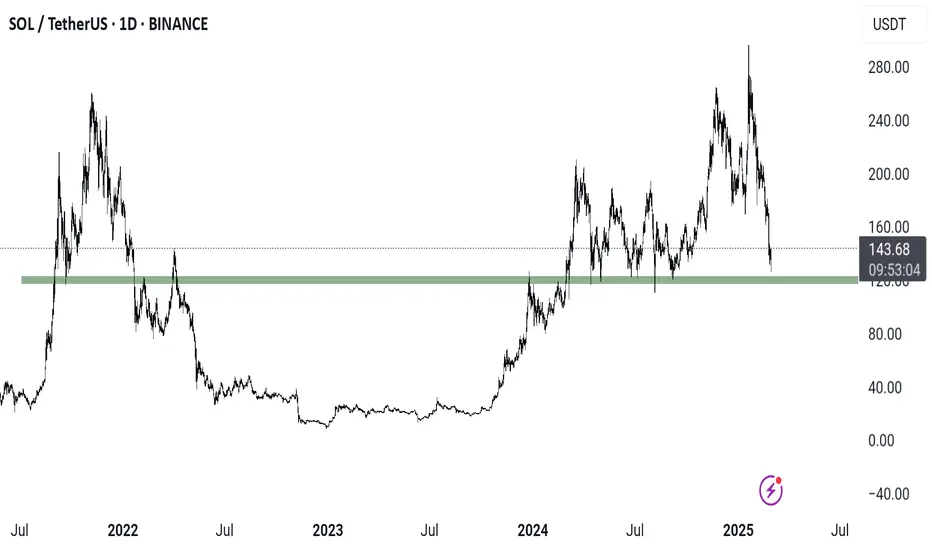
Solana is currently approaching a major support zone around $120, which has historically acted as a strong level for price reversals. The current downtrend is likely a correction phase before a potential bullish recovery.
🔹 Key Observations:
Support Level: The $120 zone is a critical area where buyers could step in.
Bullish Recovery Expected: A bounce from this level could push SOL towards key resistance targets.
Potential Double Bottom Formation: If price reacts positively, we might see a reversal pattern forming.
🔹 Entry Strategy:
Primary Entry: Around $120 if price shows a bullish reaction.
Breakout Entry: Consider adding if price breaks above $222 for confirmation of a trend shift.
🔹 Target Levels:
T1: $222.90
Final Target: $316.01
📉 Risk Management:
Stop-loss below $110 to limit downside risk.
🚀 SOL could see a significant bounce if buyers defend the $120 area!
#Solana #Crypto #SOLUSDT #Trading 🚀