$SOL Tight Range. Big Move Loading? Full Multi-TF Breakdown📊 CRYPTOCAP:SOL Daily Chart
Price bounced from confluence support around $126 (0.236 fib + local structure), but remains below all key retracements from the $184 high.
– RSI hovering around 39 → oversold but no bullish divergence
– MACD still below signal line, weak momentum
– Structure remains inside a descending channel
BTC is testing $106K into weekly close.
If Bitcoin confirms a breakout, SOL could follow with a push above $160.3 (0.236 fib).
Reclaim of $160 → $184 next
Failure → $126 retest, with risk of break toward $118
Trend bias: bearish → neutral
Watching BTC for confirmation.
SOLUST trade ideas

SOLANA SHORT SETUP The price has induced the pml and did not sweep it, by that it acumullated large ammount of liquidity at the relative equal lows.
I think we are going to retest the orderblock that I marked by the green box which essentialy is the wick on previous monthly candlle, after that the price should break to the downside taking out the acumulated liquidity.
Entry at 173.41
TP 141.33
SL 189.48

SOL/USDT Technical Analyse📉 Downtrend Line: SOL has been following a strong downtrend line, but now the price is consolidating near it and looks close to a potential breakout.
🔁 Fibonacci Support: According to the Fibonacci retracement tool, SOL is currently sitting on a key support zone (you can mention the exact level if you want), which could act as a potential reversal point.
🕯️ Candle Pattern: Today's candle is neutral — neither bullish nor bearish — but the overall structure suggests a possible breakout. Waiting for a confirmation candle would be wise.
📌 Next Move: If the price breaks above the trendline with good volume, a bullish momentum might follow.
⛔ This is not financial advice. Always DYOR (Do Your Own Research).

Reading The Room: Market Sentiment TechnicalsThe Market Sentiment Technicals indicator, created by LuxAlgo , is a powerful tool that blends multiple technical analysis methods into a single, easy-to-read sentiment gauge. It’s designed to help traders quickly assess whether the market is bullish, bearish, or neutral by synthesizing data from trend, momentum, volatility, and price action indicators.
🧠 How We Use It at Xuantify
At @Xuantify , we integrate this indicator into our multi-layered strategy stack. It acts as a market context filter , helping us determine whether to engage in trend-following, mean-reversion, or stay on the sidelines. We use it across multiple timeframes to validate trade setups and avoid false signals during choppy conditions. This example uses MEXC:SOLUSDT.P , symbols like BINANCE:BTCUSDT or BINANCE:ETHUSDT are fine to use as well.
⭐ Key Features
Sentiment Panel: Displays normalized sentiment scores from various indicators.
Market Sentiment Meter: A synthesized score showing overall market bias. (Below image)
Oscillator View: Visualizes trend strength, momentum, and potential reversals.
Divergence Detection: Highlights when price action and sentiment diverge.
Market Sentiment Meter: A synthesized score showing overall market bias.
💡 Benefits Compared to Other Indicators
All-in-One : Combines multiple indicators into one cohesive tool.
Noise Reduction : Filters out conflicting signals by averaging sentiment.
Visual Clarity : Histogram and oscillator formats make interpretation intuitive.
Adaptability : Works across assets and timeframes.
⚙️ Settings That Matter
Smoothing Length: Adjusts how reactive the sentiment is to price changes.
Indicator Weighting: Customize which indicators influence the sentiment more.
Oscillator Sensitivity: Fine-tune for scalping vs. swing trading.
📊 Enhancing Signal Accuracy
We pair this indicator with:
Volume Profile: To confirm sentiment with institutional activity.
VWAP: For intraday mean-reversion setups.
Breakout Tools: To validate momentum during sentiment spikes.
🧩 Best Combinations with This Indicator
LuxAlgo Premium Signals: For entry/exit confirmation.
Relative Volume (RVOL): To gauge conviction behind sentiment shifts.
ADX/DMI: To confirm trend strength when sentiment is extreme.
⚠️ What to Watch Out For
Lag in Consolidation: Sentiment may flatten during sideways markets.
Overfitting Settings: Avoid tweaking too much—stick to tested configurations.
False Divergences: Always confirm with price structure or volume.
🚀 Final Thoughts
The Market Sentiment Technicals indicator is a game-changer for traders who want a 360° view of market psychology . At Xuantify, it’s become a cornerstone of our decision-making process—especially in volatile conditions where clarity is key.
🔔 Follow us for more educational insights and strategy breakdowns!
We break down tools like this weekly—follow @Xuantify to stay ahead of the curve.

Sell signal by tiqgptMARKET NARRATIVE: The analysis across the four timeframes for SOL/USDT reveals a coherent narrative of smart money activity and price manipulation. Starting with the 1-hour chart, we observe a descending price action indicating a potential distribution phase. This is characterized by a series of lower highs and lower lows, a classic indication of a market structure shift towards a bearish bias. The presence of a significant Order Block (OB) around the $150.50 level, which has not been revisited, suggests that this level may act as a ceiling for future price actions.
Drilling down to the 15-minute and 5-minute charts, we see a continuation of this bearish sentiment with a clear Break of Structure (BOS) to the downside, confirming the shift in market structure observed on the higher timeframe. The 5-minute chart shows a rapid descent through previous low points, indicating liquidity sweeps below these levels. This action is typical of smart money inducing positions before a potential reversal or continuation.
The 1-minute chart provides a more granular view of the price action, showing recovery attempts being capped by lower highs, which aligns with the bearish market structure set by the higher timeframes. This micro-level view is crucial for pinpointing precise entries and understanding the immediate market sentiment.
INSTITUTIONAL THESIS: The overarching smart money intent appears to be a continuation of the bearish momentum, with potential liquidity targets below the current lows. The repeated failure to break above previous minor highs suggests an accumulation of sell-side pressure. Smart money may be positioning for a further push downwards, exploiting the liquidity pools formed below recent lows as retail traders are likely to have placed stop losses in these regions.
LEARNING POINT: The key concept here is the Break of Structure (BOS) on multiple timeframes confirming a bearish market structure shift. This is complemented by liquidity sweeps below recent lows, which are indicative of smart money's manipulation to trigger retail stop losses before potentially driving the price lower.
SIGNAL: SELL SYMBOL: SOL/USDT ENTRY PRICE: $148.60 STOP LOSS: $149.10 TARGET PRICE: $147.10 CONDITION: LIMIT ORDER: Place sell limit at $148.60 after a retest of the minor high on the 1M chart confirms rejection. RATIONALE: The trade is predicated on the bearish market structure across timeframes, with a recent BOS and liquidity sweeps indicating further downside. The entry at $148.60 is chosen based on the recent rejection points on the 1-minute timeframe, providing a tight stop loss just above the minor high at $149.10 to protect against potential whipsaws. The target is set at $147.10, near the next significant liquidity pool, offering a favorable risk/reward setup. STRATEGIES USED: 1H Bearish OB Continuation, Multi-Timeframe BOS, Liquidity Sweep Execution URGENCY: MEDIUM TIMEFRAME: Short-term CONFIDENCE SCORE: 75%

Solana >>> all trendlines are brokenHello guys!
As you can see, all of the trendline is broken, and after forming a double top in Solana, we can see a bearish trend is running!
I believe this downward movement will continue until the price touches the mentioned area!
The pointed area is the target level!
And the blue area has its own potential for getting long!

Solana Short Position Update – June 7, 2025We are the SeoVereign Trading Team.
With sharp insight and precise analysis, we regularly share trading ideas on Bitcoin and other major assets—always guided by structure, sentiment, and momentum.
🔔 Follow us to never miss a market update.
--------------------------------------------------------------------------------------------------------
Solana Short Position Share
Currently, Solana appears to have entered an overbought zone after a technical rebound, and the pattern is reaching the completion area of a 0.382 ratio ALT BAT (Alternative Bat) pattern.
This pattern typically appears in areas with a high possibility of price reversal, and especially the 0.382 retracement is an early reversal form unique to the ALT BAT, indicating conditions where selling pressure in the market may strengthen again.
Accordingly, entering a short position at the current level is considered meaningful in terms of pattern reliability and risk-reward ratio.
The first target price is set at $150, which corresponds to a structural support level and the target range of a short-term corrective wave.
After entry, additional downside targets can be reviewed depending on market flow and candlestick development.

Solana Approaches the Breaking Point.Solana is currently testing a key resistance zone (highlighted in purple), which has rejected the price multiple times in the recent past. At the same time, it continues to respect a well-defined ascending trendline, indicating building bullish pressure.
The blue zone marks an important horizontal support level, which served as the base for the previous breakout.
This chart is displayed in logarithmic view to better capture percentage-based price movements over time.
At the moment, price is being squeezed between:
the static resistance zone (seller area)
the rising trendline (buyer pressure)
What to watch for?
Break above resistance = potential bullish continuation
Break below trendline = possible retracement to support area
What do you think will happen next? Are you bullish or bearish on Solana?
Let me know in the comments!
If you enjoyed this post, feel free to share it with your friends!
Thank you!
#Solana #SOLUSDT #CryptoTrading #TechnicalAnalysis #LogChart #PriceAction #Breakout #SupportResistance #TradingView #Altcoins
SOLANASolana is now testing a key resistance zone around $152.90 – $154.00, which overlaps with a well-respected descending trendline📉
So far, this zone has rejected price multiple times, and we’re yet to see a strong breakout or close above it. A clear move above $154 with volume could trigger a bullish breakout 🟢, targeting the $160–$166 range.
However, failure to break this level might result in another drop toward the $145 area or even revisit the $140 demand zone below. ⚠️
📌 Key levels to watch:
Resistance: $152.90 – $154.00
Support: $145.00 → $140.00
Breakout confirmation: Close above $154 on strong volume

Accurate SOL Momentum TrackerSolana Tracker with a custome SMACD Indicator tuned to track swings for swing trades. Bottom Red pass = bearish potential green line pass + bullish potential

SOLANA SOLANA , sol have broken a demand floor and few weeks ,expect more sell before buying the deeps .
#sol #btc

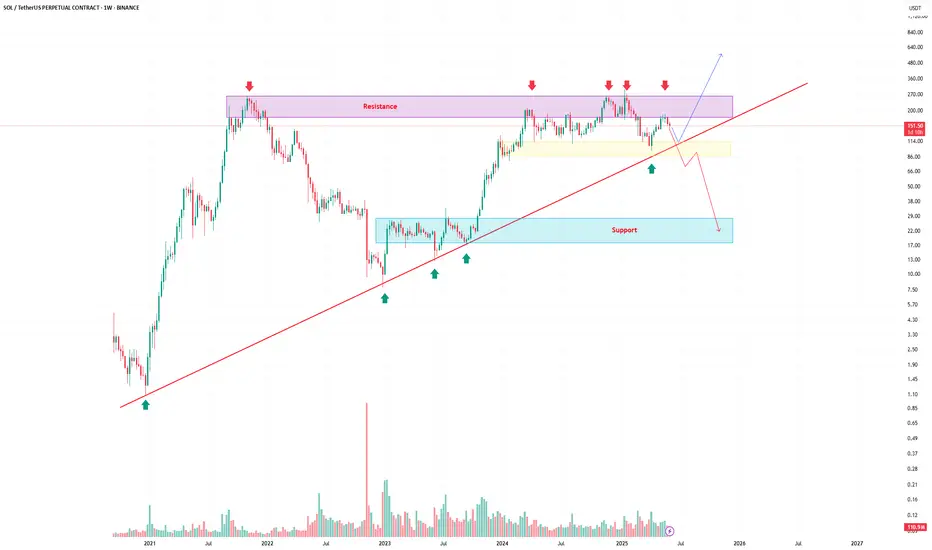
Long-Term Technical Outlook: Critical Decision Point Approaching
The chart illustrates a long-term technical structure where the price has been following an ascending channel after a prolonged bearish trend. However, recent price action indicates a breakdown below the green ascending trendline, raising concerns about a potential shift in market sentiment.
Currently, the $117 level is acting as a pivotal support zone. A sustained breakdown below this level — and more critically, below the red lower trendline — would validate the bearish scenario. This could trigger a deeper correction phase, with downside targets aligned along the red projection path. Such a move may lead to significantly lower price levels in the medium to long term.
🔽 Bearish Scenario:
If the price fails to hold above $117 and breaks below the red trendline, this would confirm the start of a bearish leg. Based on historical structure and projected trajectories, this could result in a descent toward the $93 level initially, with the possibility of extending further downward depending on market conditions.
🔼 Bullish Scenario:
On the other hand, if the price manages to reclaim the green trendline and more importantly, stabilize above the $204 resistance zone, it would signal renewed bullish strength. Such a move would open the path toward higher highs, potentially re-entering the previous upward channel and continuing the macro uptrend.
🧭 The price structure is now approaching a decisive zone, where either a confirmation of bearish continuation or a bullish recovery will likely unfold. Both scenarios have been visually outlined — green lines indicating bullish continuation, and red lines representing bearish momentum.
📌 Note: This analysis is for educational purposes only and should not be interpreted as financial advice.

Solana Bullish, Retrace Over! Aim For $620 or $1,020 In this 2025 Cryptocurrency bull market, you should be aiming for $620 or $1,020 for Solana, $420 is the minimum.
How are you feeling today my dear friend?
I hope you are having a wonderful day.
Retraces and corrections, they can only last so long.
Solana dropped from $188 to $141 and I believe this is enough, a 24% drop (-24%).
As the retrace ends, the chart will produce a higher low and, as the higher low becomes confirmed, SOLUSDT starts a new wave of growth.
$420 is the minimum target for this bullish wave and should hit first but, you should aim higher, much higher. Crypto is showing to be many times stronger than what most people think.
Remember, the mistake we always make is not aiming too high but aiming too low. In each bull market, we tend to underestimate the market. Aim high, because we are going up.
Retraces and corrections are an opportunity to buy-in, 2nd entries, rebuy and reload.
Don't try to SHORT within a bull market, it is dangerous and not worth the risk. It is better to wait for support and go LONG. Always trade with the trend, specially if you are using leverage. Crypto is going up. Solana will now turn green.
Thank you for reading.
Namaste.

Solana Short-Term, Already Bearish After 97% UpWhat will happen in the long-term? Before we get there, let's focus on the short-term real quick because we want to know what is happening with the market now.
The market offers endless opportunities. We need to take advantage of those, our edge. We have an edge and this edge is being able to read the chart. With this edge, we can time the market and increase our trading success.
Solana grew by 97%. This is good. Of course, some pairs grew way more while others grew less. I did mentioned that when Bitcoin grows 50%, some Altcoins can grow 300%. This is exactly what happened, this is because of the size of the projects.
Some pairs grew more but these were smaller pairs. Some pairs grew less but these were bigger. That's just the nature of things.
This 97% bu-wave can be correlated to a 300-400% bullish-wave on other pairs. This means that after a growth wave comes a correction.
SOLUSDT—two main interesting levels. Won't mention them as they are shown on the chart.
Both are likely to hit but the first high is really high probability.
This is easy. Wait for support before buying again. I say "again" because you are supposed to sell at resistance, we are assuming you sold at resistance and are ready to buy at support.
Good? We are good.
The market will continue to move down and up while long-term it produces sustained growth.
We need to adapt fast and be smart, everything can change in a day.
Keep an eye on the news, we might be in front of some major event.
Political events can change everything and cannot be predicted.
Thank you for reading.
Namaste.

Will Solana Go Lower? Yes! Only To Recover HigherI've been asked: Will Solana continue lower?
I think it is a fair question but it is also pretty hard right now to say based on the chart, there are just too many mixed signals.
For example, if we take Solana in relation to Bitcoin, it is trading daily below EMA55 and MA200, while Bitcoin is trading daily above these levels. Bitcoin hit recently a new all-time high while Solana only produced a small recovery in May.
When it comes to the chart signals, SOLUSDT produced a volume breakout on the bearish side and the support zone was completely challenged on a single candle. What's more, Solana will grow really strong later this year, so it would be normal to see as much bearish action as possible now because later we will have sustained long-term growth.
It is a coin flip, but if you ask me, it can go a bit lower before moving up. It can go lower to end up producing a higher low.
I will wait for clear reversal signals before going LONG.
I closed all my LONGs a while back, when it became clear that the market was going into correction. Now we can just wait easily and patiently until the correction unravels, after the correction comes a new wave of growth. Down and up, down and up... The market continues to cycle. Never straight down, never straight up. It moves in waves.
Namaste.

SOL/USDT Technical Breakdown: $125 Support in Sight?Key Observations:
1. Bearish Momentum Intensifying
SOL has been in a steady downtrend since its recent local high near $190, forming lower highs and lower lows on the 4H timeframe.
The current price sits around $147.63, having broken below a minor support level near $149.81.
2. Key Support Level: $124.50
The green horizontal line at $124.50 marks a critical demand zone, which acted as a launchpad during the April rally.
A clear blue arrow on the chart suggests a potential bearish continuation into that zone.
3. Structure and Price Action
The market is forming a descending channel, respecting key horizontal levels.
If the current downward pressure persists, a retest of the $124.50–$125 area looks likely.
Levels to Watch
Immediate Resistance: $149.80 – previous support now flipped
Support Zone: $124.50 – demand-based with prior reaction history
Trend: Bearish in short-to-mid term
Trade Setup Idea (Not Financial Advice)
Entry: $147–$149
Target: $125
Stop Loss: $155 (above minor structure)
Note to Traders
This setup leverages classic support-flip mechanics and momentum-based sell-offs. Watch for confirmation via volume spikes or sharp candle closes. As always, adjust sizing based on your risk tolerance.

SOL - SetupOpened another long swing position on CRYPTOCAP:SOL
Tp1 + BE : at $188 — recent highs
Tp2: at $295 — trend reversal area
Tp3: at $288 — target region
If you have any questions about my system or trade logic, drop them below — I read every comment 👇

SOLUSDT 15m time frame bounce target.SOLUSDT has formed a bearish pattern on the 15min timeframe, with potential targets at 159 and 151.
I wouldn’t take a short entry here. Instead, I’ll wait for a bounce. Shorting now would be a counter-trade.
I’ve drawn a possible bounce zone, with a good entry point around the shorters’ TP2 at 151.
Another scenario involves a liquidity sweep before dropping to TP2, which would indicate a stronger bearish move.
The last possibility is a break above the liquidity sweep area, followed by consolidation and either a new high or a bullish structure formation. In that case, we could consider buying in that zone.
this is same scenario with doge but in 1hr time frame.

HolderStat┆SOLUSD rebound from supportCRYPTOCAP:SOL revisits the 150 pivot inside a corrective wedge, yet April’s growing channel stays intact. Confluence of horizontal demand, wedge resistance and prior consolidation tips a comeback toward 175, then the 185 ceiling, as long as trendline cradle support endures.

Solana Long Setup – Chart Analysis (June 5, 2025)We are the SeoVereign Trading Team.
With sharp insight and precise analysis, we regularly share trading ideas on Bitcoin and other major assets—always guided by structure, sentiment, and momentum.
🔔 Follow us to never miss a market update.
--------------------------------------------------------------------------------------------------------
Solana technical analysis is presented as follows.
Currently, Solana appears to have entered the final WAVE 5 phase of the 5-wave upward structure. The technical basis is as follows.
WAVE 5 = (WAVE 1 ~ WAVE 3) × 0.618
This length ratio is commonly observed in Elliott Wave Theory and often appears in the final wave of a strong trend. At the current level, this ratio is applied accurately, leaving room for further upside.
Confirmation of the Shark Pattern
One of the advanced harmonic patterns, the Shark pattern, has been completed within a valid zone, acting as a bullish reversal signal. In particular, reversals occurring at the 88.6% and 113% levels provide high reliability.
Comprehensive Assessment
With both of these technical elements satisfied simultaneously, the current level offers a solid basis for entering a long position.
1st target: 158.20
This price level aligns with a major structural resistance and Fibonacci extension zone, making it an appropriate target for short-term profit-taking.

Solana Can Go Up AgainBINANCE:SOLUSDT.P
I am sharing this analysis for myself, it is not investment advice.

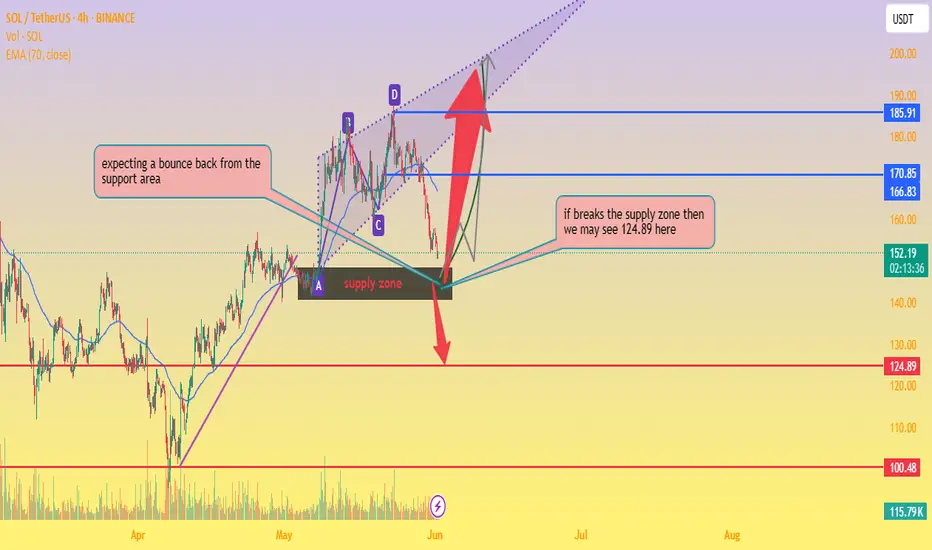
SOL/USDT Key Reversal Zone – Bounce or Breakdown?📊 Chart Analysis:
Current Price: $151.91
EMA 70 (Dynamic Resistance): $166.82
Support Area: Around $150, overlapping with a key supply zone.
Chart Pattern: Harmonic/ABCD structure completing near support.
🧠 Observations:
Price is testing a strong support/supply zone.
📦 If bounce occurs, potential targets:
🎯 First Target: $170.85
🎯 Second Target: $185.91
📉 If support breaks, then:
⚠️ Target: $124.89
📉 Next Major Support: $100.48
🧭 Trade Plan:
🔹 Long Entry (on bullish confirmation):
Entry: $152–$155
SL: Below $149
TP1: $170.85 🎯
TP2: $200 🚀
🔹 Short Entry (on breakdown confirmation):
Entry: Below $148
SL: Above $153
TP: $124.89 🧨
support and drop down your thoughts about it thanks
SOL Structural Analysis – Facing Weekly Resistance and Key LevelOn the 4H chart of Solana (SOL), the price has broken out of a temporary bullish trend and entered a clearly defined descending channel.
🔸 The major resistance around $164–$172 could limit further upside in the short term.
🔸 A confirmed breakdown below the $150 support may lead to a deeper correction toward the $115 zone.
🔸 The descending channel is currently guiding price action, and reactions to its midline and upper boundary will determine the next major move.
🔸 The analysis distinguishes between short-term impulses and the dominant daily downtrend, helping identify potential trade setups.
📌 This analysis is for educational purposes only.
