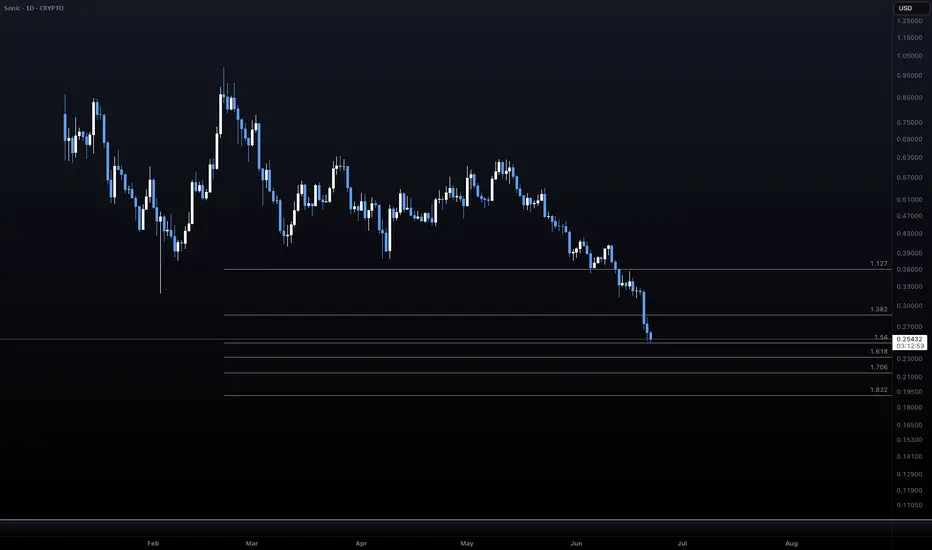
Sonic (FTM) coming into supportSonic made a new low like I was expecting after breaking key support.
We're coming into the first zone of support now, with targets extending quite deep if the bulls don't step in here.
SONIUSD trade ideas
ABC correction into 5 wave EWTFrom Feburary high we've had our ABC correction and now in our 5 wave EWT. Wave 5 targets projected. i've used the green to show the micro 5 wave to get to my macro 5th wave.

FTM Delisting | OFICIALLY Becoming SONIC (S)Although a name change for FTM was announced in Aug 2024 already, many exchanges still list FTM, and this will soon change.
It is expected the Fantom will officially be delisted and become SONIC within the next two months.
In August 2024, Sonic Labs announced that they would be replacing Fantom with a new token called Sonic (S). Sonic Labs have confirmed that all existing FTM holders would be able to convert to S at a fixed rate of 1 FTM : 1 S. However, many exchanges will only transfer now, as they will finally be delisting FTM for good and converting all FTM S. This will be done at a conversion rate of 1:1.
_________________________
Make sure you don't miss the latest ETH update, since BTC is likely heading towards a new ATH and ETH stands much more to gain.
_________________
CRYPTO:SONIUSD
POLONIEX:FTMUSDT

SUSD 4H Chart – Easy Trend with RSI Signal!SUSD on the 4H chart is in a steady uptrend within a channel since February. After a drop to the 0.285 level, it’s now at 0.382, sitting near the channel’s midline. RSI is at 54.26, showing neutral momentum—room to move either way. The yellow line suggests a potential push to the channel top at 1.0000000 if the trend continues. On the downside, 0.3500000 is key support to watch.

S/USD to the Moon1. Indicators Present:
Ichimoku Cloud: Currently, the price is below the cloud, which generally indicates bearish conditions, but the cloud ahead seems thin, suggesting a potential breakout.
RSI (Relative Strength Index): The RSI is around 45.81, signaling neutral momentum but with a bullish divergence forming (higher lows in RSI while price was making lower lows).
MACD (Moving Average Convergence Divergence): The MACD histogram shows weakening bearish momentum with a potential crossover signal brewing.
2. Chart Patterns and Projections:
The orange ABCDE structure represents a potential Elliott Wave triangle pattern, suggesting consolidation before a breakout.
The projected breakout area (E to upwards arrow) suggests a bullish resolution with targets at:
1.255 USD (1.0 Fibonacci extension)
1.477 USD (1.618 Fibonacci extension)
The long-term projection goes even higher toward the 2.0 USD psychological level.
3. Fib Retracement/Extension:
There is a Fibonacci extension measured with the 1.272 at 1.24 USD and 1.618 at 1.47 USD, aligning with the breakout targets.
4. Volume:
Volume has been tapering off, typical in triangle formations before a breakout.
5. Overall Bias:
The chart suggests a bullish bias in the medium term after the triangle pattern completes.
Confirmation would be a breakout above the Ichimoku cloud and the triangle resistance (blue horizontal line).

Sonic (FTM) bullish corrective ideaLooking for a possible bullish correction to the .382 for continuation upwards in SONIC.
If we break below the 0.5 I wouldn't rule out a new low, although many levels of support inbetween.

Bullish Breakout for Sonic – Ideal Entry Levels to Watch!SET:SONIC (previously FTM) has broken above $0.733, confirming bullish momentum. However, a short-term pullback toward $0.645 - $0.618 could offer a better entry before the next move higher.
If support holds, the price may target $0.85 - $1.00, while a drop below $0.55 could weaken the bullish outlook. Patience is key for an optimal risk-reward setup.

TVL PRICE MATCH $9
Hodl gang: this coin is strong as hell. Hold it you will get money either now or 3 years from now but then it will be gone more expensive than most top 50mc coins.
