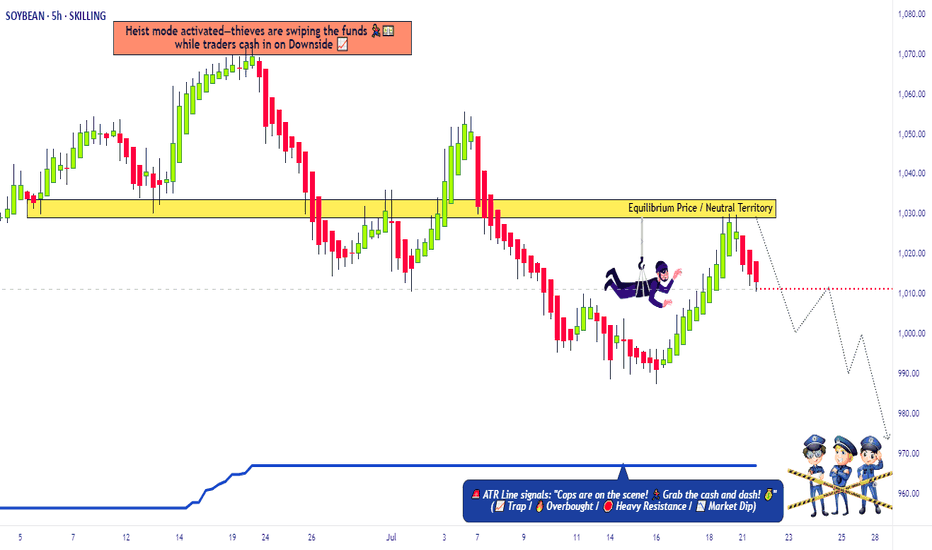
SoyBeans Price Reversal – Time to Swipe Bearish Profits🔓 Operation SoyBeans: Vault Breach Underway! 💼🌾
🌟Hi! Hola! Ola! Bonjour! Hallo! Marhaba!🌟
Calling All Market Bandits, Scalping Buccaneers & Swinging Looters 🕵️♂️💰💣
We've marked our next robbery target—the "SoyBeans" Commodities CFD Market.
This isn’t just a trade, it’s an orchestrated heist built
Soybean Breakout – Time to Steal Profits!🚨 "SOYBEAN HEIST ALERT: Bullish Loot Ahead! 🎯💰 (Thief Trading Strategy)"
🌟 Greetings, Market Pirates & Profit Raiders! 🌟
"The vault is unlocked—time to plunder the 🌱🍃SOYBEAN CFD market! Here’s your master plan for a smooth heist."
🔎 TRADE SETUP (Thief Edition)
Entry 📈: "Buy the dip or chase the br
Stealing from bears: soybean long setup!🚨 THE GREAT SOYBEAN HEIST: Bullish Raid Plan (Swing/Day Trade) 🏴☠️💸
🌟 ATTENTION, MARKET BANDITS & MONEY SNATCHERS! 🌟
(Hola! Oi! Bonjour! Salaam! Guten Tag!)
🔥 Using the ruthless Thief Trading Strategy (TA + FA), we’re executing a bullish raid on the SOYBEAN Commodities CFD Market! Time to steal pr
"SOYBEANS" Commodities CFD Market Bearish Heist (Swing Trade)🌟Hi! Hola! Ola! Bonjour! Hallo! Marhaba!🌟
Dear Money Makers & Robbers, 🤑💰💸✈️
Based on 🔥Thief Trading style technical and fundamental analysis🔥, here is our master plan to heist the 🥔🍀🍃SOYBEAN🍃🥔🍀 Commodities CFD Market. Please adhere to the strategy I've outlined in the chart, which emphasizes long
Symmetrical Triangle Breakout Incoming?### **Soybean (USD) – Symmetrical Triangle Breakout Incoming?**
Soybean prices are consolidating within a **symmetrical triangle** on the **30-minute timeframe**, indicating an imminent breakout.
### **Key Observations:**
✅ **Symmetrical Triangle Formation** – Price is tightening, forming hi
Soybean Market Dynamics: Supply Shifts and Price StabilityGlobal soybean ending stocks are up 1.1 million tons to 122.5 million, while US stocks are down 5 million bushels to 375 million. Despite these fluctuations, soybean prices remain stable at $9.95 per bushel.
Global Soybean Supply: A Tale of Two Regions
The WASDE report highlights not so simple p
Long trade SoybeansWe have seasonal tendencies for Soybeans to be bullish
We have a divergence between soybeans and Wheat were Soybeans are the leader in strenght.
We have a bullish Weekly OB to go long from with stopploss at halfpoint of that OB.
This is a swing trade that I will hold until target or June were seaso
"SOYBEAN" Commodities CFD Market Bearish Heist (Swing/Day Trade)🌟Hi! Hola! Ola! Bonjour! Hallo! Marhaba!🌟
Dear Money Makers & Robbers, 🤑 💰💸✈️
Based on 🔥Thief Trading style technical and fundamental analysis🔥, here is our master plan to heist the 🥔🍀🍃SOYBEAN🍃🥔🍀 Commodities CFD Market. Please adhere to the strategy I've outlined in the chart, which emphasizes long
"SoyBeans" Commodities CFD Market Robbery Plan (Swing Trade)🌟Hi! Hola! Ola! Bonjour! Hallo! Marhaba!🌟
Dear Money Makers & Robbers, 🤑💰✈️
Based on 🔥Thief Trading style technical and fundamental analysis🔥, here is our master plan to heist the "SoyBeans" Commodities CFD Market. Please adhere to the strategy I've outlined in the chart, which emphasizes short ent
Soybean Market Trends: Impact of Exports and Production ForecastProduction Forecasts and Supply Adjustments
The USDA's latest projections indicate a downward revision in global soybean production, primarily due to adverse weather conditions in South America. Brazil, the world’s largest soybean producer, has faced inconsistent rainfall patterns, leading to a pro
See all ideas
Displays a symbol's price movements over previous years to identify recurring trends.


