SOYBEANS trade ideas

SOYBEAN Long Term PictureAll this really is, is a long term impulse & correction, most likely will get a move down, before going back up.


Soybeans: It takes time to make a moveIf we look to two patterns, the triangles green and red the both need some time to finish the pattern.
If we look on fractal basis we can come to an other conclusion. The fractal comparison of this pattern could give some indication in what direction we could go but this is not an outcome for sure... but it can help for decision making.
In 2015/2016 we can see a little triangle which breaks out in the spring of 2016...
If we extrapolate this pattern to the timeframe in 2017 the big triangles look very promising and we could foresee much higher prices ...
Time will tell...

SOYBEANDown Trend.
Price outside the upper band of regression line.
Bearish divergence.
Extreme move to the upside.


soybnusdsell after the breakout basing on your own strategy , i just give you the sens of the direction


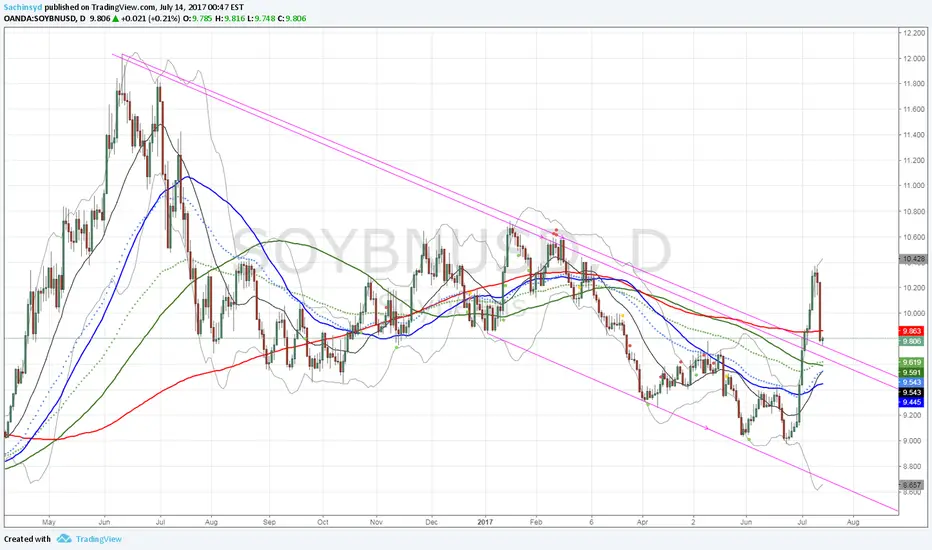
Soybean is about to have a bullish breakoutBased on that soybean has bottomed near 8.5 during end of 2015, the subsequent rise to 12 is an impulse wave, followed by an ABC correction to 9.
Since Jun 2017, we have another impulse to 10.4, followed by a correction to 9.15.
Recommend: Long with a tight stop loss


Soybeans (Supply & Demand levels) 1H ChartSupply and Demand levels for Soybeans / 60
Dark red = Fresh supply zone
Light red = Re-tested supply zone
Green = Fresh demand zone
Light Green = Re-tested demand zones
Short term analysis:
Price is moving in a bullish channel with price pulling back from Point of Control (VPS). Lower channel trendline is close to two fresh demand zones supported by high volume.
Bearish scenario:
Price pullback to demand zones and fails to continue breaking below the 10$ psychological level. This could result in a move down to 9.85$. Additional support is likely to be found at 9.783$, Daily chart pivot point.
Bullish scenario:
Buy orders are filled at the two fresh demand zones and price re-enter channel. Strong supply lies in the range of 10.24$- 10.60$. Past that level notable supply can be found between 10.339$ / 10.367$


#Soybeans reacting @ 6M DZ creatign new W DZ..Long we go!6M DZ in control, W downtrend broken, new W Dz creating, with positive Priceaction for Bulls, with Engulfing Patterns..long Bias till 10.700-11.000


BUTY SETUPLong correction from last impulse is about to over therefore i ecpect another impulse to target as marked on chart.
We have a clear divergance in MACD .
Cross market analysis in soft commodities shows similar projections.
Dollar is getting weaker which supports higher price ofcommodities in general.
Wait for an impulse on lower timeframes to confirm bull market.
Good luck !

Close below sma 20 on hidden momo divergenceAlso OB on downtrend near resistance. Corn & wheat already started to pullback.

Soybeans: A Look at Current MarketOverall, market is down but could be in final stages of down trend from 2012 highs
Monthly Chart
In the March/April time frame, the DMI changed to where the -DI is dominant. The ADX continues to trend down signaling whichever dominant trend is not that strong. Current targeted support is 8.910. Though, there is an area in the +/-8.000 range that has provided support in the past. With the ADX approaching 20, it is possible that the 8 range (green on monthly chart) provides support for consolidation before next major trend develops.
Weekly Chart
The weekly chart has a more bearish definition to it.
DMI - A sell trigger was hit the week of 3/6 at 9.972. The -DI is dominant so the TRIX will be used to drive exit and potential re-entry.
TRIX - On week of 4/10, the TRIX signaled a potential exit. Price did close above this line during week of 5/1 but next week failed to follow-thru. So, weekly traders would have remained in trade. This week (5/29) will verify the down trend is continuing if TRIX holds below HMA.
Daily Chart
The daily chart has provided several sell triggers with most recent at 9.356. Price is currently sitting on previous support at 9.035
4hr Chart
The 4hr chart has several interesting concepts on it.
(1) A sell trigger occurred on 5/17 at 9.562
(2) The TRIX indicated a cover of short on 5/18. With next period follow-thru, the short would have been exited
(3) A buy trigger occurred on 5/21. However, there was no follow-thru so a long position would not have been taken
(4) When the ADX drops below both DI's and/or 20, trend trading should be put on hold and a price pattern for consolidation should be identified. From the consolidation, look for a breakout to trade. Some potential items to watch are:
DMI - During this time, there were several triggers but only last had follow-thru
TRIX - The TRIX dropped below 0 (bearish) and then pulled back but remained below 0 before continuing down again with the next trigger
(5) Sell trigger at 9.361 with follow-thru and new short entered
(6) A developing continuation pattern. I've seen these occur when the next time frame up (daily in this case) is developing a sustained trend. The TRIX/HMA combo indicate a new res->sup line but price fails to close and hold above it. If not stopped out, then continue to hold short.

SELL SETUPWe had impulse down and we are having flag in making.
Wait for breakout of trendline to catch another wave downn.


soybeans...looking for ending correction as you see the candles of trend (falling ) are tall and on correction are weak so im waitinf for ending correction and entry to sell after a good bearish candle
