Short SoybeanShort soybean, against trend but look OB and a spinning top in the making, wil wait for daily candle to finish.
SOYBNUSD trade ideas


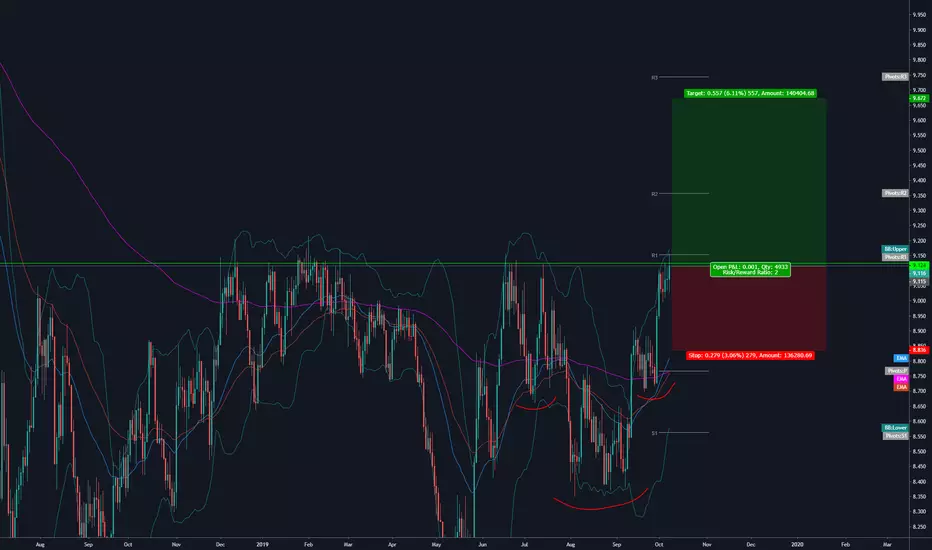
Long Term Bullish Movement on Soybeans by ThinkingAntsOkDAILY CHART EXPLANATION:
On this timeframe, we observe that at this moment the Resistance Zone is trying to be broken. if price can consolidate above, then we expect a corrective movement towards the Support Zone (broken resistance zone) before continuing the Bullish Movement. The first target of the upside move is the Resistance Zone at 10.30 zone.
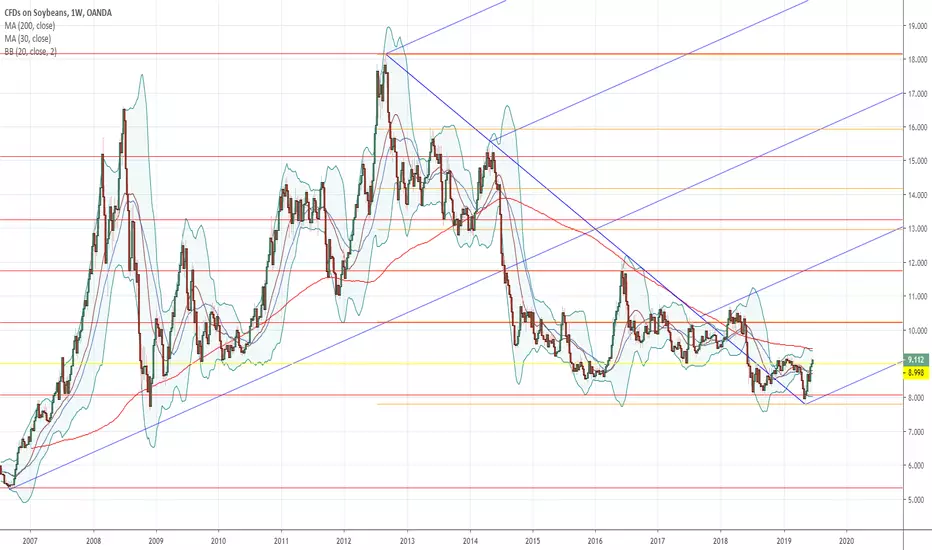
WEEKLY CHART ANALYSIS:

SOYBEANS - Long Idea.I have been watching Soybean futures for sometime now...traded a pullback a few months ago. My broker really is not good in terms of spreads, and even at 5pm spread "pops" whatever you guys call it when the spread explodes at swap time. Anyways. I see that price for several reasons has "bean" climbing. I think, we are going to break to the upside. I see an inverse head and shoulders plus this line in the sand (green) has been challenged so many times. A real tell for me is that for days now price has been going sideways and not showing rejection as one may expect. I will not trade this. -Happy Trading!
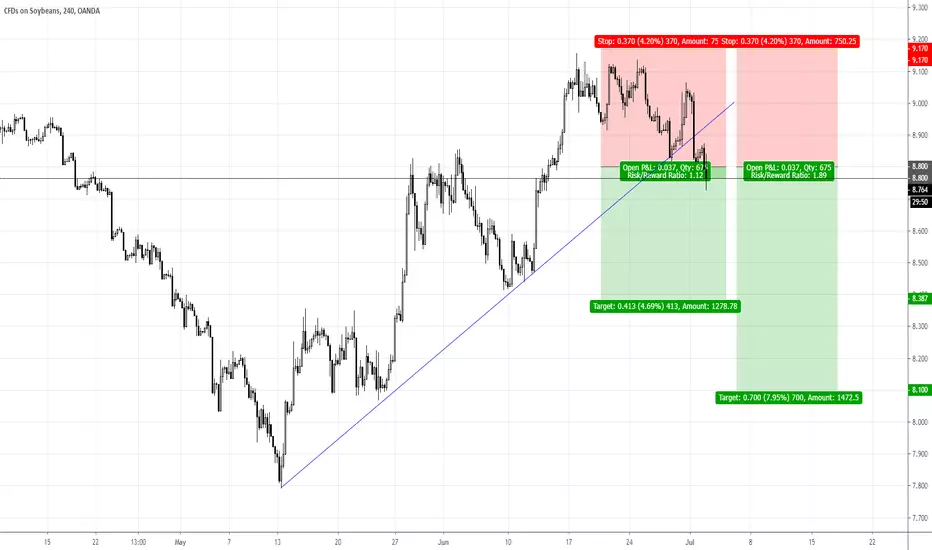
Soybean Daily Downside Channel Breakout Pullback LONG Soybean is significantly above the psychologically key 900 whole figure level and downside channel in the daily time frame.
In the 4H chart, the upside channel is formed and we consider BUY soybean. The MACD also gives another reference to help confirm the trade.
We are waiting for the pullback to the structure support combine with 0.618 retracement.

Branless Buy. Start of Uptrend. Very bullish technicals for a long solid trend.
Price is at demand zone which means get in!


Soybean#Soyf H1 Buy
Soybean
ID : 5-14
At : 872.3
SL : 864.0 - Risk 83 pip
TP : 891.1 - Reward 188 pip
Date : 2019/08/30


Soybeans Fake out?Like what I am seeing here on Soybeans. We have a fake out indicated by the long wick at a very big support zone which can also be seen on the longer term charts.
This interests me because of the long downtrend with multiple waves we have been in. You can also say we have created a double top too. Waiting for a break of the lower high swing and also a flip zone at 8.51. Will provide more context and confluence for out trade.
Many will be inclined to stay away due to the US-China trade war. However, China NEEDS food. They have had their pig population decimated due to the flu and the government is subsidizing pork prices. They do have a food problem and even though tariffs may be implemented, China requires food. Brazil and Russia may be the agricultural winners here.

Soybean short 8pm EST at market BUTwait for the spread to tighten. Stop @ 863.90
The price on these charts ar 100th of my trading account which makes it around 8.6390 Always use a stop loss and protect your working capital.

Possible outcomes for Soybeans tradingAs from the current chart configuration, soybeans show us 2 possible outcomes. OANDA:SOYBNUSD is downtrending since mid july and might continue. The 8.47 level have been acting as support and resistance way back july 2018. The level have shown interest again twice this year.
Knowing this, price should either break the level or bounced. in the scenario price break the support level, we expect it to hit the 8.079 level. Else, a bounce back to 8.748 level is the nearest possible long target.
So what do you think?
Subscribe to my youtube channel for recent updates
www.youtube.com

Bearish Trend Coming on Soybeans by ThinkingAntsOk4H CHART EXPLANATION:
The 4H corrective movement was broke a few days ago, it was an Ascending Structure correcting the previous Downside impulse. Now it seems that price is trying to continue towards the Support Zone. If this one is broke then there are two Daily Support Zones at 8.10 and the other at 7.80.
MULTI TIMEFRAME VISION:
-Daily:
-Weekly:


Soybeans (SOYBNUSD) long.All description on the chart.
Please, don't forget to like and follow.
Thank you.

Bearish Potential on Soybeans by ThinkingAntsOk4H CHART EXPLANATION:
At the beggining of May, price started a strong bullish movement towards the Weekly Descending Trendline. Once it faced the zone, it could not consolidate above and the trend became weaker. Then started moving sideways and it has recently formed a Triangle Patter, which was broke downwards yesterday. We expect a downside move towards the Multiple Support Zones.
MULTI TIMEFRAME ANALYSIS:
-Daily:
-Weekly:

Soybeans very nice consolidations linesPrice respecting these trend lines very accurately.
Commodities like Soybean, Corn, Wheat and Sugar are great great markets for this type of trading because of the low manipulation from the big banks.
Let's see where the price goes next.


#soya_bean #Analysis.#soya_bean #Analysis.
Distribution is completed in Soya_Beans H4 chart i'm expecting falling prices soon.

soybeansChina doesn’t start making its largest purchases usually until October.
Dollar strength, trade wars. this year we could see earlier purchasing
Buy on anything under $9