SOYF trade ideas

Soybeans (SOYBNUSD)- In the latest prospective planting document, it was reported that acreage allocated for soybeans will increase by 7% this upcoming season. This means that soybean is fundamentally bullish. Analysis from previous reports show that there is an 80% correlation between an increase in acreage and an increase in prices 10-days post the release of the report. Additionally, there is a perfect correlation between an increase in acreage and an increase in prices 20-days post. Regardless of acreage changes, soybeans prices have gone up 7 times out of the last 10 years 20-days post of the release of the prospective planting report.
- It is anticipated that soybeans will drop to the next major support line before heading back up
- Entry price will be approximately 9.16
- There is also a Gartley pattern, with the D point @ 9.20, which is confluent with the support line
- First profit target will be at 10.260, however prices will likely go higher
- Note: The D point of the gartley can drawn by using a 78.6% retracement of the XA leg


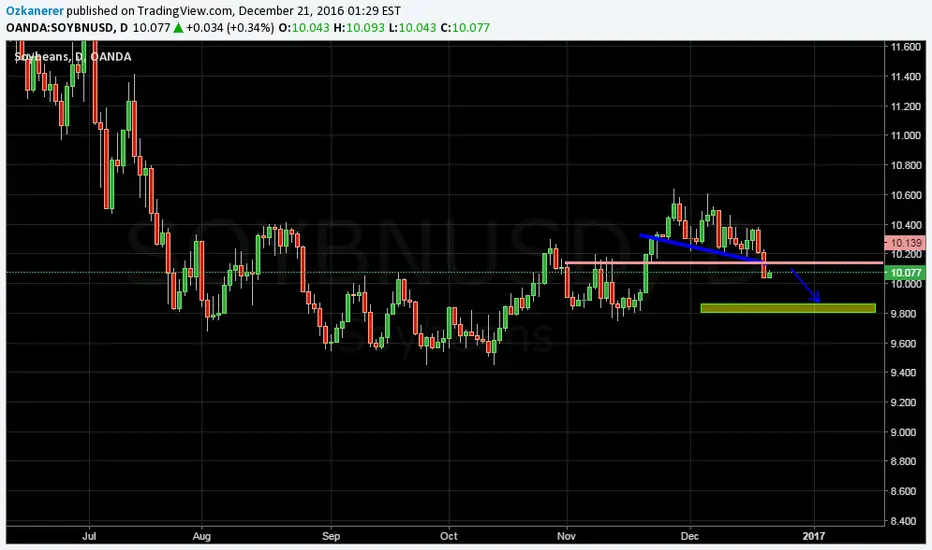
soybean...fallingvery typical example on trending in my strategy ...
1 - when chart started to go upside it broke descending trend line but couldnt passing out of a pivot point .....so ....chart return to falling
2 - after chart couldnt pass of a pivot it started to falling and after broke ascending tl it also has passed out of a pivot point
result :
after breakout of a tl and passing out of pivot point in my idea trend is downtrend now...
wish be useful .....good luck

Soybeans LongThe market had been in an uptrend after that had made deep correction and formed bottom. The price started to make higher highs and higher lows which is indicator that the marker is preparing to get back in an uptrend. The 200 EMA is also pointing higher. Set a limit order which was activated after that the price went against me but didn't manage to hit the stop loss. Expect further higher move.

Bearish Fundamental for SoybeansLong-term fundamental is bearish. US has big soybeans stocks, export is falling. Harvest in Brazil and potentially big crop in South America adds bearish sentiment. Weekly chart shows rejection of VAH, price moves down inside balance, so I'm waiting the continuation of price falling.


Soybeans Bullish Gartley and My Short Term ViewPlease keep in mind when reading all of my charts I am still a novice and have very much to learn! But I still enjoy sharing my thoughts and interacting with the community, so here it is:
The trend seems to be up so I like looking for a buy. The bullish Gartley completes at 10.437. This may be located on the trendline depending on when it completes, but seems it will be a zone of support. Stop losses for this trade would be below the dashed red line around 10.374. Targets would be the .382 (breakeven and half position) and .618 (rest of position or trail stop loss) and aim for the top of the structure (green zone is an approximation). Should price come to the completion point of the pattern I will also check my indicators but as it looks now I believe I will take this trade.
Note that a strong rise may form a bearish AB=CD patterns 10.85. I have linked an idea regarding this trade below.
Please let me know what you think of this idea and share your views on Soybeans with me. If you have any constructive criticism I am certainly open to that too as I know I have a lot to learn. Cheers!

Soybeans: Potential Confluence of 2 Bearish AB=CD PatternsMy main idea here is to watch for weakness and short in the red area which is the completion of the two bearish AB=CD patterns shown in the chart. There is also a longer term downtrend line at this zone which would be a nice place to enter. At that point I will also look for divergence in my indicators, as well as check for any warning signs such as large bullish candles, etc.
For this idea to play out Soybeans still has room to the upside but there is of course the possibility that these patterns do not complete. So for the shorter term I am watching for trade set-ups in either direction with a slightly bullish bias.
Your comments and feedback are always welcome and appreciated.


Soybeans: My Long Term Perspective and Possible PatternsIn the chart are potential patterns which I have identified on the long term Soybeans chart. While only some or even none may complete I will be using this idea as a journal which I am planning to update every week or two regarding the patterns in the chart or any new patterns which I can identify.
If the smallest AB=CD patterns shown fail the trendline will probably have also broken, which would suggest to me we could get enough bullish momentum to take us to the completion point of some of the larger patterns. I am very interested in seeing how this chart will play out.
If you have any views on Soybeans please share it with me!


bullish there is a bearish candle but im waiting for rising in this chart and im in now...
buy or new buy position after breaking trend line toward up


buy big bullish candle tell to us that chart has decided to start going toward up...
entry for high risk persons and the other after breakout ...
buy

Thoughts on Renko Charts (cont.)Since my last discussion on Renko Charts, I've made some changes to what my view of long term vs. short term is. Currently, I'm experimenting with a 2hr and 5 min chart
I'm continuing focus on my primary scenario of a breakout of price based on consolidation dictated by the ADX of the DMI. The general goal is to find 2hr charts that have an ADX reading of 20 or lower for at least 7-10 periods. During this period, identify a pattern (trend line, triangle, channel, support/resistance lines on price) and then look for price to breakout. However, instead of using the 2hr chart to identify the timing or trigger of the trade, use the 5min chart to make that determination.
Recent soybean chart can be used as an example. The last consolidation in price occurred at (B) in the form of a triangle on the 2hr chart. However, if you look at the 5min chart, the trade could have been triggered by its own breakout based on similar consolidation (A). Notice how the 5min chart expands on the actual movement of the 2hr chart.
An example of a continuation breakout can be seen in NGAS. Using this chart, (A) on the 2hr is just a one block pullback but the 5min chart shows a decomposition in price that ends with the ADX dropping below 20 forming a possible ascending triangle before price breaks out to the upside.
Corn is currently in an extended channel on the 2hr chart which has led to a similar pattern on the 5min chart. This could be a market that is ready to be traded on the breakout of the channel.


Current thinking on SoybeansI've included several charts here that high-lite some of my current thoughts on Soybeans. Starting with the monthly chart and then working through the weekly, daily, and then 4hr that has some thoughts on entry into the market to long side.
Weekly:
Daily:
4hr:

SOYA - its off the block now with volume i think SOYA is really taking off now, with its' Corre to gas ...and off the block with volume

Soybean staging for another run at resistanceIs soybeans setting the stage to make another run at an upper channel line of resistance started with the August 2012 high? Current weekly and daily action looks like this is the case. Should price continue up, how it responds will indicate if new shorting positions should be taken of existing longs can be held. Another option would be to hold longs with this line as target and then re-enter once price shows direction.
weekly:
daily:
