SOYF trade ideas


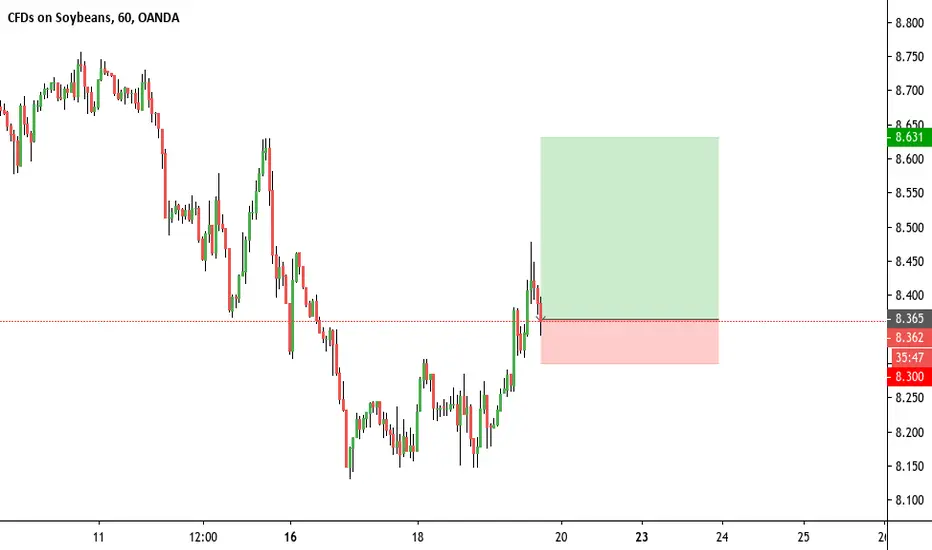
Soybeans - Long Idea.I think there will be a supply and demand issue with soybeans. The China trade issues heating up. I see upside on this tasteless little bean.
I probably wont trade this, laying out the technicals here, I have a wide stop as things could get real hairy.
That is a 2.2:1 RR.
Gets your stop below that $8 level. And the price target below a weekly 200 EMA.


Soybeans in down trendYou have to understand predicting the market isn't rocket science. Infact if you discount the time it goes sideways it will go either up or down. If you understand the supply and demand are around support and resistance areas you have likely price targets.
So say we can assume there's a 99% chance it will eventually get to 7 or 9 bucks. You could then flip a coin and 50% of the time you'd be right.
Something to consider when you hear ridiculous things like oh he controls the price of soy beans! No. It's about studying prices and making deductions. Traders then make decisions based on those deductions. So you see it isn't magic. And it isn't nefarious forces. And it would be great if the liberal media would study more before making absurd claims.


Soybean: head & shoulder form on weekly chchart. 1. we see Head & Shoulder form as marked by S-H-S on the chart.
2. with pearcing candle pattern w:P and bullish engulging candle W:BE form on the left shoulder. it for a long term support base.
3. we see few weeks ago where doji candle reject the long term support base which also forming the right shouder (potentially)
4. this bring us to the final clue: my fibonacci projection. will the price rally to $9.93 as shown in the chart?


SOYBN USD BUY (SOYBEANS - US DOLLAR)Hi there. Price is forming a reversal pattern to change its direction. Wait for the price to complete the pattern and watch strong price action for buy.


SOYBEAN - Long Idea. Soybeans showing some Bullish sentiment. This is a 6 hour chart.
I see a double bottom has formed and we have gotten the pullback to my Confirmation Fib.(50%)
-MACD Bullish Divergence
-RSI oversold.
Simple trade setup. Let's see what happens.
1% Risk 2:1RR

the power of 3,6,9i SEE you nicola...tbh ganns work is much more impressive. this is sick tho for sure!


SOYBNUSD SellFundamentals:
Global economic slowdown may decrease demand for soy products
Technicals:
Downside breakout-retest of uptrend

USD flexgood money here... could be a long term hold.. we'll see what kind of data we get in the next few days-week to come :D