Related indices
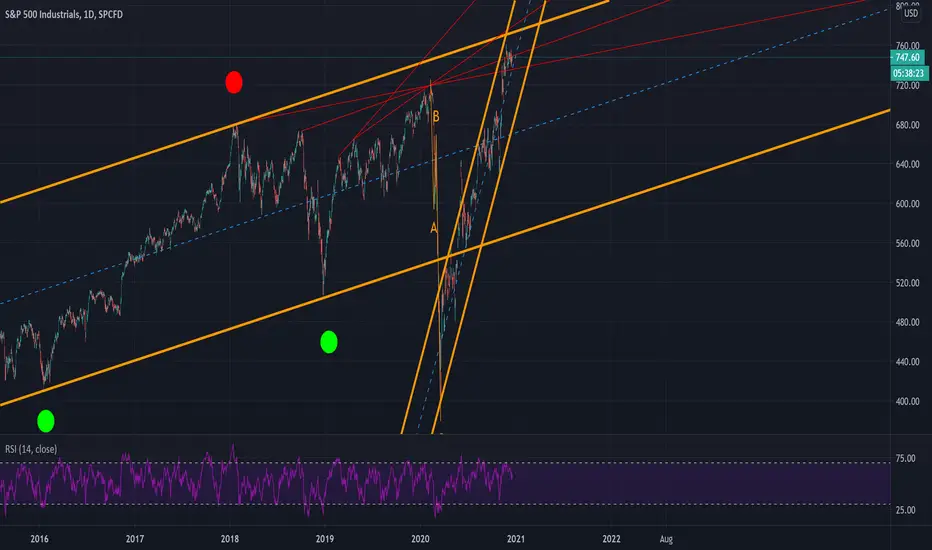

Industrial Sector in Trump's AmericaTariffs, tariffs, tariffs this is the word that will and has consistently beaten down the sector. So, now you ask yourself, "how far down can the sector go?" Well as the chart shows a critical juncture is coming. A bottom trend line that has been established for years now will come into play soon an

S&P 500 Industrials to S&P 500 Consumer Discretionary Ratio.S&P 500 Industrials relative to S&P 500 Consumer Discretionary.
25 years ratio low.
Similar setup with 1992, 2000, 2004.
Setup for a bottom, history says, “Buy” Industrials and “Sell” Discretionary. Out performance for 2-5 years thereafter.

See all ideas
Summarizing what the indicators are suggesting.
Oscillators
Neutral
SellBuy
Strong sellStrong buy
Strong sellSellNeutralBuyStrong buy
Oscillators
Neutral
SellBuy
Strong sellStrong buy
Strong sellSellNeutralBuyStrong buy
Summary
Neutral
SellBuy
Strong sellStrong buy
Strong sellSellNeutralBuyStrong buy
Summary
Neutral
SellBuy
Strong sellStrong buy
Strong sellSellNeutralBuyStrong buy
Summary
Neutral
SellBuy
Strong sellStrong buy
Strong sellSellNeutralBuyStrong buy
Moving Averages
Neutral
SellBuy
Strong sellStrong buy
Strong sellSellNeutralBuyStrong buy
Moving Averages
Neutral
SellBuy
Strong sellStrong buy
Strong sellSellNeutralBuyStrong buy
Displays a symbol's price movements over previous years to identify recurring trends.