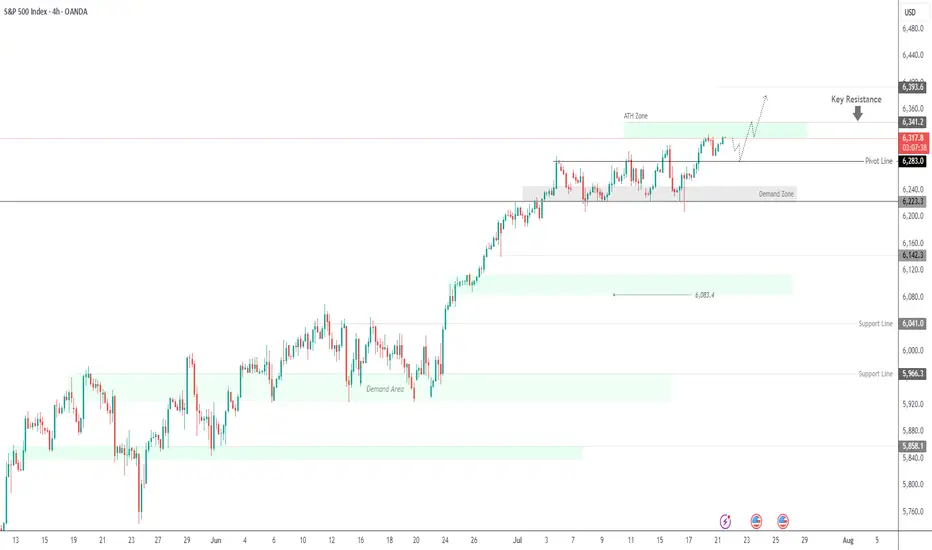
SPX500 Near ATH | Earnings Week Could Fuel Next MoveSPX500 | Weekly Outlook
The S&P 500 continues its bullish run, trading at record highs as investors await a critical week of tech earnings. Reports from Alphabet and Tesla could be key in justifying the lofty valuations driven by the AI boom.
Technical Outlook:
The price is expected to consolidate
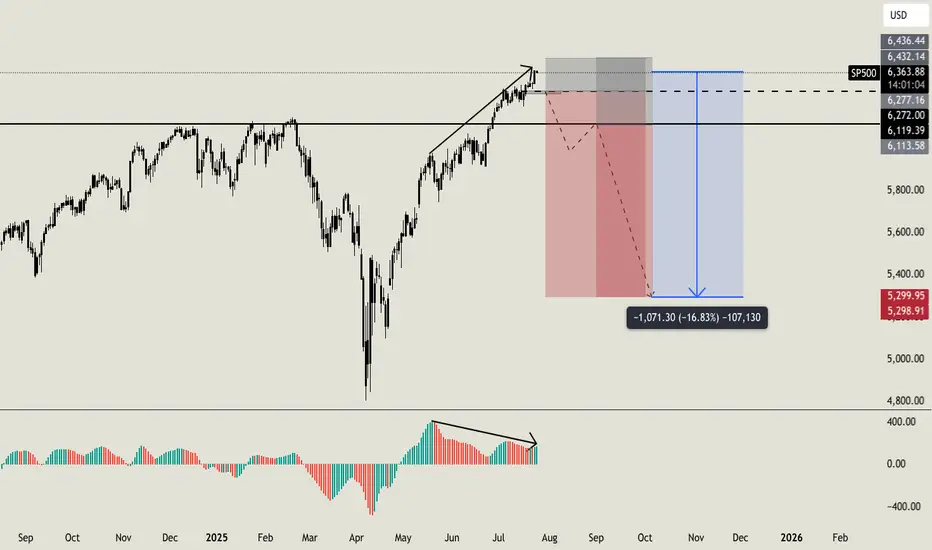
Do you want to keep buying SP500?Hello all. I usually love to work analyzing volumes, times and key level, i am not used to check the standard indicators, but this time i'll made an exception. Lot of indicators (AO, MACD, RSI, OBV) are showing weakness on higher timeframe with a strong bearish divergence (like the one i am sharing
S&P 500 and the Elliott Wave TheoryThis is a continuation of a Weekly chart that I had previously posted. Our Wave 2(Red) was a Zigzag and the expectation is a Flat for Wave 4(Red) which we see occurred. Since Wave 4(Red) completed, a Wave 5(Red) was triggered. We can expect our Wave 5 to express itself in 5 Waves just like any other

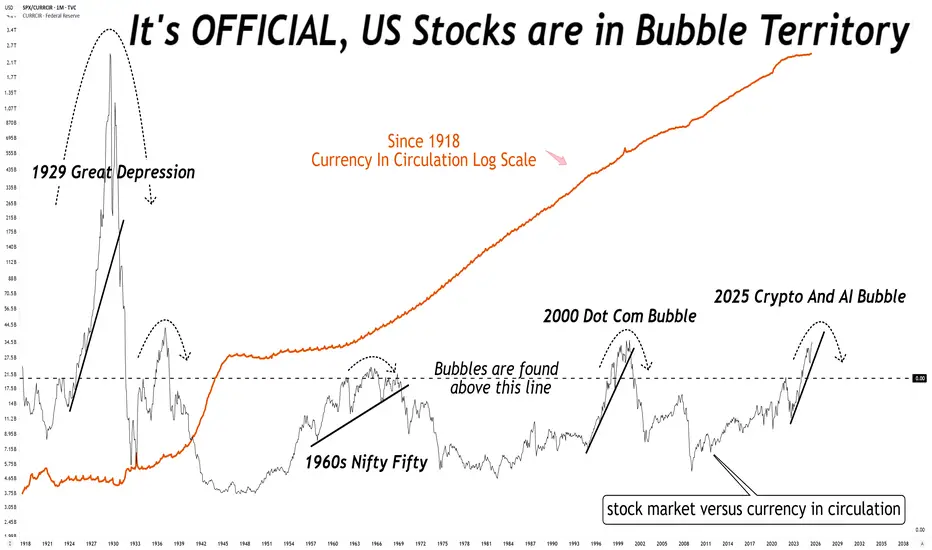
What do you mean the stock market is not in a bubble?What do you mean the stock market is not in a bubble?
No, it is not different this time, there is always a reversion to mean.
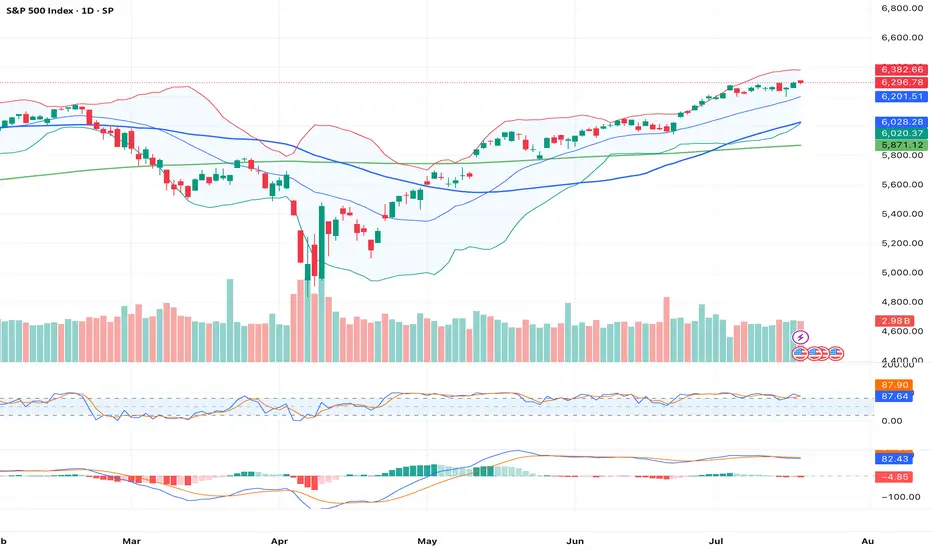
1_Day_ChartThis chart represents the 1-day (Daily timeframe) price action of the S&P 500 Index (SPX), offering a focused view of market sentiment, key levels, and trend momentum as of . Each candlestick reflects a full trading day.
📊 Chart Parameters:
Instrument: S&P 500 Index (SPX)
Timeframe: 1D (1-Day)
E
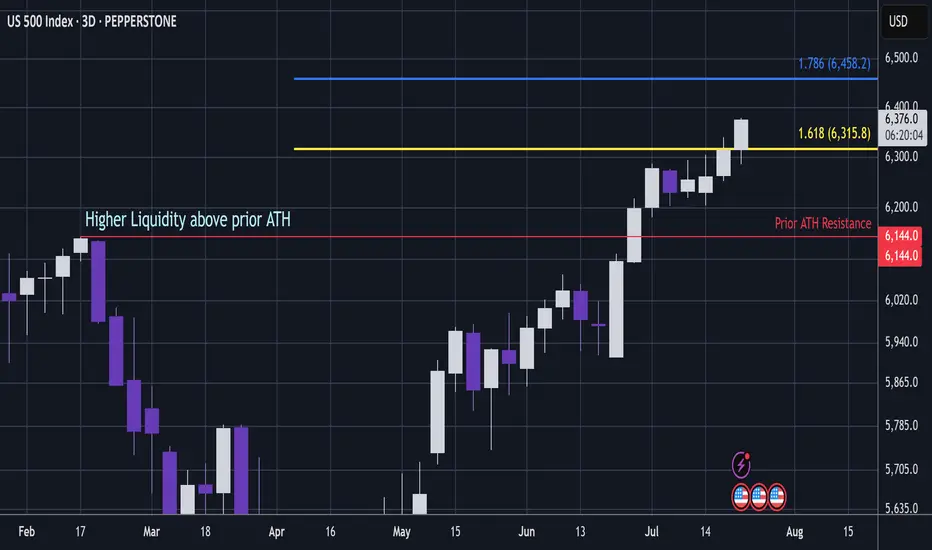
US500 - Can S&P Pass Critical Ratio / Liquidity ZoneS&P (Pepperstone CFD)
Price has popped above the 1.618 extension, which is a key ratio zone.
A bearish whipsaw in this area could be dangerous.
However, if price continues to push through this level, it signals that S&P is entering a very bullish phase.
The area above prior ATH resistance hold
S&P500 This is why every CORRECTION is a GIFT.The S&P500 index (SPX) has been steadily rising since the April bottom to new All Time Highs (ATH). On the grand 100 year scale, the February - March tariff fueled correction, has been nothing significant. The last true technical correction has been the 2022 Inflation Crisis because it touched, and

S&P 500 Counter-Trend Setup After Bullish Week US500Currently watching the S&P 500 (US500) closely 👀. The index has been in a strong bullish trend 📈, but I’m now evaluating a potential counter-trend opportunity.
Given the strength we’ve seen this week — possibly a “foolish rally” — there’s a chance we’ve either printed or are close to printing the h

S&P500 Critical short-term crossroads.The S&P500 index (SPX) has been trading within a Channel Up since for the entirety of July and right now is ahead of important crossroads. It either breaks out above the pattern or pulls back to price a new Higher Low.
Based on the 4H CCI and the similarities with the June 24 - 25 consolidation, th

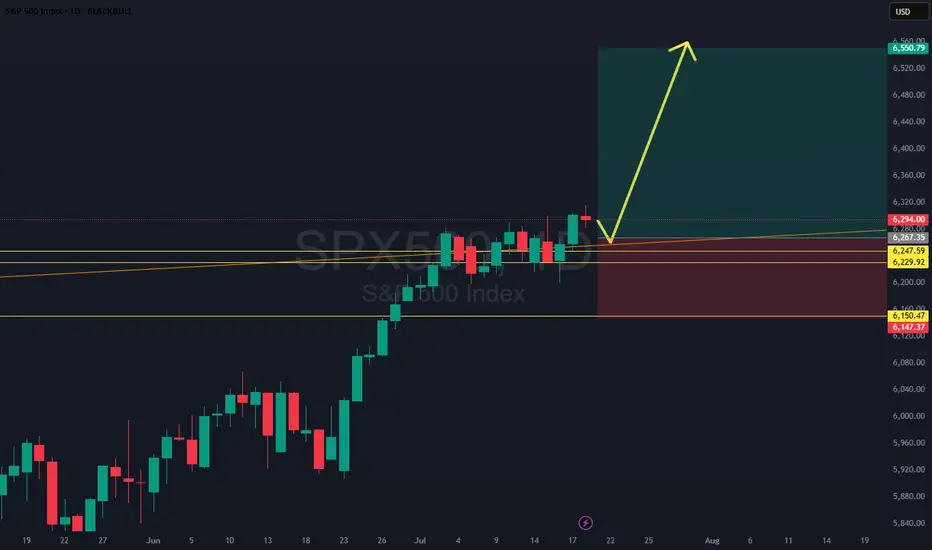
SPX500: Clean Breakout Setup - Trade of the Week?SPX500 just broke and closed above a key daily level, confirming strength after a bull flag formed off a skinny leg up. The plan? Wait for a retest of that flag structure, then ride momentum higher. We’ve got a conservative stop below solid support, making this one of the cleanest, most technically
See all ideas
Displays a symbol's price movements over previous years to identify recurring trends.
Frequently Asked Questions
S&P Index Cash CFD (USD) reached its highest quote on Jul 18, 2025 — 6,319.43 USD. See more data on the S&P Index Cash CFD (USD) chart.
The lowest ever quote of S&P Index Cash CFD (USD) is 2,177.62 USD. It was reached on Mar 23, 2020. See more data on the S&P Index Cash CFD (USD) chart.
S&P Index Cash CFD (USD) is just a number that lets you track performance of the instruments comprising the index, so you can't invest in it directly. But you can buy S&P Index Cash CFD (USD) futures or funds or invest in its components.