SPX500 – Volatile Week Ahead as Trade Talks and CPI LoomSPX500 | Overview
Fundamental Insight:
S&P 500 futures edged lower early Monday as traders brace for a high-impact week.
Key events include:
- US-China trade talks in London (Monday)
- U.S. inflation data (CPI) expected midweek (Wednesday)
Markets are cautious, awaiting clarity from both geopolitical developments and macroeconomic indicators, which could trigger strong directional moves.
Technical Outlook:
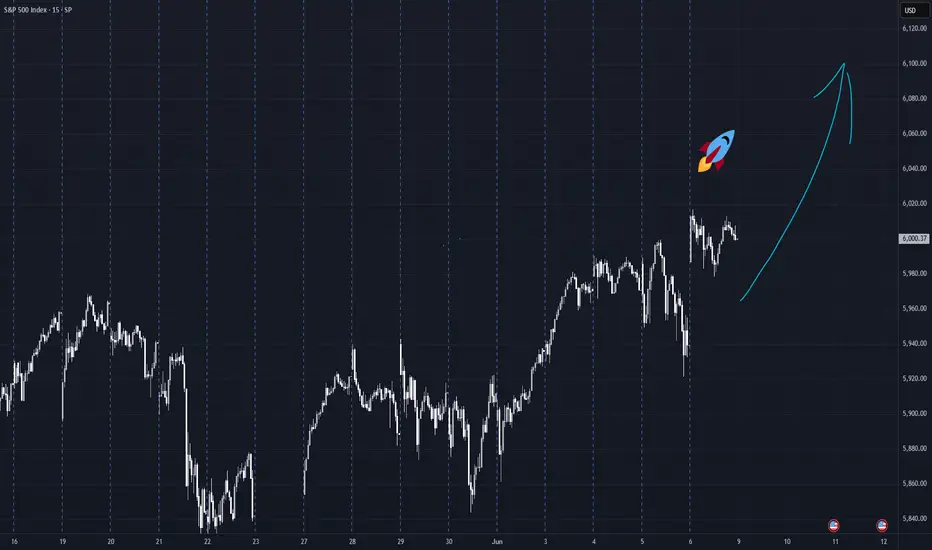
The price appears to be entering a correction phase, with the potential to drop toward 5966.
A confirmed break below 5966 may extend the bearish trend toward 5938 and 5902.
However, a break above 6030 would invalidate the bearish scenario and could trigger a bullish continuation toward 6098 and potentially a new all-time high (ATH).
Pivot Line: 6010
Support Levels: 5966, 5938, 5902
Resistance Levels: 6030, 6098
SP500 trade ideas

S&P500 Short: Ending DiagonalHi all, over here, I presented a cleaned-up chart of the EW counts for S&P500 and gave 2 entry points for shorting. The most important points are here:
1. 5th wave completion (or completing)
2. Ending Diagonal: will follow a sharp move down.
Alternatively, you can wait for a breakdown of the lower trendline to short.
Good luck!

You're all doomedEveryone has gone full bull again. The selloff is not over. The selloff is about to resume. The shorts are MIA. Down til Christmas. Starts this week.

SPX - way to ATH in June SPX with a gap just below last season, having all its SMAs aligned and head funds heavily short, I am sure we are on our way to new ATHs. A little shake out to find support on sma50 could be expected, but for now the strategy would be BTD! - no financial advice.

5821 target beaeish flowBeen awhile since I posted to spy channel.
Ive observed a negative flow, with a bearish apex on the 2hr futures chart. My target is 5820. Fail attempt to breakout above 600 on spy, this appears ro be a liquidity grab by smart moneym I will break chart down further into layers

SPX showing break from ascending triangleSPX500 futures daily chart showing break from ascending triangle. Expecting upside move towards 6100 in coming days

Remaining bullish on SPX and how I think through my chartsVideo Recap: The Zoomed Out View
Weekly moving averages are reordering and turning up
The weekly chart shows that the 10EMA and 20EMA have now crossed the 50SMA and are turning up. That reordering adds strength to the broader trend. This past week, the index reclaimed 6,000, which is a key psychological level. And we also saw price bounce off the uptrend line drawn from the April low, showing buyers are still defending key areas of support.
Daily pullback found support
The daily chart gave us a pullback the Friday before last, but it held right at a confluence of support (the 20EMA and 200SMA), along with a horizontal level drawn from the weekly timeframe.
Digestion periods can shake you out if you’re too zoomed in
The last few weeks have been a reminder that chop can test your patience and your plan. We didn’t break trend, we just pulled back to support. But if you’re too zoomed in, it can feel like everything is shifting. That’s when stops get hit early, trades get closed prematurely, and new positions get put on for the wrong reasons. In reality, this was just a normal digestion after a strong move. And when in doubt, zooming out brings the clarity back.
Trendlines and levels are guides, not absolutes
There were a few moments in my chart review this week where I caught myself trying to make lines matter more than they do. But these tools (trendlines, moving averages, support and resistance) only matter in the context of what price is doing around them. Structure tells the real story. One line getting hit or crossed doesn’t mean the whole thesis breaks down. What matters is whether buyers step in, whether trend resumes, and whether your trade idea still fits your system.
So what now? Here’s what I’ll be watching this week:
We’re holding above all major MAs.
If we push through the February all-time high, that can shift sentiment, especially for retail traders who may see that as a signal that “we’re in the clear.”
If we stall below the ATH, that wouldn’t be a problem by itself, but I’d watch how price behaves...ie are we pulling back constructively or losing key levels?
I’m not leaning bearish and won't be unless we start closing below 5,800 (200SMA) and definitely if we can't hold the rising 50SMA. (My second scenario after my bullish one is sideways, so bearish for me is out for now.)
When the market starts moving, the best thing you can do is trust your prep, lean into your plan, and zoom out when things get noisy. The bigger picture hasn’t changed.

RKLB Weekly Options Trade Plan – 2025-06-07🚀 RKLB Weekly Options Trade Plan – 2025-06-07
Bias: Moderately Bullish
Holding Period: 3–5 trading days
Catalyst: Trump–Musk headline cycle + strong short-term momentum
Timeframe: Expiry June 13, 2025
🔍 Multi-Model Consensus Summary
Model Direction Strike Entry Stop Target(s) Confidence
Grok No Trade – – – – 0%
Claude Long Call $30 $0.76 $0.38 $1.50 75%
Llama Long Call $30 $0.76 $0.57 $1.14 70%
Gemini Long Call $31 $0.49 $0.24 $0.74–$0.98 65%
DeepSeek Long Call $30 $0.76 $0.38 $1.52 70%
✅ Consensus: Buy $30 call expiring 2025-06-13
💬 4 of 5 models bullish; 3 aligned on same strike and premium
⚠️ Max pain at $26 and overbought daily RSI are top risks
📈 Technical Snapshot
Price Trend: Bullish short-term (price > EMAs on 5-min & daily)
RSI: Nearing overbought (RSI ~69)
MACD: Bullish short-term, weakening daily
Resistance: $29.00–$29.50
Support: $28.70–$28.75
✅ Trade Setup
Parameter Value
Instrument RKLB
Direction CALL (LONG)
Strike $30
Entry Price $0.76
Profit Target $1.14 (≈50% gain)
Stop Loss $0.38 (≈50% loss)
Size 1 contract
Expiry 2025-06-13 (Weekly)
Confidence 70%
Entry Timing At market open
⚠️ Key Risks
Max Pain Gravity: $26 could act as price magnet by end of week
Overbought Setup: Daily RSI + Bollinger breach may cap further upside
Exhaustion Signs: Bearish MACD divergence could lead to snap pullback
Momentum Trade: Must act quickly; trail stops if resistance nears
A little more upside for SPX500USDHi traders,
And again my previous outlook of SPX500USD played out as I've said. After a small correction we saw the continuation of the upmove to the Daily FVG.
Next week we could see price come into the Daily FVG and reject from there for a correction down.
Let's see what the market does and react.
Trade idea: Wait for a small correction down on a lower timeframe to trade short term longs into the Daily FVG.
If you want to learn more about trading FVG's & liquidity sweeps with Wave analysis, then please make sure to follow me.
This shared post is only my point of view on what could be the next move in this pair based on my technical analysis.
Don't be emotional, just trade your plan!
Eduwave

**** Market Trading Strategy Idea SP500 ***Key Chart & Economic Insights:
- Current Market Position
- The S&P 500 is around $6000, showing positive momentum (+1.03%).
- Upward trend visible, indicating strong buying interest.
- Economic tailwinds support continued growth.
- Projected Price Movements
- 6800 USD: Key resistance level where selling pressure could emerge.
- Market pullback: A correction after 6800 may create a buyback opportunity.
- Recovery phase: Expected rebound toward 7000-7500 USD, another selling position.
- Economic Context: U.S. Manufacturing Boom & GDP Growth
- The United States is ramping up domestic production, boosting industrial output and reshoring manufacturing.
- This shift is fueling GDP growth, strengthening economic fundamentals and potentially sustaining bullish market momentum.
- Strong consumer spending & investment could drive stocks higher, aligning with the planned trade strategy.
Risk Management & Optimization:
- Entry & Exit Precision: Define stop-loss and take-profit levels.
- Momentum Confirmation: Ensure price action validates expected moves.
- Economic Indicators: Watch manufacturing & GDP data for trend validation.
If you want to refine this analysis or explore other scenarios, I'm here to dive deeper into key points! 🚀 Subscribe! TSXGanG
I hold a CCVM and MNC (Certificate of Competence to become a securities broker anywhere in Canada) and have been working as a trader for five years.
It’s a pleasure for me to help people optimize their trading strategies and make informed financial market decisions.

SPX: chasing the 6KThe jobs data were in the spotlight of markets during the previous week. The Non-farm payrolls in May with 139K new jobs came as better than market anticipated, which supported the optimistic mood of investors. The S&P 500 managed to return to the levels modestly above the 6K level. Tech companies were again in the spotlight of investors. In this sense, the magnificent 7 drove the market to the higher grounds. In the Friday trading session, NVDA gained 1,2%, AMZN was up by 2,7%, while Tesla gained 3,7%. It should be noted that Tesla had quite a turbulent week. Its shares first dropped by 14% at the beginning of the week, after its CEO commented negatively on a current policy of the US President Trump. Certainly, this came as a surprise for markets, considering Musk's strong support for President Trump, both during the electoral campaign and his presidency.
Current optimism might be slowed down with forthcoming inflation data. Namely, a large number of economists are pointing to potential for the economic slowdown and higher inflation induced by implemented trade tariffs by the US Administration. In this sense, there is a probability that higher volatility of the index might continue in the coming period, as markets will try to understand what impact future growth and earnings will have on any new news on trade tariffs. It has been announced that further talks between China and US officials on trade tariffs will be held next week in London. This event will be closely monitored by investors.

S&P 500 Daily Chart Analysis For Week of June 6, 2025Technical Analysis and Outlook:
The S&P 500 Index has demonstrated an upward trajectory during this week's trading session, surpassing the established Outer Index Rally level of 5955 and the Key Resistance level of 5965. Currently, the index is exhibiting a bullish trend, with a focus on the Outer Index Dip target, set at 6073. Furthermore, additional critical levels have been identified, including Key Resistance at 6150 and the Next Outer Index Rally at 6235. Conversely, there is a potential decline in index prices from the current level or upon completion of the Outer Index Dip 6073, which may lead to a retest of the Mean Support at 5940, with the possibility of extending the pullback to the Mean Support at 5888.

Possible bearish outlook After algorithm took out the previous liquidities, I would be expecting a downward move to see price taking out the bullish liquidity below, into the bullish gap, possibly filling it up

Another leg of bull market comingBeing bearish in the stock market—especially after such a big correction and a V-shaped recovery—is definitely not a good idea. Probability and past history are against you. If Trump succeeds in bringing more jobs by tarrifs and reduce government expending as he promises, it could easily keep the uptrend going for the next two years and push past the 10,000 level, just like 2018 and 2020

S&P500 tests the upper border of the rangeThe S&P 500 index is concentrating in the massive triangle below the psychological level of $6000, and given the overall neutral to good market sentiment, it’s not expected to plummet from this area before testing the area of $6000-6200. Should the breakout of this zone happen, it’s not expected to be sustainable and may quickly revert back to the range, as traders are quite cautious right now and the market is prone to liquidations and quick profit taking.
Don't forget - this is just the idea, always do your own research and never forget to manage your risk!

Hellena | SPX500 (4H): LONG resistance area of 6176.6.Colleagues, it appears that price has not yet completed the upward movement in a five-wave move.
At the moment I expect the continuation of wave “3” and reaching the target in the resistance area of 6176.6.
Manage your capital correctly and competently! Only enter trades based on reliable patterns!

SPX500 H1 | Heading into an overlap resistanceSPX500 is rising towards an overlap resistance and could potentially reverse off this level to drop lower.
Sell entry is at 5,967.36 which is an overlap resistance that aligns close to the 61.8% Fibonacci retracement.
Stop loss is at 6,012.00 which is a level that sits above a multi-swing-high resistance.
Take profit is at 5,909.96 which is a swing-low support that aligns close to the 61.8% Fibonacci retracement.
High Risk Investment Warning
Trading Forex/CFDs on margin carries a high level of risk and may not be suitable for all investors. Leverage can work against you.
Stratos Markets Limited (tradu.com ):
CFDs are complex instruments and come with a high risk of losing money rapidly due to leverage. 63% of retail investor accounts lose money when trading CFDs with this provider. You should consider whether you understand how CFDs work and whether you can afford to take the high risk of losing your money.
Stratos Europe Ltd (tradu.com ):
CFDs are complex instruments and come with a high risk of losing money rapidly due to leverage. 63% of retail investor accounts lose money when trading CFDs with this provider. You should consider whether you understand how CFDs work and whether you can afford to take the high risk of losing your money.
Stratos Global LLC (tradu.com ):
Losses can exceed deposits.
Please be advised that the information presented on TradingView is provided to Tradu (‘Company’, ‘we’) by a third-party provider (‘TFA Global Pte Ltd’). Please be reminded that you are solely responsible for the trading decisions on your account. There is a very high degree of risk involved in trading. Any information and/or content is intended entirely for research, educational and informational purposes only and does not constitute investment or consultation advice or investment strategy. The information is not tailored to the investment needs of any specific person and therefore does not involve a consideration of any of the investment objectives, financial situation or needs of any viewer that may receive it. Kindly also note that past performance is not a reliable indicator of future results. Actual results may differ materially from those anticipated in forward-looking or past performance statements. We assume no liability as to the accuracy or completeness of any of the information and/or content provided herein and the Company cannot be held responsible for any omission, mistake nor for any loss or damage including without limitation to any loss of profit which may arise from reliance on any information supplied by TFA Global Pte Ltd.
The speaker(s) is neither an employee, agent nor representative of Tradu and is therefore acting independently. The opinions given are their own, constitute general market commentary, and do not constitute the opinion or advice of Tradu or any form of personal or investment advice. Tradu neither endorses nor guarantees offerings of third-party speakers, nor is Tradu responsible for the content, veracity or opinions of third-party speakers, presenters or participants.

Market wrap - SPX USOIL BTC GoldThe market was very tricky but ultimately it did sell off. The question is - will we make one more high? That's hard to tell and there are mixed signals. Gold is at support. BTC is at it's Bollinger Band target, USOIL still has not broken up or down as of now.

06/02 Weekly GEX Analysis - 6000 Looks EasyThe biggest event last week was undoubtedly the court ruling involving Trump. The market responded with optimism, and on Thursday premarket, SPX surged toward the 6000 level — only to get instantly rejected. That strong rejection suggests this is a firm resistance zone.
From the GEX expiry matrix, it's clear that the market is hedging upward for this week, but downward for next week. To me, this indicates that while the near-term GEX sentiment remains slightly bullish, the market may be preparing for a pullback or retest in the medium term.
This week, SPX has already entered a GEX zone surrounded by positive strikes — up to around the 6000 level. That makes 6000 an “easy target” for bulls, and we’ll likely see profit-taking here, just like we did last Thursday premarket.
⚠️ However, if we look more closely at the weekly net open interest:
...we can see a strong bullish net OI build-up starting to emerge around the 6100 level — a price zone that currently feels distant and even unreachable. But if the 6000 resistance breaks, we could see a fast gamma-driven squeeze up to 6050 and possibly 6100 before the next wave of profit-taking kicks in.
As is often the case during bullish moves, the market seems blind to the bigger picture — no one’s looking down, only up. The mood is greedy, and momentum favors the bulls... for now.
Never underestimate FOMO — but also never underestimate Trump. He’s unlikely to accept the court’s decision on tariffs quietly. Any new negative headline could shake the market, no matter where price is sitting…

US & Global Market Breakdown | Profits, Losses & Bearish TradesIn this video, I break down the current state of the US and global economy, and why I believe we’re heading into a bearish phase.
📉 Fundamentals:
I cover the key macroeconomic factors influencing the markets — including Trump’s proposed new tariffs, slowing GDP growth, and ongoing supply chain constraints. These all point toward increasing pressure on the global economy.
📊 Technical Analysis:
I go over the major indexes and highlight their recent behavior. We’ve seen reactions from resistance levels, contraction patterns forming, and a significant volume dry-up — followed by today’s spike in volume, which occurred right at resistance. These are potential signs that the market may be shifting toward a bearish trend.
That said, we could still just be witnessing a deeper pullback within a longer-term uptrend. Markets are unpredictable, and no one knows for sure — which is why it’s important to always do your due diligence.
💰 I also review the profits and losses I’ve taken on recent bullish trades, and why I’ve now positioned myself in select short opportunities based on what I’m seeing.
If I’m sharing this, it’s because I’m personally investing my capital based on my conviction — so always use your own judgment and risk management when making decisions.
If you found value in the breakdown, leave a like, comment, and subscribe for more timely updates.

$SPX $SPY /ES! Bearish divergence at 6000SP:SPX AMEX:SPY Bearish divergence at 6000
When we dropped to the 35EMA, which happens when we see a red signal line, then we bounced but with a bearish divergence.

Come on SPX! Let's cross back over 6,000Stop playing with me SPX. So far this week, we've seen a slowwww drift up. Ok, Monday and Tuesday did put in some solid bars, but now here we are, babying this 6,000 psychological area.
Below is my write up from Sunday. While I always state different scenarios, I've been leaning bullish...though some of my individual stock plays have retested my stop levels this week. (They have been a bit more sideways)
SPX (written Sunday 06/01/25)
Still above key weekly MAs, trend remains intact
The weekly chart still shows an uptrend. We're above the 10EMA, 20EMA, and 50SMA, and those moving averages are turning up. So while the pace of the uptrend has slowed, the broader structure hasn't broken down. This past week was a digestion of the recent April and early May run, and so far, not an unraveling of it.
Friday's dip was likely just a shakeout.
Friday gave us a candle that flushed below the daily 20EMA then quickly reversed. That kind of action often traps early shorts and clears out weaker long hands…a classic shakeout. If this theory holds, we should see strength early next week. But if we break below the 5750-5725 area, that thesis gets invalidated. At that point, I'd treat the move as something more structurally weak, not just a pullback.
Confluence zone still holding for now
We're sitting right on a layered area of support above all moving averages, and a horizontal support and resistance level from earlier this year. So far, it has held. If it continues to hold, it gives the index a platform to try the upside again.
Trendlines matter, but not more than the overall structure
I was asked about trendlines this week, and it was a good reminder to step back and recognize how I was sharing my use of them. Trendlines are helpful, but they’re just one part of the picture. Same goes for moving averages, volume, and other tools. They only hold weight relative to the context. In a choppy, indecisive market, over-focusing on any single signal can do more harm than good. I'm aiming to keep my analysis well-rounded, zoomed out, and centered on structure.
What would confirm the upside?
A clean move back above 6,000 and a push through the February all-time high would help strengthen the case for continued upside. Not just because it’s a technical level, but because it’s psychological too. If we’re breaking out into new highs, especially after the chop and hesitation of the last few weeks, that’s when retail traders tend to feel like we’re “in the clear.” That can bring in more participation, more confidence, and more momentum. Ideally, we’d see a higher low hold on any dips, and then a strong push through 6,000 with follow-through, not just a quick tag and pullback. That kind of behavior would tell me buyers are stepping in with conviction again.
What would shift the bias more bearish?
A breakdown and hold below 5725 (not just a quick flush) would suggest deeper downside potential. From there, 5600 (around the daily 50SMA) becomes the next level I’d watch for support. But so far, I’m not leaning toward this as the main scenario.
What do you all see? Will we break 6,000 and get an increase in momentum?

Balance lost, 5850 is the likely next targetUnless they save the market within the next fw hours, balance has been lost on the small time frmes and 5850 is the bottom of the larger balance area. Gold could go either way from here. Oil is also at the top of balance. BTC still looks bearish
