SPX500 – Fibonacci Breakdown Hints Deeper Correction AheadThis 1H SPX500 setup highlights a potential bearish continuation pattern following a clear rejection from the 0.618–0.786 Fibonacci retracement zone. Here's a breakdown of the trade thesis:
🔍 Analysis Summary:
Fibonacci Cluster Rejection: Price failed to reclaim 5,921.31 (key resistance) and sharply rejected from the 0.618–0.786 retracement zone.
Bearish Market Structure: Lower highs formed near the .618 Fib, followed by a strong impulsive sell-off.
Liquidity Zone Below: The price is targeting the previous demand block near 5,796.99, a major structural liquidity zone.
Measured Targets (Fibonacci Extensions):
TP1: 1.236 @ 5,844.09
TP2: 1.618 @ 5,796.99
TP3: 2.0 @ 5,749.35
📌 Trade Setup:
Short Entry Zone: 5,915 – 5,921 (retest of resistance)
Stop Loss: Above swing high at 5,932
Take Profits:
TP1: 5,844 (partial close)
TP2: 5,796.99 (main target)
TP3: 5,749 (optional extension)
🧠 Macro Consideration:
With Fed rate uncertainty and bond market fragility, equities may be vulnerable to deeper retracement as institutions de-risk.
Volatility remains elevated heading into month-end—be flexible and risk-aware.
📊 Evidence Supporting the Hypothesis
Resistance at 0.618 Fibonacci Level:
The SPX has approached the 0.618 Fibonacci retracement level, a critical resistance point. A failure to break above this level could indicate a potential reversal or continuation of the downtrend.
Historical Significance of 0.618 Level:
Breaking below the 0.618 Fibonacci support level often signals a continuation of the downtrend, as it is a significant retracement level in technical analysis.
Stalling at Key Fibonacci Target:
The S&P 500's recent rally has stalled near a critical Fibonacci retracement level, raising questions about whether the market is entering a new uptrend or merely experiencing a bear-market bounce.
📉 Implications for Traders
Bearish Continuation: The inability of the SPX to surpass the 0.618–0.786 retracement zone suggests that the recent rally might be a temporary correction within a broader downtrend.
Potential Targets: If the bearish trend resumes, traders might look for support levels at the 1.236, 1.618, and 2.0 Fibonacci extension levels, aligning with the previously mentioned targets of 5,844.09, 5,796.99, and 5,749.35, respectively.
Risk Management: Given the current market volatility and the significance of these Fibonacci levels, traders should employ strict risk management strategies, including setting stop-loss orders above recent swing highs and monitoring for confirmation signals before entering positions.
In summary, the SPX's struggle to break through the 0.618–0.786 Fibonacci retracement levels, combined with historical patterns and recent technical analyses, supports the hypothesis of a potential bearish continuation. Traders should remain cautious and consider these technical indicators when making trading decisions.
📊 Wavervanir International LLC | Discretionary + Quant Hybrid Risk Management
SP500 trade ideas

SPX week & month review 5/30/25Intrigued by today as we closed the month and week. The charts appear bullish until something changes that. Key points I noticed...
*Monthly morning star pattern
*RSI above 50 on month and week chart
*MACD over zero line and signal up on month and week chart
*Key levels holding up (21 ema, FVGs)
We are still in volatile times and narratives are being thrown all over the place. Do you see what I see? Enjoy your weekend.

S&P500 finishing re-accumulation and sets eyes on 6230.The S&P500 / SPX has turned sideways after an impressive recovery from April's lows.
The 1day MA50 provides the same kind of support as it did after the October 2023 rebound.
The RSI pattern on both sequences is also similar and it suggests that the price is at the point where it breaks upwards to the Rising Resistance.
Target 6230.
Follow us, like the idea and leave a comment below!!

Bull trap into the close?Daily Bias is still up, but if we end the day near 5940, it may be a C wave with a further move down into next week. I also look at Gold, USOIL, and BTC

S&P 500 4 HR. WAVE C IS LIKELY OVER ON CORRECTION!1). Price is very likely heading towards the fair Market value @ 5870. 2). Risk Assets are weak today on US$ strength! 3). BANKS ARE SELLING! 4). Volume is dropping. 5). Trendline intersecting with target fib. level. 5). ONCE COMPLETED PRICE WILL PROGRESS NORTH ON WAVE 5 VERY LIKELY

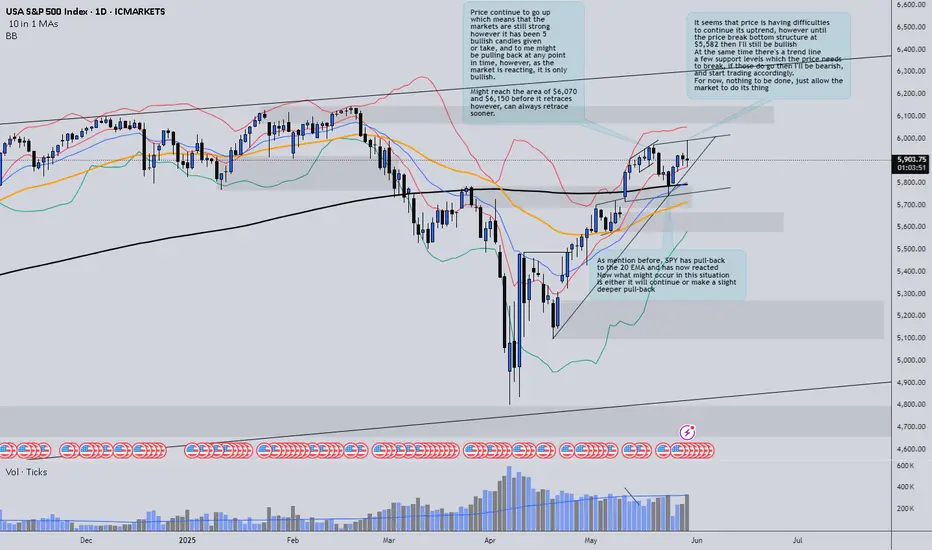
SPY update for todayHello everyone,
Not much new to update today, the main highlight is that the market has broken down from the trendline. This is definitely something to take note of. However, today’s move came with relatively low volume, which suggests that while price dropped significantly, there wasn’t a lot of strength behind the move.
This reminds us of a key principle in trading: the market can do whatever it wants. It may look bullish today and turn bearish tomorrow. So always react to what the market is showing you, not just what you expect it to do. Easier said than done, I know, but it's essential.
Looking ahead, this potential pullback could present better entry opportunities, assuming the market doesn’t flip into a full bearish meltdown. For now, we need to give the market some room to breathe, observe how it reacts at key levels, and stay patient for the right setup.
Remember: we're still in a broadly bullish environment. So let’s wait for strong reactions at the right price points before jumping in.

SPX500: Lwets go! This message will be deleted in 15 minutes. let's see what we get today. my convictions are high for short.

Choose Your Fighter SPX Here is the broadening formation we're in.
TVC:SPX is likely to consolidate further before making a decisive move.

Watching SPX500, buying puts right now!I think the market will reverse here. I don't know what the market is going to do, but I have high conviction in .886 reversal from this zone. Also, 0.618–1.618 confluence pending. Let's see what we get here.

SPX - June ProjectionsMay showed price heading back up to the high. This is four months now from the previous top. Generally for a major top to exhibit itself, it might take only three months to test. Four months is also not uncommon so it is possible that today's close will be last positive monthly close in a while.
I expect that the price will continue to rise, probably above the 6010 level of the last monthly closing high. If price surpasses the previous monthly close high, I will be watching for a turnaround, with prices eventually closing out June to the downside.
To me, based on the 40-month moving average. I have noticed that usually waves 2 and 4 have strong support at the 40 month moving average, where more major corrections will see price go below it. As price just came down to that level and didn't break it, we are in or have finished a wave 4. I'm still looking for lower prices assuming that this wave 4 to be a Flat with more sideways action ahead.
Currently short SP

$SPX // May 30 2025 // Analysis & Targets for Day TradersSP:SPX // May 30 2025 // Analysis & Targets for Day Traders

Structure Over Sentiment: Multi-Asset View into Month-End📊 Structure Over Sentiment: Multi-Asset View into Month-End | May 30, 2025
This isn’t a crash. This isn’t a rally. This is digestion.
The multi-asset view tells the real story — and it's not as chaotic as it looks.
🔍 What the Chart Shows:
This correlation lens plots key macro and market drivers YTD:
🟣 Gold (XAUUSD): Leading with +24.71% — this is the quiet macro bid no one’s talking about
🟢 Bitcoin (BTCUSD): Holding +8.47% — volatile, but still showing risk appetite
🔴 10Y Yield (US10Y): Up +5.31% — signalling rates peaking
🟠 Nasdaq (NDX): Nearly flat, -0.36% — NVDA strength masking internal rotation
🔵 S&P 500 (SPX): -2.32% — structurally fine, just not euphoric
🔵 Dow (DJA): -5.91% — lagging, cyclical drag
🔵 Russell 2000 (RTY): -13.60% — small caps under pressure, risk-on caution flag
🟣 Dollar Index (DXY): -6.44% — fading after a strong Q1
🟢 Oil (WTIUSD): -10.26% — no inflation panic here
🧠 Key Insight:
Despite the tariff headlines, sticky PCE, and conflicting narratives — the market remains internally consistent.
Gold is leading
Yields are rising but not sharply
Bitcoin is positive
Equities are flat-to-negative
Oil is weak
Dollar is fading
This is classic late-cycle digestion, not a crisis.
🛡️ Titan Mindset Check-In:
Don’t get lost in single headlines
Follow structure, not speculation
Let leaders lead (NVDA, Gold, BTC)
Protect equity when breath narrows
Zoom out, reduce noise, trade the curve — not the chaos
📍“Volatility isn’t risk. Misinterpretation is.”
Take Profits, Not Chances.
#MultiAssetView #StructureOverShock #TitanProtect #SPX #NDX #BTC #Gold #DXY #WTI #US10Y #MacroFlow #MarketMindset #LateCycleSignals #DigestDontPanic

S&P 500 MAJOR REVERSAL INCOMING? | SPX500 SELL ZONE HIT SPX500 just tapped into a critical supply zone near 5985 and has started pulling back. Is this the beginning of a deeper correction? Here’s what I’m watching 👇
---
📊 Key Technical Zones:
🔵 Supply Zone: 5985 – 6000 (Strong historical rejection zone)
⚠️ First Support: 5436.1 – potential bounce area, but already tested
🧱 Major Demand Zone: 4990 – heavy volume base, ideal buy zone for bulls
---
🚨 Bearish Clues on the Chart:
Price got rejected at the top of the supply range with a strong wick.
Bearish divergence on recent highs (not shown here but evident on RSI/MACD).
Clean downside structure could target 5436, then 4990 if broken.
📉 Downside Projections:
First TP: 5436
Final TP: 4990 (big institutional interest)
---
🔁 Possible Scenarios:
1. 🔻 Bearish Continuation: If we break below recent support near 5880, expect speed towards 5436.
2. 🟢 Bullish Fakeout: Only a strong breakout above 5985 invalidates this setup.
---
🎯 Trade Idea (Educational):
Entry: Break and retest below 5880
SL: Above 5985 zone
TP1: 5436
TP2: 4990
---
📅 June Will Be Volatile – Stay prepared.
💬 Do you think this is the start of a correction or just a dip before ATH?
🔔 Follow @FrankFx14 for clean and professional chart updates! 👍 Like, 🔁 share, and 💭 comment your thoughts below!

SPX, Final choppy leg upExpecting choppy ending diagonal wave 5 up to 6130-6200area. Followed by a larger wave 2 correction at the next higher degree/ set up for the a larger wave 3 wave to new ATH. ( Tax cuts/ rate cuts ).
How low will wave 2 go? ( somewhere in the green box most likely). Will we need to monitor its structure going down. Trump will not let market collapse to far If he can help it... And he can help it.

The Bias remains up on both Gold and the SP500 Both markets are above their 18mas so the bias remains up. SPX BB is 6054 and if I'm right we will get there.

Tracking a pattern that could signal the Top is In I am tracking a micro pattern with the new local high made in the ES last night and today's price action as a micro 5-down....we should get a slight retrace into the 5960 ish area. Maybe tomorrow...maybe in the overnight session tonight.
If price can then breach todays micro low of 5884 in the ES futures...we need to then follow through with a breach of 5857 to give us our first indication, we may have struck a top.
From there I am following 2 counts...Purple, or my primary count which is a minor C of Intermediate (A).
Best to all,
Chris

SPY update - still bullish!In today’s session, we saw an increase in volume without significant price movement. This could indicate underlying uncertainty or a potential shift in momentum.
At the moment, price is still respecting a key trend line and several support levels. Until these are broken, it's too early to confirm whether the broader market is turning bearish.
🧠 I also want to point out that the price is forming an ascending channel, often a reversal pattern, especially when occurring at market highs. While we’re seeing some bearish signs, it’s crucial to remain patient and let the market show its hand.
📊 As always, the key is to observe, not assume, and be ready to adapt as the price action develops.
Thanks for watching the update, I hope it brought some insight and value to your trading journey!
Bullish bounce off overlap support?S&P500 is falling towards the support level which is an overlap support that lines up with the 23.6% Fibonacci retracement and could bounce from this level to our take profit.
Entry: 5,784.04
Why we like it:
There is an overlap support level that aligns with the 23.6% Fibonacci retracement.
Stop loss: 5,689.40
Why we like it:
There is a pullback support level that is slightly above the 38.2% Fibonacci retracement.
Take profit: 5,973.58
Why we like it:
There is a pullback resistance level.
Enjoying your TradingView experience? Review us!
Please be advised that the information presented on TradingView is provided to Vantage (‘Vantage Global Limited’, ‘we’) by a third-party provider (‘Everest Fortune Group’). Please be reminded that you are solely responsible for the trading decisions on your account. There is a very high degree of risk involved in trading. Any information and/or content is intended entirely for research, educational and informational purposes only and does not constitute investment or consultation advice or investment strategy. The information is not tailored to the investment needs of any specific person and therefore does not involve a consideration of any of the investment objectives, financial situation or needs of any viewer that may receive it. Kindly also note that past performance is not a reliable indicator of future results. Actual results may differ materially from those anticipated in forward-looking or past performance statements. We assume no liability as to the accuracy or completeness of any of the information and/or content provided herein and the Company cannot be held responsible for any omission, mistake nor for any loss or damage including without limitation to any loss of profit which may arise from reliance on any information supplied by Everest Fortune Group.

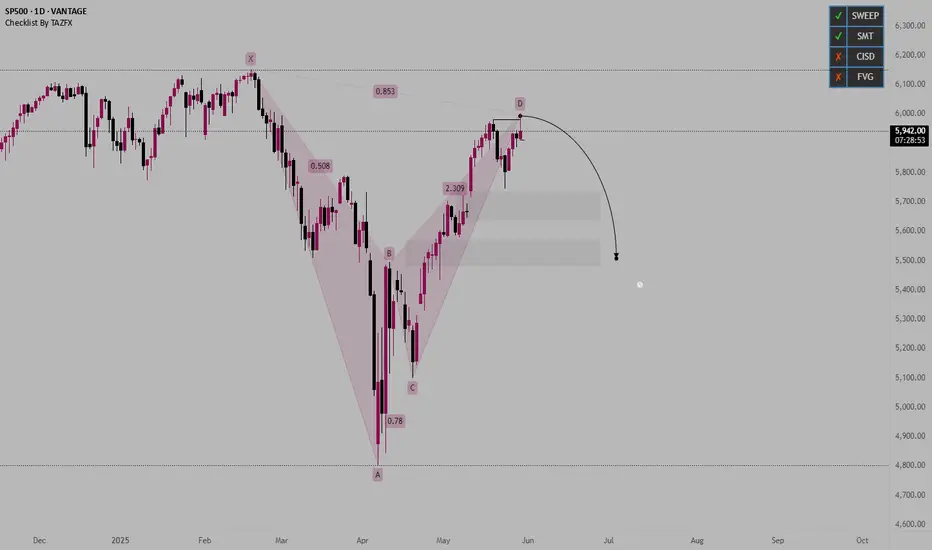
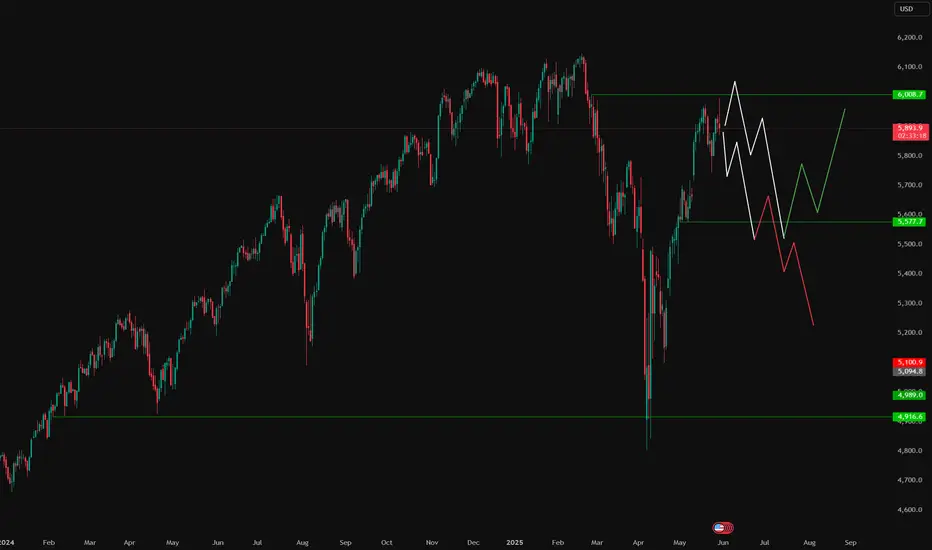
US500 Long TermBased on the technicals I'd be expecting US500 and other indices (US30, NAS100) to turn bearish again, at least for a short while. US500 has a key level of liquidity at 5577 which has to be swept before any major bulls return. Once that level is taken out, it depends on how the fundamental will develop and we can either expect the bears to continue the sell off or we may see the top 3 indices reach new ATHs.
S&P500: Inverse Head and Shoulders set to extend Apr-May rally.The S&P500 is bullish on its 1D technical outlook (RSI = 58.868, MACD = 85.480, ADX = 31.901) as it maintains a steady Channel Up pattern and just formed the first 1H Golden Cross in a month. Technically this is forming the Right Shoulder of an Inverse Head and Shoulders pattern, typically a bullish reversal formation, which not surprisingly was last seen in April when the Channel Up started and was completed with the previous 1H Golden Cross on April 24th. The result was a bullish extension fo rht 1.618 Fibonacci level. We're bullish on this, TP = 6,150.
## If you like our free content follow our profile to get more daily ideas. ##
## Comments and likes are greatly appreciated. ##

US500 US500 15min analysis
wait for the breakout of previous LH
bullish divergence formed
Targets mentioned

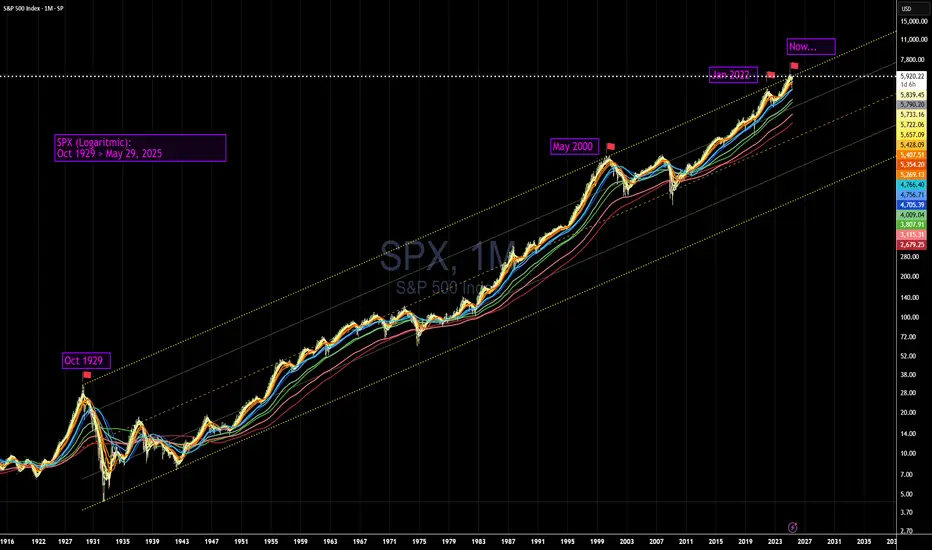
SPX top of near 100 yr channelAs we are in the vicinity og channel top, I have no idea wherte it will go next :)
US500 - BEARISH HARMONICFollowing are the marked targets as am expecting price to move to downside to atleast fill the gap area