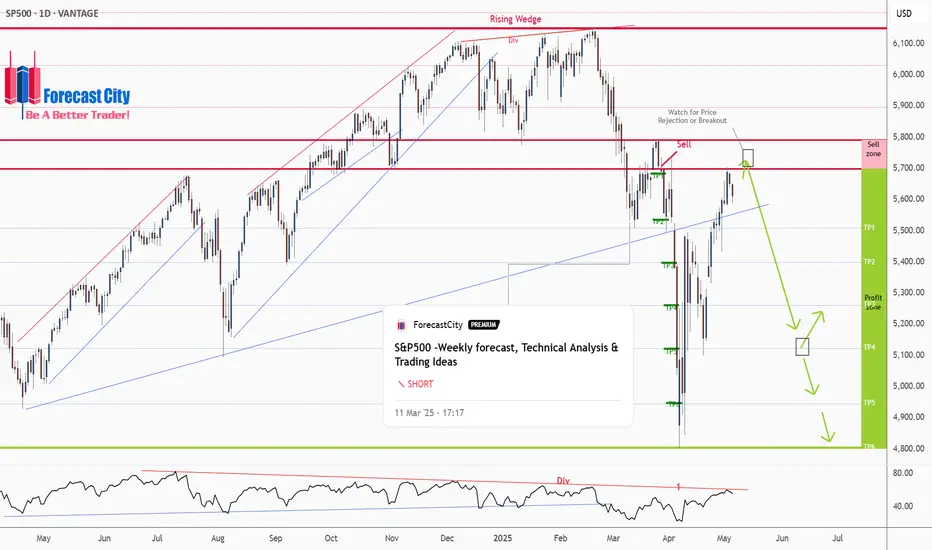
S&P500 -Weekly forecast, Technical Analysis & Trading IdeasPrevious forecast result:
As you can see in the 4CastMachine forecast on 12/03/2025, the price, after rejecting the sell zone, began its sharp decline and touched all TPs.
Midterm forecast:
While the price is below the resistance 6149.57, resumption of downtrend is expected.
We make sure when the support at 4804.01 breaks.
If the resistance at 6149.57 is broken, the short-term forecast -resumption of downtrend- will be invalid. CSEMA:S&P
Technical analysis:
While the RSI downtrend #1 is not broken, bearish wave in price would continue.
A trough is formed in daily chart at 4807.10 on 04/07/2025, so more gains to resistance(s) 5698.65, 5791.00, 5896.50 and maximum to Major Resistance (6149.57) is expected.
Price is above WEMA21, if price drops more, this line can act as dynamic support against more losses.
Relative strength index (RSI) is 55.
Take Profits:
5509.32
5363.90
5261.00
5122.47
4944.41
4804.01
__________________________________________________________________
❤️ If you find this helpful and want more FREE forecasts in TradingView,
. . . . . . . . Hit the 'BOOST' button 👍
. . . . . . . . . . . Drop some feedback in the comments below! (e.g., What did you find most useful? How can we improve?)
🙏 Your support is appreciated!
Now, it's your turn!
Be sure to leave a comment; let us know how you see this opportunity and forecast.
Have a successful week,
ForecastCity Support Team
SP500 trade ideas
US500: A correction will give a perfect opportunityHello,
The US500 has rebounded, maintaining its trendline as trade tension concerns subside. A promising trade setup is emerging, pending a minor correction on lower timeframes. The 2-hour and 4-hour charts indicate this correction is underway.
Long term target: $6,953
Consider entering a buy position near the moving averages, aligned with MACD signals.
Disclosure: I am part of Trade Nation's Influencer program and receive a monthly fee for using their TradingView charts in my analysis.

S&P500 buy setup
1>Monthly ERL>IRL (hunted) so now the target is ERL
2>clear MMBM
3>all bullish OBs are being respected
4>DOL seems quite achievable
(i ll be looking for 1h cisd and building positions on each BOS)
Disclaimer:
this is my personal approach to the market not an investment idea/advice, do your own analysis before jumping on the trade.

S&P500 Stuck between the 1D MA50 and 1D MA200.The S&P500 index (SPX) is now on a short-term correction following the impressive recovery of the last 30 days that made it almost test its 1D MA200 (orange trend-line). This is a technical rejection but the fact that the 1D MA50 (blue trend-line) is now the Support can be encouraging.
The reason is that since January 2023, every time the index broke above its 1D MA50 it turned into a Support that held and produced an immediate bullish extension on every occasion except for one time (Sep 2024), which still recovered 1 week after.
As a result, it is more likely for SPX to test its All Time High (ATH) by July than entering a long-term correction again.
-------------------------------------------------------------------------------
** Please LIKE 👍, FOLLOW ✅, SHARE 🙌 and COMMENT ✍ if you enjoy this idea! Also share your ideas and charts in the comments section below! This is best way to keep it relevant, support us, keep the content here free and allow the idea to reach as many people as possible. **
-------------------------------------------------------------------------------
Disclosure: I am part of Trade Nation's Influencer program and receive a monthly fee for using their TradingView charts in my analysis.
💸💸💸💸💸💸
👇 👇 👇 👇 👇 👇

Pre Market Video - the 2 channelsWe are close to the bottom of the uptrend channel. If they can't hold 5580 we will likely start a move down to 5400, the bottom of the blue channel. I expect a fight and attemt to hold 5600 today after open, but personally I think it will fail. There is a possibility of one more move up to the Bollinger Band (at least), so keep that in mind.

May 6, 2025 - Markets Hold Their Breath Before Powell SpeaksHello everyone, it’s May 6, 2025 and markets are once again at the mercy of politics, Powell, and presidential mood swings.
After a 9-day rally, U.S. markets finally took a breather yesterday, with mild profit-taking ahead of the much-anticipated Federal Reserve decision. Investors are caught between two competing visions: Trump’s push for massive rate cuts, insisting inflation is a myth cooked up by bureaucrats, and Powell’s more sober stance acknowledging inflation isn’t dead, the economy is softening, and premature easing could trigger full-blown stagflation.
With Friday’s job report stronger than expected, Powell is expected to hold rates steady, staying cautious while tariffs and growth clouds loom. Markets are pricing in a July cut at best, but uncertainty lingers mostly around what Trump might tweet in reaction to Powell’s speech tomorrow night.
Meanwhile, despite the 90-day tariff moratorium, the trade war narrative hasn’t vanished. NYSE:F suspended its 2025 outlook, citing $1.5 billion in expected tariff costs and four major risks: disrupted supply chains, retaliatory measures, unclear tax policies, and emission rules. NASDAQ:MAT is also hedging its bets shifting production out of China and pausing forecasts, while begging for zero tariffs on toys “for the kids.” Their stocks dropped modestly after hours.
OANDA:XAUUSD surged again to $3,368, as fear and safe-haven demand ticked up. BLACKBULL:WTI rebounded to over $58 following an OPEC statement, helping airline stocks breathe a bit. BINANCE:BTCUSDT continued its meteoric rise, now sitting around $94,400.
On the macro front, inflation data like CPI and PPI are being shrugged off everyone’s waiting to see if Powell plays ball with Trump. There’s hope, too, that all this chaos is just Trump’s way of muscling the world into negotiation especially China and if a “deal” emerges, markets could rip higher. Until then, we’re stuck dancing between uncertainty and hope.
Asia opened strong this morning, led by China’s cautious optimism. Futures point slightly lower in the U.S., and volatility remains king. The Fed could flip the script tomorrow or keep us hanging. Stay buckled in.

S&P500 INTRADAY resistance at 5510US stock futures are signaling a second straight day of losses. Palantir shares dropped 9% pre-market after its earnings disappointed high expectations. Ford also fell, withdrawing its financial guidance and warning that new tariffs would hurt profitability.
In Europe, political uncertainty hit German markets as Friedrich Merz failed to secure a majority vote to become Germany’s next chancellor, delaying his swearing-in and shaking investor confidence. The DAX index slid 1.4% on the news.
Meanwhile, EU-US trade tensions are intensifying. The European Union expects new US trade probes could expose up to €549 billion ($622 billion) worth of EU exports to American tariffs, adding pressure to already strained transatlantic negotiations.
Key Support and Resistance Levels
Resistance Level 1: 5693
Resistance Level 2: 5780
Resistance Level 3: 5876
Support Level 1: 5512
Support Level 2: 5438
Support Level 3: 5390
This communication is for informational purposes only and should not be viewed as any form of recommendation as to a particular course of action or as investment advice. It is not intended as an offer or solicitation for the purchase or sale of any financial instrument or as an official confirmation of any transaction. Opinions, estimates and assumptions expressed herein are made as of the date of this communication and are subject to change without notice. This communication has been prepared based upon information, including market prices, data and other information, believed to be reliable; however, Trade Nation does not warrant its completeness or accuracy. All market prices and market data contained in or attached to this communication are indicative and subject to change without notice.

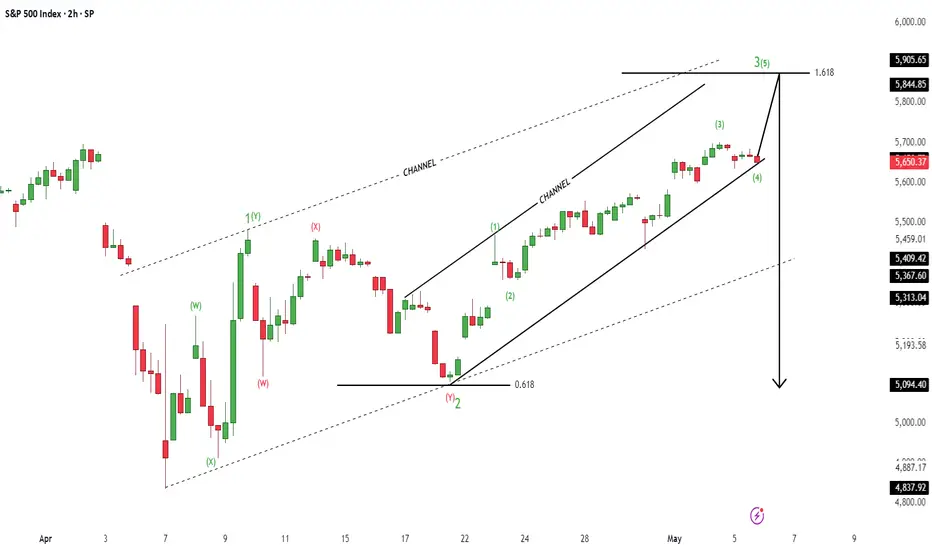
SPX 500SPX500 Index
- Completed " 1234 " Impulsive Waves
- Break of Structure
- Fibonacci Level - 161.8%
- Bullish Channel in Short and Long Time Frame
- CHOCH
SPX is cooking a strong buyBuyers are strongly in control and now the price is giving a nice discount. Good for sweet risk to reward. Invest wisely...

S&P500 Short Update: Break of TrendlineThis is an update to my short idea 2 days ago. I believed that the reversal for S&P500 has already begun and that I expect a move down from the breaking of the lower trendline.
Apologies for the audio as I am testing out a new setup (with a new portable microphone).

"US500/SPX500" Index Market Money Heist Plan (Day / Swing Trade)🌟Hi! Hola! Ola! Bonjour! Hallo! Marhaba!🌟
Dear Money Makers & Robbers, 🤑💰✈️
Based on 🔥Thief Trading style technical and fundamental analysis🔥, here is our master plan to heist the "US500/SPX500" Index Market. Please adhere to the strategy I've outlined in the chart, which emphasizes short entry. Our aim is the high-risk Pink MA Zone. Risky level, oversold market, consolidation, trend reversal, trap at the level where traders and bullish robbers are stronger. 🏆💸"Take profit and treat yourself, traders. You deserve it!💪🏆🎉
Entry 📈 : "The vault is wide open! Swipe the Bearish loot at any price - the heist is on!
however I advise to Place sell limit orders within a 15 or 30 minute timeframe most nearest or swing, low or high level for Pullback Entries.
Stop Loss 🛑:
📌Thief SL placed at the nearest/swing High or Low level Using the 1D timeframe (5500) Day/Swing trade basis.
📌SL is based on your risk of the trade, lot size and how many multiple orders you have to take.
Target 🎯: 4750 (or) Escape Before the Target
💰💵💸"US500/SPX500" Index Market Heist Plan (Swing/Day Trade) is currently experiencing a Bearish trend.., driven by several key factors.👇👇👇
📰🗞️Get & Read the Fundamental, Macro, COT Report, Geopolitical and News Analysis, Sentimental Outlook, Intermarket Analysis, Index-Specific Analysis, Future trend targets with Overall outlook score... go ahead to check 👉👉👉🔗🔗
⚠️Trading Alert : News Releases and Position Management 📰 🗞️ 🚫🚏
As a reminder, news releases can have a significant impact on market prices and volatility. To minimize potential losses and protect your running positions,
we recommend the following:
Avoid taking new trades during news releases
Use trailing stop-loss orders to protect your running positions and lock in profits
💖Supporting our robbery plan 💥Hit the Boost Button💥 will enable us to effortlessly make and steal money 💰💵. Boost the strength of our robbery team. Every day in this market make money with ease by using the Thief Trading Style.🏆💪🤝❤️🎉🚀
I'll see you soon with another heist plan, so stay tuned 🤑🐱👤🤗🤩

SPX500 D1 I Bullish Bounce Based on the D1 chart analysis, the price is falling our buy entry level at 5492.54, a pullback support.
Our take profit is set at 5797.53, an overlap resistance.
The stop loss is placed at 5386, a pullback support.
High Risk Investment Warning
Trading Forex/CFDs on margin carries a high level of risk and may not be suitable for all investors. Leverage can work against you.
Stratos Markets Limited (tradu.com):
CFDs are complex instruments and come with a high risk of losing money rapidly due to leverage. 63% of retail investor accounts lose money when trading CFDs with this provider. You should consider whether you understand how CFDs work and whether you can afford to take the high risk of losing your money.
Stratos Europe Ltd (tradu.com):
CFDs are complex instruments and come with a high risk of losing money rapidly due to leverage. 63% of retail investor accounts lose money when trading CFDs with this provider. You should consider whether you understand how CFDs work and whether you can afford to take the high risk of losing your money.
Stratos Global LLC (tradu.com):
Losses can exceed deposits.
Please be advised that the information presented on TradingView is provided to Tradu (‘Company’, ‘we’) by a third-party provider (‘TFA Global Pte Ltd’). Please be reminded that you are solely responsible for the trading decisions on your account. There is a very high degree of risk involved in trading. Any information and/or content is intended entirely for research, educational and informational purposes only and does not constitute investment or consultation advice or investment strategy. The information is not tailored to the investment needs of any specific person and therefore does not involve a consideration of any of the investment objectives, financial situation or needs of any viewer that may receive it. Kindly also note that past performance is not a reliable indicator of future results. Actual results may differ materially from those anticipated in forward-looking or past performance statements. We assume no liability as to the accuracy or completeness of any of the information and/or content provided herein and the Company cannot be held responsible for any omission, mistake nor for any loss or damage including without limitation to any loss of profit which may arise from reliance on any information supplied by TFA Global Pte Ltd.
The speaker(s) is neither an employee, agent nor representative of Tradu and is therefore acting independently. The opinions given are their own, constitute general market commentary, and do not constitute the opinion or advice of Tradu or any form of personal or investment advice. Tradu neither endorses nor guarantees offerings of third-party speakers, nor is Tradu responsible for the content, veracity or opinions of third-party speakers, presenters or participants.

SHORT ON SPYNice Double Top at a Major supply zone on spy.
I will be selling spy to the next demand zone for almost 900 points. (INSANE)

SPX 1st rejection1st rejection of last week's close. I say mark the zone and be cautious. Key levels will be targets (daily hi & lo minimum). If your hit targets, take profit. when aiming above, take the trade from a support level or specific candle shift.
Again... FOMC Wed 5/7. Will update my thoughts daily this week.

S&P 500 2025 and 1998Interesting and striking similarities. I think this week either confirms this or invalidates the idea.

Little Rest For SPXI think the SPX structure is more prone to bearishness. There is a structure that will probably move quickly in one direction. I don't think a good structure has been formed for a bottom. And the rise does not seem very strong. For this reason, I expect an increase after the first fall.
Since this situation will probably reflect on crypto, my bearish contracts are still in place. But I am thinking of buying a bullish contract until the FOMC time.

$SPX / $SP500 – China Deal or Global Meltdown? The Risk/Reward 📉 The S&P 500 ( SP:SPX / VANTAGE:SP500 / $ES_F) is at a geopolitical crossroads.
After the Global Pause, the index rebounded, but only to retest resistance near the 200-day EMA. Now it faces a binary outcome:
Scenario A: ✅ Deal with China
Estimated probability: 20%
Potential upside: +10%
Expected value: +2%
Scenario B: ❌ No Deal with China
Estimated probability: 80%
Potential downside: -50%
Expected value: -40%
📉 Expected move: -38% net Markets are not priced for this. Volatility ( TVC:VIX ) is quietly coiling under the surface (chart 2), ready to explode if the no-deal scenario materializes.

SPX Running Into Important Resistance At 5780Last week we saw a weaker-than-expected Advance GDP in the first release, which led some to believe Powell might consider cutting rates. But Friday’s NFP came in better than expected. Expectations are no change for the Fed, and I honestly don’t believe they’ll move either.
Despite Trump putting pressure on them, inflation is still not at their 2% target, and the job market remains solid—so there may be no real reason to cut yet.
They’re watching markets too, and we've seen a pretty strong rebound, so there’s likely no urgency to act now.
Also, if they were to cut, it could appear politically motivated due to Trump, and that could seriously damage investor trust in the Fed’s independence.
So with that being said, we are wondering if the SPX can find some resistance if FED does not deliver a dovish view at this moment. Well, looking at the price action, it certainly looks overlaping recovery from April low, that can face limited upside near 5780, at April 2nd high.
If by Friday, we close above the 78.6% Fib then we may look at wave 3, alt sceario.
Grega

ETHEREUM LONGPECTRA UPGRADE may 07
Please be informed that the PECTRA system will undergo a scheduled upgrade on Tuesday, May 7.

Important structure reached FridayThe trendline structure from the top was reached FRiday and I believe we may rally back to it at open but fail. There are a LOT of traders calling for a test of the 200 ma again, but I'm not sure it will actually occur. Vix also did not fill it's gap on Friday which could be interpreted as bullish for the VIX

S&P 500 Tests Key Zone Ahead of FOMCThe S&P 500 has reached the 5,700–5,800 zone after a nearly 18% rally in just half a month. This zone could determine whether the rally marks the end of the bearish trend or if more pain lies ahead for the stock market.
The 200-day simple moving average, several previous horizontal support levels, and the most recent top all converge in this area. The upward move has been driven by correction dynamics, optimism around potential trade deals, signs of de-escalation with China, and rising expectations for Fed rate cuts in 2025.
This week, the FOMC may either temper those optimistic rate cut expectations or hint at a more dovish tone. In either case, some profit-taking may occur ahead of the meeting, and the 5,700–5,800 zone is a strong candidate for that to happen.

US Stocks Pare Back All Tariff-Fueled Losses. Are We So Back?Remember “Liberation Day”? The one that felt more like Liquidation Day ? When markets tanked, tickers turned red, and you were afraid to check the markets on the next day? Well, turns out the rumors of the market’s demise were — once again — greatly exaggerated.
If the average recession 10 years ago lasted two years, this year’s recession was approximately 37 minutes (more or less, depending on the day).
Just a month ago, the S&P 500 SP:SPX started crumbling to the point it entered into correction territory (and then got out of correction territory ).
Long story short, it took the punches, went down 15%, stood back up, and is now throwing jabs with a nine-day winning streak — its longest since 2004, when iPods were still a thing and Facebook was just for Harvard students.
So… are we back? Like, really back? Let’s dig in.
💰 Trillions Lost, Trillions Found
On April 2, President Donald Trump dropped the hammer — or rather, the online post — unveiling his “reciprocal tariffs,” which, in true Trumpian fashion, sounded equal parts policy and promo PR.
Markets didn’t take it well. Global stocks collectively threw a tantrum. The S&P 500 dropped like it had a brick in its pocket . Financials cratered, energy took a gut punch, and tech? See for yourself — we don't want to talk about it .
But now? The dip buyers are shopping up, scooping up, snapping up everything from banks to oil stocks to beleaguered megacaps. Suddenly, all those stock discounts look like missed opportunities, and the cash-on-the-sidelines traders are jumping in.
👌 Jobs Data: Not Too Hot, Not Too Cold
Friday was a good day. Why? Because April’s nonfarm payrolls ECONOMICS:USNFP report came in at 177,000 jobs — not too strong to trigger Fed-tightening fears, not too weak to imply economic decay. It was the goldilocks print.
The number was a drop from March’s revised 185,000, but what mattered was the beat: economists had pencilled in just 135,000. Markets took that as permission to throw a party.
The S&P 500 jumped 1.5%, reclaiming the level it had before Trump’s tariff tirade and putting an emphatic end to the selloff. Nine green days in a row? That’s a bull flex Wall Street hasn’t seen in two decades.
💥 Truth Social Posts That Move Markets
Not to be left out of the celebration, Trump hopped onto Truth Social with his usual caps lock enthusiasm:
“THE FED SHOULD LOWER ITS RATE!!!”
Sounds familiar?
Still, even without a rate cut (for now), the market got what it wanted: signs that the US labor market isn’t collapsing, trade talks might be back on the table, and the economy hasn’t lost its way.
😌 A Global Sigh of Relief
While the US led the rally, global markets also joined the rebound chorus. China’s commerce ministry chimed in Friday, saying Washington had expressed a “desire to engage in discussions.” In market-speak, that translates to: "Everyone calm down — we might not blow this up after all."
It doesn’t take much to change sentiment. A tweet here, a headline there, a hint of diplomatic progress — suddenly risk appetite returns and everyone forgets they were panic-selling just three weeks ago.
But don’t go lining up the espresso martinis just yet — not everything is fully recovered. The US dollar, for example, remains nearly 4% below its pre-tariff-announcement level.
🤔 We Are So… Back?
So are we officially back? Short answer — “put the word out there that we back up” for now . Markets are up, volatility is down, and everyone’s pretending they didn’t sell the dip at the worst possible time.
But — and you knew there’d be a “but” — caution still applies. Trade tensions aren’t over. The next Trump post could shake things again. The Fed hasn’t made its next move (that’s coming this Wednesday). And geopolitics remains a powder keg.
Still, what this rebound tells us is clear: the market has resilience. Maybe not logic. Maybe not grace. But resilience? Yes.
It also reminds us that trying to time news-driven selloffs is a dangerous game. Often, the best trades happen when fear peaks and everyone else is running for the hills.
👉 Final Thoughts: Watch the Calendar, Not the Chaos
The key takeaway from this tariff-to-rally rollercoaster? Markets can move fast — but they can also recover faster. If you panicked, you probably sold low. If you stayed focused, checked the earnings calendar , and remembered that market narratives shift like wind direction, you're probably doing well right now.
We’re so back — for now. But stay sharp. This market may have nine lives, but it also has the attention span of a toddler.
Your move : Did you ride the dip? Buy the bounce? Or just mute the chaos and sip your coffee? Drop your best “Liberation Day to Redemption Rally” trade below.

SPX: trade should not be a weaponPositive sentiment continued on the US equity markets during the previous week, after stronger than expected US jobs data. The Non-farm payrolls posted on Friday reached 177K in April, which was significantly above the 130K expected by the market. The market estimate was significantly lower from March data, as analysts were expecting to see a spill over effect of the imposed trade tariffs. As the jobs market seems still quite strong, the positive market sentiment was intact during the week. However, the recession fears are still holding among investors. The S&P 500 continued its 9-days winning streak, ending the week at the level of 5.686.
On a positive side was the news that Chinese authorities are considering starting negotiations with the US Administration regarding trade tariffs. This was another positive boost for investors' sentiment. Berkshire Hathaway was holding shareholders annual meeting on Saturday, where the most attention of both media and investors was on the speech of its founder and famous investor, Warren Buffet. In his address to the shareholders, Buffet strongly criticized the trade tariffs, noting “Trade tariffs are an act of war … trade should not be a weapon’.
For the moment, it could be expected that the positive sentiment might continue also in the future period. However, the FOMC meeting and Fed rate decision is scheduled for Wednesday, May 7th. This could be a day of higher volatility, as Fed Chair Powell will address the public at the press conference after the meeting. The markets will closely watch what he has to say regarding the current state of the US economy and potential rate cuts during the course of this year.
