S&P500 INTRADAY support retest The Israel-Iran conflict has now entered its fourth day, with no signs of de-escalation. Iran launched more missile attacks, while Israel struck back, targeting a major gas field and a key military figure. Notably, Israeli strikes damaged Iran’s uranium facility in Isfahan, and an Iranian missile caused minor damage near the U.S. consulate in Tel Aviv.
While these developments added geopolitical stress, markets showed some resilience:
Oil prices pulled back after initial gains but remain volatile as the risk of supply disruption in the Middle East — a region supplying ~1/3 of global crude — persists.
S&P 500 futures edged higher, indicating investors are not fully in risk-off mode, but remain cautious.
On the political front, Donald Trump reportedly blocked an Israeli plan to assassinate Iran’s Supreme Leader. He mentioned the possibility of a future agreement between the two sides but said more conflict may come first. Trump is attending the G7 summit in Canada today, where leaders will discuss how to manage the Middle East crisis and navigate diplomacy with Trump.
For S&P 500 traders:
Monitor oil prices — a sharp spike on new escalation could weigh on risk sentiment.
Headlines from the G7 and any sign of U.S. involvement or de-escalation efforts could shift markets.
Geopolitical risk remains elevated, but the market is currently pricing in a contained conflict.
Key Support and Resistance Levels
Resistance Level 1: 6,058
Resistance Level 2: 6,138
Resistance Level 3: 6,200
Support Level 1: 5,953
Support Level 2: 5,913
Support Level 3: 5,845
This communication is for informational purposes only and should not be viewed as any form of recommendation as to a particular course of action or as investment advice. It is not intended as an offer or solicitation for the purchase or sale of any financial instrument or as an official confirmation of any transaction. Opinions, estimates and assumptions expressed herein are made as of the date of this communication and are subject to change without notice. This communication has been prepared based upon information, including market prices, data and other information, believed to be reliable; however, Trade Nation does not warrant its completeness or accuracy. All market prices and market data contained in or attached to this communication are indicative and subject to change without notice.
SP500 trade ideas

SPX500 – Cautious Optimism as Market Eyes Fed DecisionSPX500 – Cautious Optimism as Market Eyes Fed Decision
Futures tied to the S&P 500 are slightly higher as traders appear to be shrugging off Middle East tensions, viewing the situation as contained for now. However, geopolitical uncertainty remains a risk, and attention is shifting toward upcoming Fed commentary and policy direction.
Technical Outlook:
The index may pull back toward 5989 and 5966. A break below 5966 opens the path toward 5938, with an extended target at 5902.
However, a 1H close above 6010 would signal renewed bullish momentum toward 6041.
Key Levels:
• Resistance: 6041, 6098, 6143
• Support: 5966, 5938, 5902

Opportunities abound if you are open mindedRead latest article here
I have covered my regrets for missing this stock here and here
From this article , you can see that resellers are investing/buying up these limited edition plush toys and selling online at a profits. See, you need not be dabbling in the stock market to make money. These resellers neither manufacture nor market these toys but were sharp and fast enough to catch the trend.
Risks - if they bought too many and the trend dies down or the profits start to come down, they stand to lose as well since they need to first cough out capital to purchase these toys.
I am of the opinion that the stock market is created equally for both the rich and poor to have a stake in the game. That is why if you are an employee earning a fixed salary, learning to trade/invest is no longer a luxury unless you have a huge inheritance, strike lottery or simply not interested in making money.
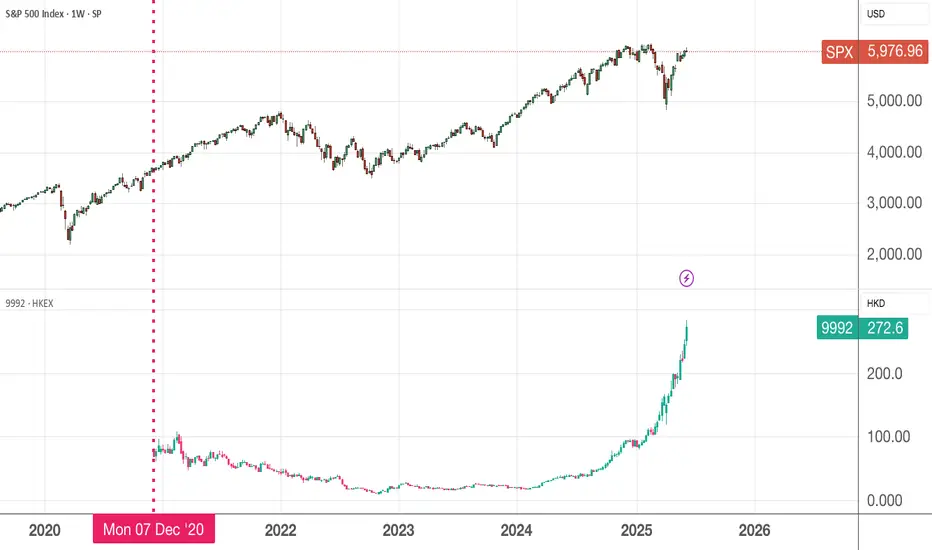
Since Dec 2020, Pop Mart has gained 286% returns for the shareholders who ride through the lows of less than 10 dollars in its darkest moments during 2023/2024. In comparison, the same amount of money invested in the SPX will gives you less than 70% returns. Pop Mart gains is 4x more than passive investing in SPX.
Congrats to those who had longed it and are laughing to the bank. For those like me who missed it, no point crying over spilled milk. There are abundant opportunities, just keep an open mind, if the fundamentals are ok, nibble a bit and see how it goes. All you need is 1-2 multibagger in your portfolio
S&P 500 Index.4H CHART PATTERN.the S&P 500 Index (4H timeframe), it appears you're using a combination of Ichimoku Cloud, trend channels, and support/resistance zones to project downside targets. Here's the breakdown of your marked targets:
📉 Bearish Targets:
1. Target 1: Around 5,500
2. Target 2: Around 5,200
3. Target 3: Around 4,950–4,900
---
🔍 Technical Observations:
Price has broken below the upward trend channel.
It's entering the Ichimoku Cloud, signaling potential consolidation or bearish pressure.
The large blue downward arrow indicates a bearish expectation, possibly tied to macro/fundamental concerns or technical reversal patterns.
The grey resistance block near 5,960–6,000 suggests failed breakout/retest.
---
📌 Summary:
If current bearish momentum continues:
✅ Immediate Target: 5,500 (first major support)
⚠ Medium Target: 5,200
🔻 Final Target Zone: 4,900–4,950 (strong previous support and fib zone)
Let me know if you want stop-loss ideas, confluence indicators, or entry strategy breakdowns!

SPX500 VEP Trader Strategy | Trend + Liquidity + Precise We’ve confirmed a strong bullish trend in SPX500 supported by solid momentum on the daily timeframe using the Squeeze Momentum indicator. The market shows potential to continue upward but may first revisit key liquidity zones.
🔍 Identified Liquidity Zones
We’ve marked high-liquidity zones on the following daily candles:
📅 Thursday, June 5
📅 Thursday, June 12
📅 Tuesday, June 3
These are areas where the market may pull back to sweep open orders before resuming the bullish trend.
🎯 Key Area: Fair Value Gap (15min)
We are expecting price to reach a 15-minute FVG identified on Monday, June 2 at 10:15 AM.
✅ Target level: $5,892
If the price taps into this zone, we’ll be watching for a bullish reaction.
🛠️ Entry Confirmation (5min or 2min)
Once the reaction occurs:
Look for a new FVG on 5M or 2M.
Confirm that Squeeze Momentum continues to show bullish strength.
If aligned, we enter CALLs with high confidence.
📉 Risk Management
Stop Loss: $5,860
Take Profit 1: Nearest recent High
Take Profit 2 and beyond: Continue marking each new High as a profit-taking step
📌 Final Thoughts
This is a clean setup combining liquidity analysis, FVG structure, and VEP Trader confirmation for high-probability trading.
It’s a plan that respects patience, structure, and precision.
📸 (See attached chart for full visualization of structure, levels, and gaps)
#SPX500 #VEPTrader #SmartMoneyConcepts #PriceAction #LiquiditySweep #FVGTrading #DayTrading #TradingViewIdeas #PBInvesting

Bearish outlook on us500Looking at how price took out liquidity inside the previous eardhbob l I would be watching for bearishness to the downside

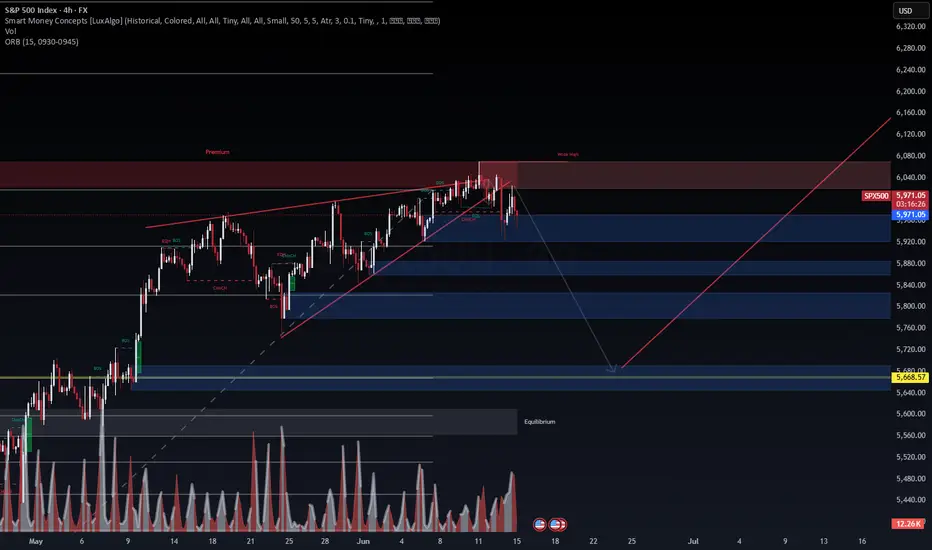
SPX500 | SMC Breakdown in Progress – Watch the Liquidity SweepThe rising wedge broke structure near the weak high in premium territory. We are now seeing bearish CHoCHs and BOS with volume confirmation, suggesting a move down toward the next key demand zone between 5840–5720.
📊 Volume Analysis
Spikes in sell volume during BOS align with structural shifts, confirming the loss of bullish intent.
📌 Key Zones
Premium Zone: 6000–6080 was swept and rejected
Target Zones: 5840, 5760, and final liquidation zone near 5668
Equilibrium sits below 5700, matching confluence with prior FVG and OB
🔀 Scenarios
Price could react mid-range and retrace to test the weak high again.
A full sweep of the lower liquidity zone near 5668 could create a bullish springboard for a longer-term continuation.
🎯 Bias: Bearish unless price reclaims 6020 on strong volume.
Watch for how price behaves near the mid-blue zone — patience will provide the cleanest entry.
— WaverVanir International LLC
SPX500 BUYGreeting there traders this is my analysis on
📊 S&P 500 – Potential Elliott Wave 3 Formation | Long Setup
The current 4H chart of the S&P 500 suggests a potential bullish continuation based on Elliott Wave Theory. Here's the structured breakdown:
🔹 Wave 1: Initiated after a failed breakout and sharp reversal from a previous resistance zone. This impulsive move marked a key shift in trend structure.
🔹 Wave 2: A corrective phase followed, consolidating near the support area (~5,915), respecting previous demand.
🔹 Current Price Action: Price has broken above the minor resistance at 6,000, indicating the potential beginning of Wave 3, which is typically the strongest and most extended wave in the sequence.
📈 Trade Setup:
Entry: Above 6,000 (confirmation of breakout and wave continuation)
Stop Loss: Below 5,915 (invalidates bullish structure if broken)
Target Zone: 6,167 – 6,170 (aligned with prior resistance and wave projection)
🔍 Additional Notes:
The breakout is supported by a clean structure and rejection from key support.
Ideal scenario would involve increasing volume and continuation with higher highs and higher lows.
📌 Bias: Bullish – targeting Wave 3 extension.
⚠️ Always manage risk accordingly and watch for signs of exhaustion or divergence.
Dear Traders like,comment let me know what do you think?

Rising wedge + Bearish divergence + GAP at 5700 + new war !!!Rising wedge + bearish divergence + GAP down at 5700.
And yes, a new war in the Middle East. Higher oil prices are coming — Iran controls the Hormuz Strait, where 20–30% of the world’s oil is transported. Yes, Iran is on the sanctions list, but other countries aren’t — they trade with Iran and resell the oil to the rest of the world. Triangle trade.
But that supply of 20–30% is about to disappear due to the war. Higher oil prices mean higher expenses. A lot of the world still relies on oil as an energy source.
We’re also out of the previous trend we had before the tariffs.
DYOR (Do Your Own Research).

S&P500 awaits new drivers for growthThe S&P 500 index has been moving in a perfectly sideways direction without any clear directional bias. This week had increased volatility a little bit, but not too much: the price was consolidating in a narrowing triangle, having expanded it to some extent.
It’s possible to observe a continuation of a sideways action, at least until the interest rate decision from the FED next week and the press-conference of Jerome Powell, which might give (or might not give) any clarity about the possible direction of the market.
Overall activity remains muted as summer’s slow price action dominates the action.
Don't forget - this is just the idea, always do your own research and never forget to manage your risk!

US500 Will Fall! Short!
Here is our detailed technical review for US500.
Time Frame: 10h
Current Trend: Bearish
Sentiment: Overbought (based on 7-period RSI)
Forecast: Bearish
The market is approaching a significant resistance area 5,979.56.
Due to the fact that we see a positive bearish reaction from the underlined area, I strongly believe that sellers will manage to push the price all the way down to 5,838.14 level.
P.S
Overbought describes a period of time where there has been a significant and consistent upward move in price over a period of time without much pullback.
Disclosure: I am part of Trade Nation's Influencer program and receive a monthly fee for using their TradingView charts in my analysis.
Like and subscribe and comment my ideas if you enjoy them!

SPX: geopolitics shaping sentiment Although the previous week on US equity markets started with a positive sentiment, still the newly emerged tensions in the Middle East turned the sentiment to the negative side. The S&P 500 was looking for higher grounds, after recently reaching the 6K level again, however, turning 1,13% to the negative territory on Friday, after the news regarding the Middle East tensions. The index is back below the 6K, closing the week at 5.976. While investors were digesting the risks from the Middle East tensions, tech companies were the ones that were mostly driving the index to the down side. NVDA dropped by 2,09%, AAPL was down by 1,38%. On the opposite side was TSLA, with a Fridays gain of 1,94%.
On the other hand, the macro fundamentals were relatively positive for the US economy. The inflation is clearly calming down, with the US inflation in May at 0,1%, which was better from market estimate. Also the University of Michigan Consumer sentiment preliminary for June showed decreased inflation expectation by US consumers, at 5,1% for this year, from 6,6% posted previously.
The most important event during the week ahead would be the FOMC meeting, scheduled for Wednesday, June 18th. The Fed will also discuss the economic projections. This would be a day to watch on financial markets as it can bring some higher volatility.

Down for SPX500USDHi traders,
SPX500USD went exactly to the target of my previous outlook.
After price came into the Daily FVG it rejected from there and started the correction down.
So next week we could see more downside for this pair to finish a bigger correction down.
Let's see what the market does and react.
Trade idea: Wait for a small correction up on a lower timeframe to trade short term shorts to the previous Weekly low.
If you want to learn more about trading FVG's & liquidity sweeps with Wave analysis, then please make sure to follow me.
This shared post is only my point of view on what could be the next move in this pair based on my technical analysis.
Don't be emotional, just trade your plan!
Eduwave

Is SPX at a crucial point here.... inflection point?Until yesterday, it seemed that bulls were fully in control chugging along to make new ATH or go closer to previous ATH. Seemed like SPX was breaking from ascending triangle. Looked bulllish going into this Opex close, certainly propped by good data and good tariff comments.
Now with the recent war news, and the dip we had yesterday, seems like new pattern emerging (rising wedge) which is bearish. Also keep in mind the JPM hedge that expires end of month. The open interest shows that JPM hedge is still alive (they havent closed) and based on my calculations currently JPM has a loss of around $622M.
To stem losses market at minimum needs to be below 5900 by end of month (at 5900 JPM loses $59M but its chump change for them) and for them to be neutral or make money then SPX needs to be 5300 and below by end of month.
Currently around 5975, would mean a drop of 500-600 points in next 2 weeks... certainly can happen....
Appreciate your comments!

S&P 500 Daily Chart Analysis For Week of June 13, 2025Technical Analysis and Outlook:
The S&P 500 Index has displayed both upward and downward movements throughout this week's trading session, narrowly missing the targeted Outer Index Rally level of 6073. Currently, the index is characterized by a bearish trend, warranting attention towards the Mean Support level of 5940, with additional critical support identified at 5888.
Conversely, there exists a significant potential that, upon reaching the Mean Support of 5940, the index may recover and rise to the Mean Resistance level of 6046. This upward movement could facilitate an interim rally, culminating in the completion of the Outer Index Rally at 6073 and enabling the index to address the Key Resistance level positioned at 6150.

sp500 shortI feel things.
War in the other side that justifies the downside.
It will be amazing to see powel saving the us stock by cutting rates on summer.
Lets chill and see what happens, liquidity is also a position.

SPX500 – 4H Smart Money Concepts | Compression Breakout & LiquidThe S&P 500 has broken down from a tight ascending wedge within a premium zone, confirming a CHoCH and suggesting a shift in short-term order flow. A corrective move is now unfolding.
🔻 Bearish Short-Term Outlook:
Weak High + CHoCH within the premium zone confirms rejection.
Multiple FVGs below offer potential draw zones:
5,900
5,850
Strong liquidity pool near 5,668.57
🧠 Smart Money Roadmap:
Structure suggests a short-term liquidity hunt below recent lows.
Equilibrium zone rests near 5,650, ideal for reaccumulation/reload.
📈 Long-Term Outlook Remains Bullish:
If liquidity objectives are met and macro improves, we may see a bullish reversal back above 6,050 toward:
6,200+
Mid/long-term fib targets near 6,500
📊 Strategy Insight:
Short-term trade: Scalps into the 5,700–5,660 zone.
Macro timing: Watch July CPI/FOMC for bullish or bearish confirmation.
Long-term positioning: Start building once price reclaims structural BOS with a displacement.
🎯 Smart money plays both ways — sweep liquidity, then reprice.
#SPX500 #SMP500 #SmartMoneyConcepts #OrderFlow #LiquiditySweep #FVG #CHoCH #PremiumZone #TechnicalAnalysis #VolumeProfile #EquityMarkets #WaverVanir #TradingView

SPX500: Trade Setupwww.youtube.com
📉 SPX500 – 4H Short Setup | Smart Money Premium Rejection
Approaching a pivotal juncture on the 4H chart, where price interaction at the premium zone signals a noteworthy development. Notably, a rejection marked by a feeble high + CHoCH structure.
🎯 Current Thesis:
- Short Entry: 5,998.3 → Entering premium + inefficient zone
- Target: 5,790.1 → Previous FVG + BOS retest area
- Potential Reload Zone: 5,704.2 – 5,644.2 → Offering deep discount + mitigation opportunities
🧠 Structure + Liquidity Insights:
- Bearish intent affirmed by BOS + CHoCH
- Fib levels align for confluence, notably 0.886 rejection at 5,875.6
- Key FVG breached; distribution evident from premium swing failure
📊 Gameplan:
Execute initial target at 5,790, consider partial exit.
Monitor reaction for possible reload near 5,704 or lower at 5,644 for continued strategy.
Maintain caution above 6,018 (weak high) for risk protection.
⏳ Context:
- Increasing volatility, weakening internals
- Downside path supported by volume nodes
- Market reassessing risk premia amidst Fed pause
🏴☠️ Trade strategically akin to smart money. Avoid impulsive actions — prioritize displacements, mitigations, and liquidity tactics.
hashtag#SPX500 hashtag#SmartMoneyConcepts hashtag#Fibonacci hashtag#ShortSetup hashtag#OrderFlow hashtag#TradingView hashtag#BearishBias hashtag#PremiumRejection hashtag#IntradayStrategy hashtag#SMP500 hashtag#WaverVanir

SPX500 – 4H Short Setup | Smart Money Premium RejectionWe’ve reached a critical inflection zone on the 4H chart. Price has tagged the premium zone and rejected with a weak high + CHoCH structure.
🎯 Current Thesis:
Entry Short: 5,998.3 → Price entered premium + inefficient zone
Price Target: 5,790.1 → Previous FVG + BOS retest zone
Reload Zone: 5,704.2 – 5,644.2 → Deep discount + mitigation area
🧠 Structure + Liquidity Logic:
BOS + CHoCH validated bearish intent.
Fib levels confirm confluence:
0.886 rejection (5,875.6)
Price now under key FVG
Distribution confirmed by swing failure at premium
📊 Gameplan:
Target first leg to 5,790, partial out.
Watch reaction for potential reload around 5,704 or deeper at 5,644 for continuation play.
Protect invalidation above 6,018 (weak high).
⏳ Context:
Volatility rising, internals weakening
Volume nodes support downside path
Fed in pause → market reevaluating risk premia
🏴☠️ Trade like smart money. Don’t chase price — wait for displacements, mitigations, and liquidity raids.
#SPX500 #SmartMoneyConcepts #Fibonacci #ShortSetup #OrderFlow #TradingView #BearishBias #PremiumRejection #IntradayStrategy #SMP500 #WaverVanir

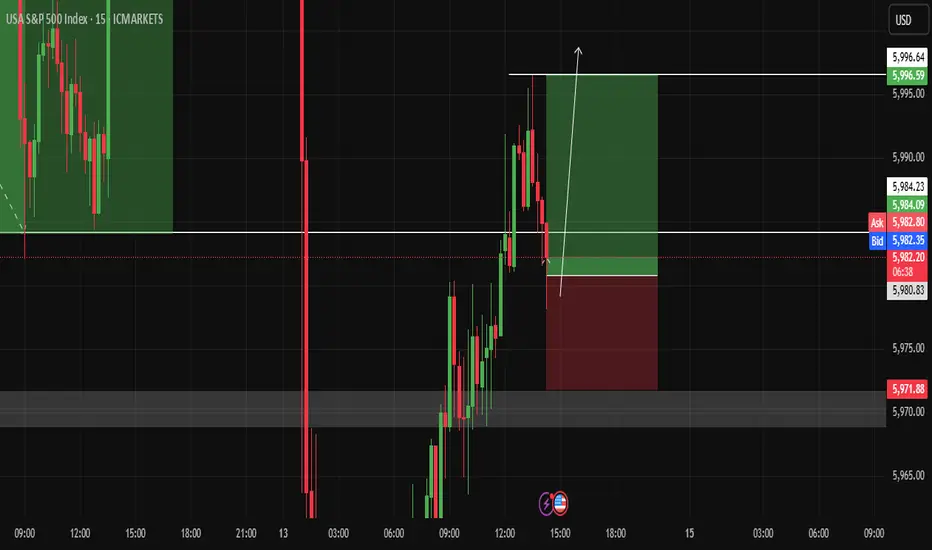
update TP for NASDAQ i see more ups for NASDAQ .The Nasdaq index touched strong support, so I think it will rise further, as shown.

-(update)- Opportunity for buying NASDAQ After careful observation and relying on support and resistance, I see an upward movement from the support represented in front of you.


Opportunity to buy NASDAQBy combining support and resistance, I see NASDAQ rising to 5996 before reaching to 5971