DXY, EURUSD & SP500 Daily Trade SetupsIn this update we review the recent price action in the Dollar, Euro & SP500 and identify the next high-probability trading setups and price objectives to target. To review today's video analysis, click here!
SP500FT trade ideas

SPX500 Holds Above 6,098 | Bullish Bias Toward ATH at 6,143OANDA:SPX500USD OVERVIEW
S&P 500 Futures Subdued After Near-Record Close | Market Eyes Powell’s Comments
U.S. stock futures were muted on Wednesday after the S&P 500 closed near an all-time high, following signals from Israel and Iran that their air conflict has ended.
Investors now await further comments from Fed Chair Jerome Powell for clues on the monetary policy outlook.
TECHNICAL OUTLOOK – SPX500
The price remains in a bullish trend as long as it trades above 6,098, with upside potential toward the ATH at 6,143.
However, a 1H or 4H candle close below 6,098 would likely trigger a bearish correction toward 6,056 and 6,041.
Pivot Level: 6,098
Resistance Levels: 6,143 → 6,175 → 6,210
Support Levels: 6,066 → 6,041

S&P500Current COT data supports a bearish or cautious outlook on the S&P 500. Current Bias: Bearish / Cautiously Negative

SPX is overheated, a correction is necessary📉 Market Update: No, It Has Nothing to Do with Trump
This move has nothing to do with Trump’s dramatic announcements. The reality is simple: the MACD on the daily chart is overheated, and a healthy correction is needed — likely down to the 5,520 level — before resuming the uptrend.
Now, does it surprise anyone that Trump acts like a PR agent for his investors? He always seems to drop “bad news” at the exact moment the charts call for a pullback. My guess? They're shorting right now.
🪙 Bitcoin Stalling
CRYPTOCAP:BTC is also losing momentum, and looks like it’s in need of a short-term correction as well. This suggests a week of consolidation ahead for the whole crypto market.
But let’s be clear:
🚀 The Bull Market Is Not Over
The weekly charts remain very bullish, and this trend could last another 4–6 months. The macro bullish structure for crypto remains intact.
However, in TradFi, there are cracks:
🔻 20-year bonds sold at 5.1% — a major recession red flag
💸 Tariffs are putting pressure on global trade
📉 The entire traditional market is starting to de-risk
🔮 What to Expect
Short-term correction to ~5,518 (first bottom target)
A possible rebound after healthy consolidation
A continued uptrend in crypto unless key support breaks
I’ll publish a new update when conditions change.
📌 Follow me to stay ahead of the market. And as always: DYOR.
#CryptoMarket #Bitcoin #MACD #TechnicalAnalysis #CryptoCorrection #BullishTrend #RecessionWarning #TradFi #Altcoins #BTC #MarketUpdate #TrumpEffect #DYOR

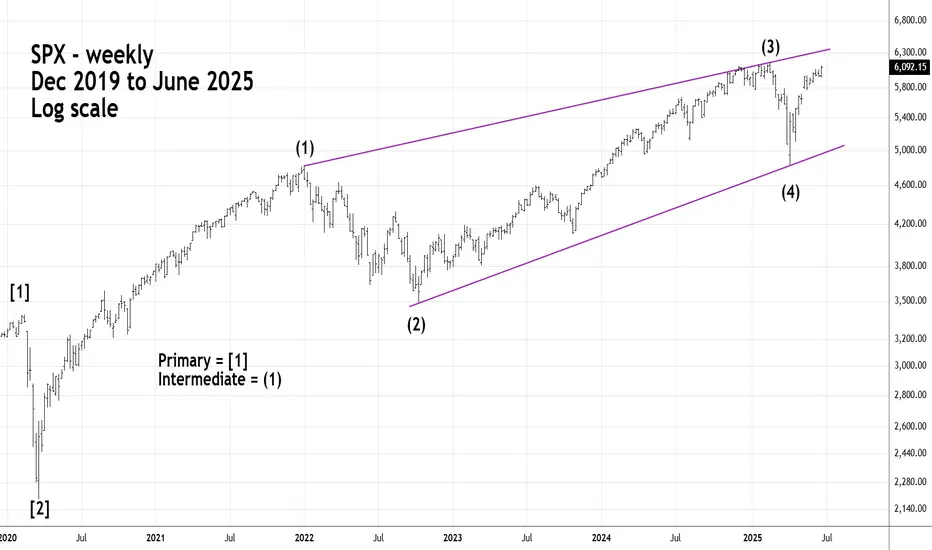
Long - Term S&P 500 - Elliott Imulse WaveThe S&P 500 - (SPX) could soon complete a five - year Elliott Impulse wave that began in March 2020.
Fibonacci resistance is in the SPX 6,200 area which could be reached on 06/26/25 or 06/27/25.
Nasdaq All-Time Highs, S&P Close, Blast Off or Breakdown?What an incredible melt-up since April 7 lows in the US markets.
Trump vs Musk - ignored
Iran vs Israel - ignored
High Valuations - ignored
FED Pausing - ignored
The US economy is resilient and it's a good thing because the world is performing really well (EX-US). Europe/China/India/Emerging Markets are outperforming the US by 15-16% YTD
The USD is having one its worst years ever in 2025
Gold, Silver, Bitcoin are great diversifiers in my opinion for 2025
Oil prices are incredibly volatile and energy stocks and commodities in turn are showing
volatility and big swings
As we near end of month and end of Q2, I have to believe the market is due for a small pause or pullback sooner rather than later - but we'll see
Thanks for watching!!!

Your investor profileEach investor has unique characteristics:
The amount of their current investments and savings
Their capacity to generate future income and allocate it to savings
Their personal and financial circumstances that may condition their liquidity needs
Their motivations and objectives for saving
Their discipline
Their willingness to learn
The time available for monitoring
Their knowledge and experience
Their risk aversion
All these characteristics are called investor profile .
Unless all these characteristics of your profile change, you must stay true to your investor profile. Bullish market environments are a temptation to take on more risk than we should.
It is also important to keep in mind that your investor profile changes with your life cycle .
While it’s great to share experiences, your investor profile is unique . When making your decisions, take advice based on your individual characteristics.
It is very important that you seek advice from trusted platforms and professionals and pay special attention to ensure that there is no clear commercial bias that could lead you to certain products or operations that may not suit your investor profile.
It is not a wise decision to copy from others : friends or forums created by entities with an obvious commercial bias, because your investor profile is unique.
Did you like it? Share with your friends.
by HollyMontt

rePOST - SPX Weekly Technical Breakdown – Week of June 22, 2025
SPX
Weekly Technical Breakdown – Week of June 22, 2025
After consolidating in a tight range earlier this month,
SPX
printed a subtle but significant outside day on Friday — breaking Thursday’s high by just 0.01 and forming a broadening formation. Like
QQQ
, this pattern reflects indecision and a potential shift in structure as bulls and bears battle for control. The short-term range is wide, with support at 5963.21 and resistance near 6026.68. Holding above 5963 can keep buyers in and opens the door for a retest of the psychological 6000 level, followed by 6059.40 (all-time high). However, a close back below 5963.21 could open the path for a quick flush toward 5900. Key intraday levels to watch include 5929, 5940.03, 5954.06, 5974.86, 5989.43, 6002.32, 6012.94, 6026.68, 6044.56, and 6059.21.
Technical Summary
• Structure: Outside day Friday formed a broadening formation
• Event Note: Slight break of Thursday’s high by 0.01 confirms outside bar structure
• Daytrade Pivots: 5929, 5940.03, 5954.06, 5974.86, 5989.43, 6002.32, 6012.94, 6026.68
• Macro View: SPX improves technically above 6000; breakout confirmed over 6026.68
• Downside Risk: Failure to close above 5963.21 could trigger fast move toward 5900
• Momentum Bias: Neutral to bearish until 6000+ is reclaimed and defended
Key Levels to Watch
🟢 Upside Resistance: 5974.86, 5989.43, 6002.32, 6012.94, 6026.68, 6044.56, 6059.21, 6059.40 (ATH)
🔴 Downside Support: 5963.21 (must hold), 5954.06, 5940.03, 5929
Trade Plan
• Hold above 5963.21 keeps upside scenario intact — look for reclaim of 5974.86 and 6000+
• Close below 5963.21 flips structure and may accelerate toward 5929, possibly 5900
• Scalps remain viable near 5954–6002 using intraday reactions at key levels
Decision Map
🟩 IF SPX HOLDS ABOVE 5963.21 → reclaim 5974.86 → target 5989.43 → 6002.32 → breakout toward 6026.68 → 6059.40 (ATH)
🟥 IF SPX BREAKS BELOW 5963.21 → watch 5954.06 → 5940.03 → 5929 → 5900 possible flush
Primary Trade Zone: 5954–6002
Alert Levels
Set alerts above: 5974.86, 6002.32, 6026.68
Set alerts below: 5963.21, 5940.03, 5929
This Week’s Key Catalysts for
SPX
This week’s economic calendar is packed with market-moving data that will likely influence
SPX
and broader risk appetite.
• Tuesday, June 24: Fed Chair Powell testifies to the House Financial Services Committee. His tone and guidance on future policy will be a primary driver for market direction. The same day also includes Consumer Confidence (June) and Fed commentary from Cleveland Fed President Beth Hammack — both potentially impactful.
• Thursday, June 26: Heavy data day with initial jobless claims, durable goods orders (May), core goods data, and the second revision of Q1 GDP. These reports will offer insight into both the labor market and the broader health of the U.S. economy.
• Friday, June 27: The most important inflation data of the week arrives with the PCE index and Core PCE (May). These are the Fed’s preferred inflation gauges and could shape expectations for a rate cut later this summer.
Overall, market participants will be closely watching Powell’s tone, inflation data, and any sign of slowing growth. Combined with Friday’s outside day and broadening structure,
SPX
is positioned for a move — the catalyst will determine the direction.

S&P500 1D Golden Cross, middle of 3y Channel, much upside to go!The S&P500 index (SPX) has been trading within a Channel Up since the final sell-off of the 2022 Inflation Crisis. The only time this pattern broke was for 4 days during the bottom formation (April 2025) of the recent Trade War.
Ahead of the first 1D Golden Cross since January 26 2023, the market looks more bullish than ever as it is trading within the 0.5 - 0.618 Fibonacci range of this Channel Up, suggesting that there is considerable upside before it tops.
The last Bullish Leg that started on the Channel Up bottom and peaked before a 1D MA50 (blue trend-line) test grew by +28.30%. Expecting a repeat of that, we may see the price targeting the 0.786 Fibonacci level at 6550 before the next 1D MA50 pull-back.
-------------------------------------------------------------------------------
** Please LIKE 👍, FOLLOW ✅, SHARE 🙌 and COMMENT ✍ if you enjoy this idea! Also share your ideas and charts in the comments section below! This is best way to keep it relevant, support us, keep the content here free and allow the idea to reach as many people as possible. **
-------------------------------------------------------------------------------
Disclosure: I am part of Trade Nation's Influencer program and receive a monthly fee for using their TradingView charts in my analysis.
💸💸💸💸💸💸
👇 👇 👇 👇 👇 👇

SPX500 Short There are multiple patterns on M15 and H1
All timeframes up to H4 are overbought
There are multiple double tops with divergence
This is at the all-time high, suggesting there will be a lot of resistance
Markets look like they are due for a drop after such a sharp move up\
Stop loss above 6130

Double Top Or M Pattern On SPXTraders and Followers , we have another opportunity in SPX/USD .
2 hr chart shows me a M pattern or double top. Lot's of points can be made if one takes a short position if the break-line 6079.9 area gets taken out. I have a sell stop just below that area and looking for 6005.7 as a target area.
A good trader waits for price to setup before entering any trade .
Best of luck in all your trades $$$

S&P500: Channel Up targeting 6,170.S&P500 is bullish on its 1D technical outlook (RSI = 65.737, MACD = 75.400, ADX = 16.727), unfolding the new bullish wave of the 1 month Channel Up, after a bottom near the 4H MA200. The first bullish wave one reached +4.35%, we expect to repeat that so for a few more candles we will remain bullish, TP = 6,170.
## If you like our free content follow our profile to get more daily ideas. ##
## Comments and likes are greatly appreciated. ##

SPX/USD Has A Double Top Pattern On The 1Hr Hey Traders and following gang!
Hope all are raking in profits on all your trades.
I spotted this double top setup on the 1hr SPX/USD.
A break below 5980.6 triggers a short down to target-1 5926.3
A break below 5943.8 triggers a short down to target-2 5842.1
A little scuffle in the Mid East helps this market fall so, short the ticker .
Best of luck in all your trades my friends and stay profitable $$$

S&P 500 - Pay Attention All the world events going on right now has put the S&P in a very interesting position. Even on the brink of war we have seen the SPX pushing towards all time highs. Right now it is entering the major supply zone (where we have seen many tops form) between $6,090 and $6,150. This supply zone has been forming since Dec 2024 and is very important to keep and eye on. Either price will create a macro double top/M pattern and lead us back towards the lows, or we will break above this supply zone a start the expansion phase towards our 1.618 which is currently just slightly below $7k.
The macro looks amazing as our lower white line represents of 2021 previous ATH and during the tariff collapse perfectly got flipped into a new level of support which we represent as our 2025 Macro Low.
The short term is also looking decent. We have identified price is about to enter major resistance so if we do see a pullback we want to target that $5,800 level as the level buyers need to hold to continue momentum. If buyers can push price to new highs in the short term we expect to see that move towards $7k by the end of the year.

SPX short analysisLike I wrote in my EUR/USD analysis you never know what could happened.
USA bombed Iran!
This could have huge impact on the US market next week.
My guess is temporarily short... At least to close this gap in spot price of SPX.
Since we're still in bearish market, until we see new highs, and this could be catalyst for another sell off. So the jump could be even bigger and we could see new ATH this year.
For now, I'm seeking a position to short tomorrow after market is open.
This is my entry mark.
There will be higher volatility. However, I expect US market to open in the red, close the gap and to sell off again.
We shall see!
Trade safe this one :)

S&P 500 (SPX) 1M next week?The S&P 500 is pulling back from a key resistance after completing a bearish AB=CD pattern on the monthly chart. Price action suggests a potential correction toward the 4662–4700 zone, aligning with the 0.618 Fibonacci retracement level, which may serve as a key area for bullish reaccumulation. Momentum indicators show bearish divergence, hinting at a cooling rally.
Fundamentally, the index remains supported by strong earnings in tech and AI sectors, but risks persist from elevated interest rates, sticky inflation, and potential Fed policy shifts. A pullback into the 4662–4700 zone may offer a medium-term setup for continuation toward 5198 and potentially 5338. A breakdown below 4662 would invalidate the bullish structure and shift focus to lower Fibonacci levels.

Short SPX500Elite Live Analysis
Weekly Market Structure: Price tapped into a key structure level and showed clear rejection.
Daily Market Structure: Currently bearish, actively pulling price lower.
4H Market Structure: A new structure has just been confirmed, providing fresh short-term context.
Expectations:
Looking for a structure-to-structure move on the Daily timeframe, aligning with the broader bearish bias.
Targets:
Primary targets are areas of structured liquidity and liquidity pools resting below current price levels.

S&P500 Bullish breakout support at 5980A fragile ceasefire is in place between the U.S. and Iran, but both sides are still blaming each other for missile attacks. Tensions remain high, especially as Iran’s stockpile of near-weapons-grade uranium is missing. Markets were shaken—stocks gave back some gains and oil prices dipped after Israel threatened to respond.
In business news, Nvidia’s CEO Jensen Huang began selling shares as part of a plan worth up to $865 million. Starbucks denied it's selling its China business, and Northern Trust said it won’t merge with BNY Mellon.
Fed Chair Jerome Powell will speak to Congress today, likely defending the decision to keep interest rates steady until at least September, despite pressure from Trump for major cuts.
NATO leaders are meeting in the Netherlands, with talks focused on defense spending. Trump is expected to push allies to meet the 5% target.
Key Support and Resistance Levels
Resistance Level 1: 6115
Resistance Level 2: 6147
Resistance Level 3: 6180
Support Level 1: 5980
Support Level 2: 5950
Support Level 3: 5910
This communication is for informational purposes only and should not be viewed as any form of recommendation as to a particular course of action or as investment advice. It is not intended as an offer or solicitation for the purchase or sale of any financial instrument or as an official confirmation of any transaction. Opinions, estimates and assumptions expressed herein are made as of the date of this communication and are subject to change without notice. This communication has been prepared based upon information, including market prices, data and other information, believed to be reliable; however, Trade Nation does not warrant its completeness or accuracy. All market prices and market data contained in or attached to this communication are indicative and subject to change without notice.

S&P 500 Futures Rise on Ceasefire Relief, Eyes on Fed PowellSPX500 OVERVIEW
U.S. Futures Rise as Ceasefire Eases Tensions, Focus Turns to Powell
U.S. stock futures climbed on Tuesday, with S&P 500 futures up 0.8%, extending gains from the previous session as Middle East tensions eased following a ceasefire announcement.
President Trump confirmed a ceasefire agreement between Israel and Iran, which appears to be holding for now—though early signs of potential violations have already emerged.
Market attention is now firmly on Federal Reserve Chair Jerome Powell’s testimony before Congress today, where traders hope to gain more clarity on the Fed’s economic outlook and rate path.
TECHNICAL OUTLOOK – SPX500
The price touched resistance at 6,098 and is currently hovering near that level.
Failure to break above 6,098 may trigger a short-term correction toward 6,041, before another push higher.
A confirmed breakout above 6,098 would open the path toward the All-Time High (ATH) at 6,143, followed by extended targets.
Support Levels: 6041 → 6010 → 5966
Resistance Levels: 6143 → 6175 → 6225
Stability above 6,098 confirms bullish continuation, while failure to hold may suggest a temporary pullback before resuming the uptrend.

Risk and Probability in Trading — Why Risk Assessment MattersRisk and Probability in Trading — Why Risk Assessment Matters More Than Chasing the “Holy Grail”
In trading, most participants and analysts are focused on finding the so-called “Holy Grail” — the perfect entry point where the price moves in the desired direction and yields profit. However, few actually assess the risks involved, as if success is possible without factoring them in. Market reviews are often filled with levels, forecasts, and price directions, but rarely include probability estimates or potential losses.
In my view, the real Holy Grail isn't a guaranteed profitable entry, but a scenario where the market offers a position with minimal risk relative to historical context. To identify such setups, we need a risk scale based on historical data — how favorable the current risk-to-reward ratio is compared to the past.
It’s also crucial to understand that no one can predict price direction with certainty. The key to opening a position is not hope, but evaluating all possible scenarios — upward, downward, or sideways — and knowing the outcome in each case. Risk management is more than just placing a stop-loss; it’s a structured approach that should be central to any trading strategy.
What Are Minimal Risks?
“Minimal risk” is a relative concept — it only makes sense when measured against a defined scale. Building such a scale requires historical statistics: what were the maximum and minimum losses and profits for similar positions in the past?
Profit-to-Loss Ratio
The idea behind the search for the “Holy Grail” is to find moments when the market offers the best possible profit-to-risk ratio. For example, if the current ratio is 10, and historically it has ranged from 0 (low risk) to 100 (high risk), then 10 may be a good entry point. If the ratio approaches 80–90, it signals that the position is extremely risky.
Why Are Probability and Risk Assessment Important?
Market reviews often talk about resistance levels, volatility, and price direction — but rarely address the risks of different scenarios. No expert can predict market movements with certainty — if they could, they’d be billionaires. Opening positions without accounting for risks and scenario probabilities is extremely dangerous.
How to Factor in Risks When Entering a Position
The key question is: what will the profit-to-loss ratio be after entering a position, depending on whether the price goes up, down, or stays flat? It’s important to understand the consequences of each case and make decisions based on risk assessment.
Risk Management Must Account for the Inability to React Instantly
Conventional tools like stop-losses and limit orders often fail to protect capital effectively during sudden price spikes. These tools are particularly vulnerable when market makers or high-frequency algorithms trigger stop levels en masse.
This highlights the need for more resilient risk management instruments — ones that can respond to volatility instantly and automatically. Options are one such tool, capable of limiting losses regardless of market dynamics.
Without robust risk management, long-term profitability becomes statistically unlikely. Sooner or later, the market will present a scenario that can wipe out your capital — unless you’re properly protected.
Important note: this is not an endorsement of options or any specific broker. It’s simply a conclusion based on the logic of building effective capital protection. If a broker only provides access to linear instruments (futures, spot, stocks) without the ability to hedge, it will inevitably lead to capital erosion — even for systematic traders.
And if this article gets more than 100 rockets, I’ll continue sharing specific examples of low-risk trading assessments.

Stock Markets Rebound Following Trump’s Ceasefire AnnouncementStock Markets Rebound Following Trump’s Ceasefire Announcement
Last night, U.S. President Donald Trump made a social media post announcing a ceasefire agreement between Iran and Israel. According to his own words, the ceasefire is set to last “forever.” This announcement triggered a sharp bullish impulse (indicated by the blue arrow) on the S&P 500 index chart (US SPX 500 mini on FXOpen), pushing the price to a new high above the 6074 level.
Just yesterday, traders feared that the United States could be drawn into yet another costly war following bomber strikes on Iran’s nuclear facilities. However, today the stock markets are recovering, signalling growing optimism and a waning of fears over a major escalation of the conflict.
Technical Analysis of the S&P 500 Chart
When analysing the S&P 500 index chart (US SPX 500 mini on FXOpen) seven days ago, we identified an ascending channel. The angle of the trend remains relevant, while the width of the channel has expanded due to the downward movement caused by tensions in the Middle East.
Notably:
→ the price marked the lower boundary of the channel as well as the internal lines (shown by black dots) dividing the channel into quarters;
→ the latest bullish impulse suggests that the upward trend is resuming after breaking out of the correction phase (indicated by red lines).
It is possible that in the near future, the S&P 500 index (US SPX 500 mini on FXOpen) could reach the median line of the channel. There, the price may consolidate, reflecting a balance between buyers and sellers—particularly if the peace in the Middle East proves to be lasting.
This article represents the opinion of the Companies operating under the FXOpen brand only. It is not to be construed as an offer, solicitation, or recommendation with respect to products and services provided by the Companies operating under the FXOpen brand, nor is it to be considered financial advice.

SPX500As on NASDAQ100 Analysis, seeing a shorting position herein as well, for a fair drop to the recent demand zone and QML levels, sort of skewed Head and Shoulder pattern unfolding due to give the second bearing shoulder.

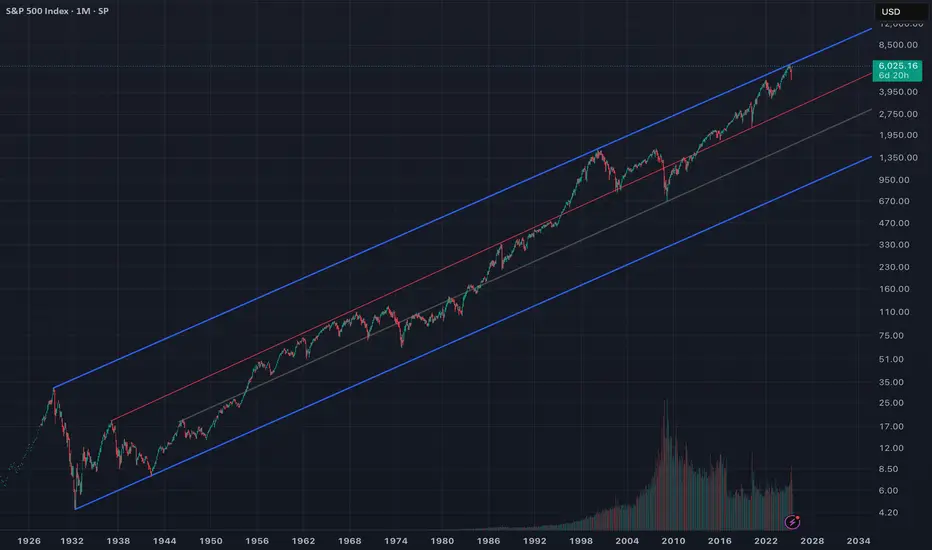
🇺🇸 America at the Crossroads: Golden Age or Great Reset? As the S&P 500 crosses 6,000 , investors celebrate yet another all-time high. But beneath the surface of this rally lies an uncomfortable truth: we are standing at a national and market inflection point.
This isn’t just another leg up. This is the top of a century-long trend channel, a moment where all prior historical peaks have led to sharp reversion . Will this time be different?
📉 Or are we heading into the final blow-off top of a fiat-fueled bull market ?
📈 Or is this the birth of a new nominal supercycle — a “Golden Age” driven by AI, deglobalization, and fiscal firehoses?
📊 The Chart That Frames the Future
This chart stretches back to 1926. Price now presses against the upper blue boundary , just like in:
1929 → Great Depression
2000 → Dot-com Crash
2021 → Post-COVID Inflation Panic
Every previous touch has ended in multi-year mean reversion . Will we now break out — or break down?
🕰️ The Fiat Currency Clock Is Ticking
“The average lifespan of a fiat currency is 80–100 years.”
The U.S. defaulted on gold bonds in 199 and the U.S. dollar was untethered from gold in 1971. We're many years into a fiat system. Every fiat regime in history has collapsed under debt, inflation, and loss of confidence .
📉 K-Shaped Economy and the Strained Consumer
Since 2008, monetary policy has disproportionately enriched capital holders. Asset owners got rich. Wage earners stagnated.
Now we see:
-Record-high credit card interest
-Rising consumer delinquencies
-Real wages trailing inflation
This is not a healthy economy — it’s a two-speed system with widening fractures.
📈 The Most Expensive Market in History?
CAPE Ratio : ~33x — rivaling 1929 and 2000
ZIRP is gone , yet valuations remain elevated
Investors are pushed out the risk curve by low real bond yields
This is the result of TINA (There Is No Alternative) — but that narrative is fragile.
🏦 Cracks in the Core: Treasuries and Liquidity
The U.S. Treasury market is flashing red:
Weakening auction demand
Foreign buyers (like China, Japan) stepping back
Bank of Japan may be forced to liquidate U.S. debt
Liquidity is thinning — just like in 2007
🤖 AI and the Accelerating Wealth Gap
AI is a double-edged sword:
It boosts productivity
But it eliminates mid-skill jobs
It consolidates wealth into a few mega-cap tech monopolies
And it strains an already outdated energy grid
AI could fuel inequality and fragility .
🌍 End of Globalization and Rise of BRICS
The BRICS alliance is actively challenging dollar hegemony
Trade is shifting to commodity-backed and bilateral settlement
U.S. foreign policy is being stress-tested on multiple fronts (Ukraine, Taiwan, Middle East)
The post-WWII order is unraveling. And America must adapt — or lose ground.
⚠️ Blow-Off Top Before the Storm?
This market feels like a blow-off top :
Narrow breadth
Retail mania
AI euphoria
Massive fiscal deficits
All-time high valuations
Next step? A potential deflationary bust , followed by a stimulus-fueled inflationary wave — especially in energy and commodities.
⚡ Power Grid Risk in an Electrified World
AI and EVs demand **enormous energy inputs**. But:
U.S. grid is **underdeveloped**
Transmission infrastructure is outdated
Blackouts are increasing
China, meanwhile, has been quietly building resilient grid systems for over a decade taking advantage of Nuclear, while The U.S. risks falling behind.
🌀 The Fourth Turning: Crisis as Catalyst
“History doesn't repeat itself, but it often rhymes.” – Mark Twain
According to Fourth Turning theory, we are nearing the climax of a ~100-year generational cycle — a period marked by institutional breakdown, global conflict, and radical transformation. Each cycle contains four “turnings,” and we are now deep into the fourth: the Crisis phase.
The current Fourth Turning began in 2008 with the Global Financial Crisis. It is expected to resolve sometime between 2025 and the early 2030s — a period of upheaval that mirrors previous turning points such as:
The Great Depression & World War II (1929–1946)
The American Civil War (1861–1865)
The Revolutionary War (1775–1794)
As Neil Howe writes in The Fourth Turning Is Here (2023):
“Each Fourth Turning is a time of radical disruption — a time when an old order is replaced by a new one, often through war, collapse, or revolution. ”
Today, we face:
Political polarization at generational extremes
Sovereign debt levels previously only seen during world wars
Eroding trust in media, financial institutions, and government
Technological upheaval via AI and automation
Geopolitical flashpoints from Ukraine to Taiwan
The market, the dollar, and our political system are not outside this cycle — they are central to it.
The question is no longer whether we are in a transformation, but:
What kind of world will emerge on the other side?
🚧 The Fork in the Road: Two Futures
We stand at a fork in the road — not just for markets, but for **America’s future**:
🟢 Path 1: The Breakout – Golden Age
AI revolution supercharges GDP
Commodities rise but wages lag
Treasury/Fed normalize debt via inflation
S&P and assets soar in **nominal terms**, even if real value lags
🔴 Path 2: The Reversion – Great Reset
Credit cycle breaks
Liquidity vanishes
Markets mean revert 40–60%
Global capital flees to safety
🧠 Final Thought: Don’t Chase the Top
“At the top of a long-term channel, humility is a better strategy than hubris.”
Now is not the time to blindly chase momentum. Whether we break out or break down, the risks are rising — and history offers few second chances after peaks like this.
We stand not only at a technical inflection, but at a civilizational one.
The Fourth Turning is reaching its apex, and markets are reflecting that tension — between collapse and rebirth, between order and entropy.
📌 Hedge.
📌 Diversify.
📌 Prepare.
Because one way or another, America is crossing a threshold — and there’s no going back.