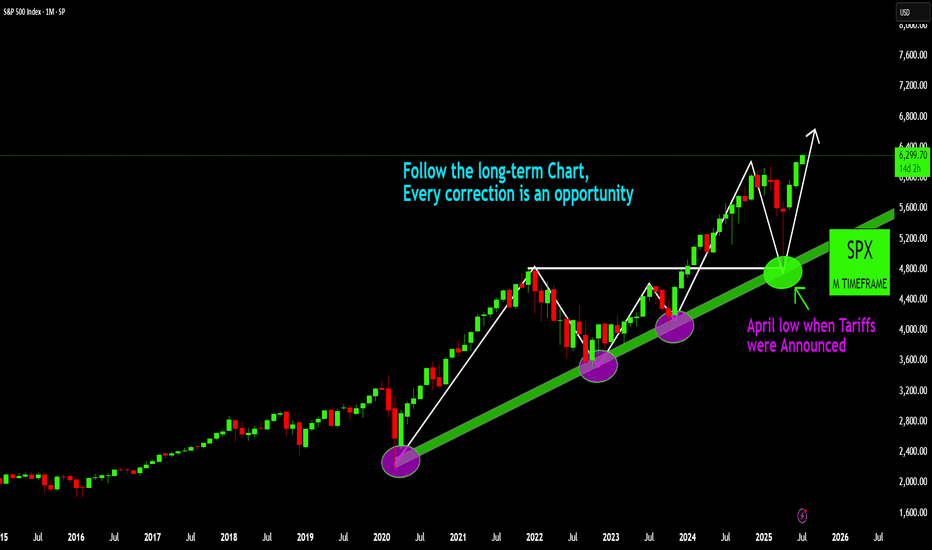
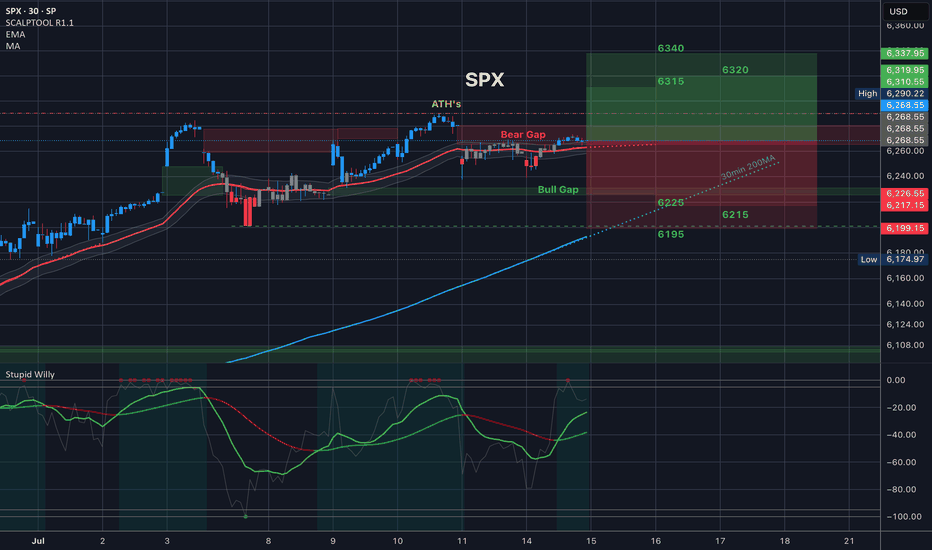
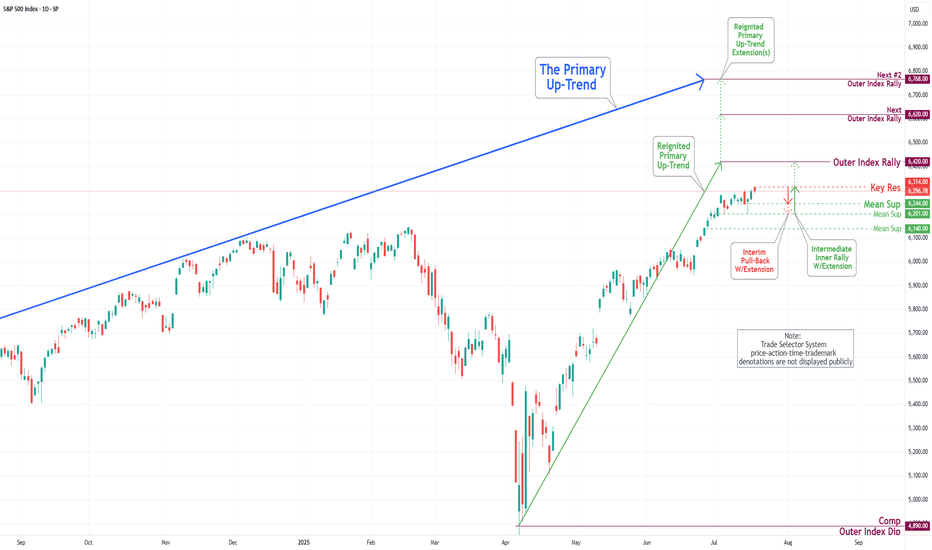
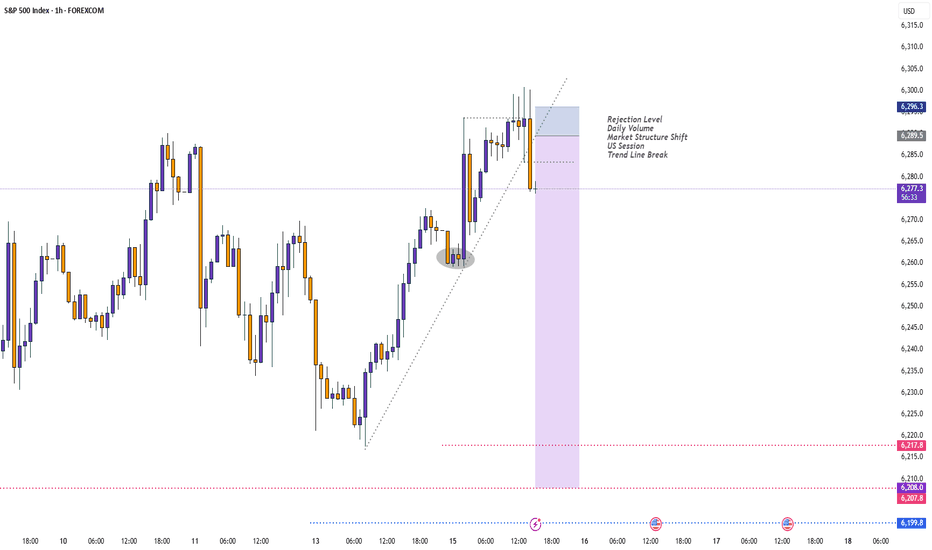
+10% from tomorrow till mid-MaySPX is getting ready to rebound with around 10% till mid-May. Invalidated if breaks below 5400. Longby AlbCMUpdated 151520
S&P500 Tariff comeback may be starting a whole new Bull Cycle!The S&P500 index (SPX) is making a remarkable comeback following the non-stop sell-off since mid-February as, following the tariff 90-day pause, it is staging a massive rebound just before touching the 1W MA200 (orange trend-line). Since that was almost at the bottom of its bullish channel while the 2W RSI hit its own Higher Lows trend-line, this can technically initiate a 2-year Bull Cycle similar to those that started on the October 2022 and March 2020 bottoms (green circles). The fact that the current correction has been almost as quick as the March 2020 COVID crash, may indicate that the recovery could be just as strong. In any event, it appears that a 7200 Target on a 2-year horizon is quite plausible, being close to he top of the bullish channel, while also under the 2.0 Fibonacci extension, which got hit during both previous Bullish Legs. ------------------------------------------------------------------------------- ** Please LIKE 👍, FOLLOW ✅, SHARE 🙌 and COMMENT ✍ if you enjoy this idea! Also share your ideas and charts in the comments section below! This is best way to keep it relevant, support us, keep the content here free and allow the idea to reach as many people as possible. ** ------------------------------------------------------------------------------- Disclosure: I am part of Trade Nation's Influencer program and receive a monthly fee for using their TradingView charts in my analysis. 💸💸💸💸💸💸 👇 👇 👇 👇 👇 👇Longby TradingShot4426
S&P 500 to 7000+ Full analysis of current levelsI don't make a lot of videos but I thought this idea warranted one so I could share the detail. First of all, I'd like your feedback - what else do you see? what did I miss? Let me know. Key points from this video: We are coming up on the COVID lower trendline We are currently sitting on a key level that has a confluence of 50% retrace on downward channel The 61.8 retrace is in confluence with a number of key items: The COVID Trendline, Volume Profile, 2022 high, and current channel Momentum is also supportive of a pivot So, what do you think?Long09:19by novamatic555
Stock Market Dives into Correction? It Happens—Here's What to DoYou wake up, check your portfolio, and see a sea of red. The market’s down, your stocks are taking a nosedive, and CNBC is running apocalyptic headlines about an impending crash. Sounds familiar? It’s maybe because we’re in (or super close to) a correction right now — the S&P 500 SP:SPX was down 10% from its record high two weeks ago and a lot of people are unsure what to do. The truth of the matter is, stock market corrections are routine—not as often as the meeting that should’ve been an email, but also not as rare as a winning trade in the Japanese yen ( widow maker is real, yo ). And, most importantly, they’re usually not as catastrophic as they feel in the moment. So, before you hit the panic button (or worse, start revenge trading to “win it all back”), let’s talk about what’s shaking the market right now and how to navigate corrections like a pro. 🤔 First Things First: What’s a Correction? A stock market correction is a drop of 10% or more from a recent high. It’s not a crash, it’s not the end of capitalism, and it’s definitely not a sign that you should liquidate your entire portfolio and move to a remote cabin in the woods. Corrections happen regularly, typically once every year or two. They’re a natural part of market cycles, shaking out excessive speculation and resetting valuations to more reasonable levels. For the record, a drop of 20% is considered a bear market. 🤝 Why the Market’s Getting Jittery Markets don’t move in straight lines, and sometimes they hit turbulence. Lately, two big themes have been dominating headlines: Trump’s Hard-Line Tariffs Hit Hard (And Markets Are Nervous About It) If there’s anything Trump knows how to do is say things online or on-site and move markets. And his hostile and straight up combatant approach to handling international relations has sent traders scrambling to offload risk. With hiked tariffs on China, Europe, and Mexico and Canada, businesses are bracing for severe supply chain disruptions, higher costs, and tighter margins. When tariffs go up, corporate earnings tend to go down—and the market doesn’t like that math. Inflation Just Won’t Quit The Federal Reserve spent most of the last two years trying to tame inflation, and just when it seemed like things were cooling off, it’s creeping back up. The latest readout of the personal consumption expenditures (PCE) report showed prices ticked up more than expected at 2.8% in February. Higher inflation means the Fed might keep interest rates elevated for longer than expected, making borrowing more expensive and slowing down growth. Every new inflation release has investors guessing: Will the Fed cut rates, hold steady, or—worst case—hike again? Between trade wars and stubborn inflation, uncertainty is running high, and that dynamics breeds volatility. But a correction doesn’t mean the market is broken—it just means sentiment has shifted. ⚠️ How NOT to React (aka: Rookie Mistakes to Avoid) When corrections hit, bad decision-making is at an all-time high. Here’s what not to do: Panic selling – Selling at the bottom is a classic rookie move. If you weren’t planning to sell at the highs, why dump everything when it’s down? Trying to time the exact bottom – Good luck. Nobody, not even Warren Buffett, can catch the bottom (not that he’s trying). If you’re waiting for the “perfect” dip, you’ll likely miss the rebound. Going all-in on one asset – Thinking of putting everything into one stock or crypto because it’s “cheap” now? Please don’t. Diversification exists for a reason . Getting glued to financial news – Watching every market update during a correction is like doom-scrolling Google after a mild headache—you’ll only freak yourself out more. Now that we’ve covered what not to do, let’s focus on the smart plays. 💪 So, What Should You Do? If you want to come out of a correction with your sanity (and portfolio) intact, here’s your game plan: 1️⃣ Zoom Out—Corrections Are Temporary The market moves in cycles, and corrections are just part of the game. Historically, corrections last a few months, while bull markets last years. If you’re investing for the long term, a correction is a blip on the chart, not an extinction event. 2️⃣ Review Your Portfolio Like a Hedge Fund Manager Corrections are a great excuse to audit your holdings. Ask yourself: Is this stock/ETF/index still worth holding? Has anything fundamentally changed, or is this just temporary market noise? Do I have too much exposure to one sector? Think of it as spring cleaning for your investments. It's also an opportunity to make some good use of the handy Stock Screener or Stock Heatmap to spot the best (and worst) performers. If something was a FOMO buy and doesn’t belong in your portfolio, consider trimming it. 3️⃣ Buy Selectively, Not Blindly Corrections create opportunities, but that doesn’t mean you should just throw money at every stock that’s down. Some companies deserve their declines ( looking at you, Nikola )—others are just collateral damage in a broader selloff. Look for quality companies with strong earnings, manageable debt, and real growth potential. If they were solid before the correction, they’ll likely recover faster than the overhyped names. Example: Remember when Amazon stock NASDAQ:AMZN tanked 90% in 2000, the dot-com bubble? No, because you were too busy being 2 years old instead of loading up on Jeff Bezos’s dream. And look where the guy’s now. 4️⃣ Do Some Good Old DCA Instead of dumping all your cash into the market at once, use dollar-cost averaging (DCA). Buying in small increments at regular intervals helps you avoid the stress of trying to time the bottom. If prices drop further, you can buy more at an even better price. 5️⃣ Keep Emotions in Check Corrections test your patience and discipline. The best investors don’t let fear dictate their strategy. If you’re getting emotional about your trades, step away from the screen and take a breath. The market will be there when you come back. 👍 The Market Always Bounces Back—Eventually Every correction feels like the worst one while it’s happening. But let’s look at history: The S&P 500 has faced 30+ corrections since 1950. It survived them all. The average correction lasts four months before a recovery begins. After a correction, markets typically rally higher within a year. Unless you believe the global economy is permanently broken (hint: not yet, at least), every major downturn has eventually turned into a new bull run. 🦸♂ Final Thought: Be the Hero, Not the Victim Market corrections separate the professionals from the wannabes. The people who panic and sell at the bottom? They usually regret it. The ones who keep a level head, stick to their strategy, and take advantage of good opportunities? They come out stronger. And finally, if you need to take away one thing it’s this: Corrections aren’t the enemy. They’re the price of admission for long-term gains. 👉 Let’s hear it from you! How do you handle corrections, what’s your strategy when the market is in a downturn and what’s in your portfolio then? Share your experience in the comment section!Educationby TradingView1313289
Modified Count to Reflect Recent DeclineIn truth, the levels we're seeing this morning when the SPX cash market opens, I was not anticipating seeing till the 3rd quarter of this year. Mid last week, we had positive MACD divergences on the intraday charts and was setting up to be almost a textbook bottom. Nonetheless, the SPX cash market will not hold the must hold zone when it opens this morning. This means we will get a retracement higher in a minor wave B that should last some time. This will represent one the final opportunities traders will have to relieve themselves of excess portfolio leverage and risk. We very well may spend the summer months retracing higher...but there is no doubt some of you reading this will assume this will result in the resumption of the previous bull market. It will not be.by maikisch3318
SPX Tariff Relief dips to buy: 5282 ideal, 5100 a Must-Hold zoneStonks got sold in panic then bought in fomo. We of the Fib Faith indulge in logical serenity. We plan and execute calmly and deliberately. 5428-5454 bounce would indicate Strong Bull. 5271-5282 Bounce would be ideal structural dip. 5109-5136 is the Must-Hold or it was a bull trap. ==========================================by EuroMotif2218
Bear Pattern Often Would Spike One More Time The swings of the week so far have created a giant pending butterfly- which may be the most important setup we've seen in SPX for a long long time - certainly the most important during this drop. A butterfly here in its book context is a bearish pattern, but if you follow my work you'll know I always say harmonics are binary decision levels. If they work, the accurately forecast the reversal zone and then often the implied swing to follow- when they fail, they tend to indicate strong moves in the other direction. Off a setup like this, a failure of the butterfly would be failure of the downtrend. A successful butterfly would be a failure of the bigger overall uptrend. It's a high stakes moment. But bears should be aware we could be 98% right here and still face a brutal stop run. Protecting profits from higher entries now. Ideally want to size up into a spike. Shortby holeyprofit557
Update on my thoughts on long term fibs thesis I wanted to give an overview update for those who've followed my macro thesis over the years. I've used various different things to support it but when it's come to my thoughts as to when the idea has failed I've always thought the only thing I really use for that is the big 4.23' of the 2008 crash. Since 2019 I've used the thesis big fib levels will foretell big moves in SPX, and it's worked really well. Inside the theory of trend formation through a fib swing I have been using, the 4.23 is the final boss. It's the biggest most important swing and at it everything is high stakes. 4.23 rejections can lead to 1.27 retracements. In the context of this chart, that would be a depression style move. When this area was first hit in 2022 it made the high there. One of my known for 4.23's is they'll often bluff and then have some sort of spike out. So if the 4.23 is actionable, we'd be in the end game now. Trying to work out exactly how much spike tolerance is very difficult but in the bear thesis this trading above the 4.23 should turn into a strong rejection. I'm talking conditions where weekly charts look like the 4 hour charts did in the original 10% break. What would happen on a 4.23 reversal would be unspeakably bad with the size of these swings, and this 4.23 principle can be found time and time again marking the end of extreme moves (both up moves and crashes). That's a concerning thing. If there's even a 5% chance of that happening I feel I have to think about it. Based on the odds of the fibs, the odds would be higher. It'd be fair to say thinking a fib can affect such big things is irrational. But it would be honest to accept to ignore the fact they actually have right in front of us is all the more irrational. But the 4.23 might break! It's difficult for me to tell you the specific price at which I'd consider the 4.23 to have been broken but I can tell you the idea that it might break is something I deeply consider- because if that is going to happen, my bear thesis would never be correct inside a workable time/price move. This isn't a "Right eventually" sort of thing. The patterns have expectations. If the 4.23 is not a top, then the plan totally changes. Because I know from my intraday / week trading that I really love to be fading 4.23s and 4.23 spikes regularly but if and when they fail the most exceptional of things happen. These are not all that notable intraday to anyone other than levels traders, but what if the same concept scaled up - I wondered. I wondered this a while ago and noticed it was something I'd never really checked. As it happened, all the 4.23s I looked at in indices reversed. Initially I found it tricky to find them but then I noticed the highest probability place to find them was heading into bubbles. And this makes me super wary of the fact my bear thesis could be spectacularly wrong. Because around about this zone Nasdaq was getting into a 4.23 - and this looked quite bubble-like. If I'd seen this in real time in the 4.23, I'd have thought that worth a fade. 1998. The Nasdaq did not make a high in 1998! 1998 was in fact a rather bad time to have a persistent bear thesis. But you could have made money. For a while there was a flux. During this you could have made some money. You'd just have to know when to stop doing that. Inside a thesis such as this, when there is a drop you always have to consider we might be in a spot something like this. From this move Nasdaq would go into a rally that literally changes the perspective of the chart. As you click through bar by bar the previous crash bars become hard to see. Nothing but up. Then sideways. Nothing but up. Then we're inside of the topping zone. If you didn't decide before the fact, where do you drop the bear thesis there? It's tough. Because the rally section would seem like a blow off. Then we go sideways. Which feels like the steam has ran out. Then we go into the real blow off. Where to close your short would be handled for you if you didn't - but it's hard to know when you'd flip bull there. For me, at least. Because I'd want to buy a crash move. And there really are not all that many of them. My style of trading is optimised for trading reversals (either of corrections or absolute) and steady and persistent pullback-less trends are trickier for me. I need to have a really good idea of where I'd want to switch to that style and my failure conditions (because all that momentum trading with no stops stuff isn't for me - I could not sleep at night - being someone who's benefited from so many major trend reversals and seeing how fast they happen). Looking through different examples of 4.23 breaks (which really are mostly found before bubble like moves or crashes if inverted) I have come to conclusion that the best thing to have done would have probably been to buy the low of the last crash before the bubble. Just buy the low before the bubble. That's it. Thanks for reading! Of course, on a more practical level - we actually have to try to do that. Now...if the break was coming, we'd maybe actually be AT that spot. I think to give the bearish 4.23 thesis its full fair chance we have to accept some sort of stop running above this recent high. Stuff like that is totally fail game. Even something a bit more spikey would be fine if it rejected. But if we trend up here, break highs and then continue to trend up, I really do think that would be the conditions where I would stop generating bear short levels. I'd switch my methods to generating bear risk areas but main using these for bullish trail/breakout decisions. I first came into indices in 2019 with my bear thesis on SPX. Which was spectacularly half right. But I'd forecast a two leg crash. Fortunately enough for me, when the high was broken I became disinterested in SPX and went back to Forex. Only setting an alert for the next big level, which triggered 2021. This is when I setup the "HoleyProfit" username. This period of time has been the best time to be a bear inside of my trading lifetime. But I believe if we're not somewhere deep inside the end game for this bull market we could head into conditions where if you trade flawlessly as a bear you can perhaps scrape breakeven eventually. Which are not good times to be a bear. They'd be good times to be a bull. If I don't think about this, we could have a move that looks like an obvious blow off in SPX to me. And ends up looking like this. Which I don't want to be short into. And realistically I'm not. I'd hit stops well before any of that madness affected me. But I don't want anyone who's followed my ideas and seen these having the big previous successes thinking it's a slam dunk sort of thing. I do believe if my bear thesis failed it would be spectacularly. I believe we're in a bubble. Whether we're late or mid bubble I am open minded to. Being mid bubble and being aware of it would be INCREDIBLE. Some people think I am determined to be a bear just because I want to be. I'd be happy with massively awesome markets. A trend one way or the other pay just as much to me. It's better to make money in conditions your broker and bank are not going out of business. I really don't mind being bullish. It's just sketchy doing it at major resistance levels with all the other weird confluences (like interest rate patterns etc). We are somewhat close to crux in this thesis. Hopefully you can easily understand how it's not practical to put a price on specifically but I do want to note that while I have plans to short different bull trap levels / spike outs on this rally - we are getting the point where my net thesis may be proven wrong on the large reversal. If that happens, my option and style will be become polar opposite. For me to continue to be bearish above the 4.23 would be me just wandering off into a jungle of random for trying to have an overall plan. And in fact, for me to not switch my bias from bear to hyper bullish on a 4.23 would be intellectually dishonest and directly fading the edges that the original idea bet on. Markets may make big reversals at major resistances, but if they break- can be much different. I wanted to be clear and thorough on this while while are still generally low. While I've discussed some different bear plans into a rally, it is also one of my considerations that this rally could end up spelling out the end of my bear thesis if we made new highs and were persistent. The net bear thesis will be right or wrong inside a specific zone. That zone is big and tricky to define, but it's specific. Specific in the fact that I'm saying we're specifically in that zone. There's potentially for setups that could take a lot of time to complete, but in terms of the zone and conditions what's accepted is getting narrower and narrower. It is entirely placeable within the next 6 months my entire macro swing bias will have changed. Or this might all just be the bull trap taking. We'll see how it goes. by holeyprofit336
So here’s what I’m doing: Not Panicking.This analysis is provided by Eden Bradfeld at BlackBull Research. Listen, the US has survived the depression of WWI, the Great Depression, the depression of WWII, oil shocks, the dot com bubble, the GFC, the COVID-sell off. It’ll likely survive this. In the scope of history, that $1 survived very well indeed. Panicking and running for the hills does not do so well. Winston Churchill was a great and flawed man but a terrible investor; he bought and sold shares prior to the 1929 crash in such speculative investments as mining companies, railways, and so on — most of them lost money (hence why Churchill continued to write at such a pace — to fund his Champagne-and-spec stock lifestyle). Hetty Green, on the other hand, (known as the “Queen of Wall Street”, managed to do very well her time — her quote? I buy when things are low and no one wants them. I keep them until they go up, and people are crazy to get them. Now, that’s something I can get behind. Nobody wanted Meta a few years ago. I wrote an internal memo, close to its plummet in ‘22 (it got to $99 or so a share!). I wrote this: ii) Yet what if we were to tell about about a company with this set of heuristics? Let’s call it “Company A” Company A has a 31% return on equity and a 20% return on capital. It has a net income margin of 37% and a FCF margin of 21% Its income has a compounded annual growth rate over the last 5 years of 41% If we add in numbers, now, let’s say the net income for 2020 was $29 billion, and $10 billion of that was used to repurchase stock from shareholders? Let’s say the unlevered FCF is around $6 billion per quarter, and let’s say the debt to equity ratio is about 9x. In other words, Company A is grows at a quick clip, and has done sustainably for the majority of its life. Its return on capital and return on equity would make any investor happy. Its FCF is an absolute machine. Would you buy Company A? Company A was Meta . You would’ve roughly made 4x or 5x’d your money if you’d bought around then. The point is, the fundamentals of a business matter, and right now there a quite a few exceptional businesses with good fundamentals trading at a good price. Alphabet (Google) trades at ~16x earnings. LVMH trades at ~18x earnings. And so on. Brown-Forman trades at ~15x earnings. These are all “inevitables” — Google will continue to be a dominant advertising platform, LVMH will continue to sell luxury, and Brown-Forman will continue to sell Jack Daniel’s and so on. I talked to my ma in the weekend. She is not really a share person. Her portfolio is a bunch of “inevitables”. It’s done very well. She said “aren’t you worried about this stock market?”, and I said “You love supermarket shopping, Mum. If you see something at a 25% discount you buy it. You come home, and you’re delighted that you found some mince on special²” She was like, “oh, that makes sense”. The problem is you have a lot of people looking at charts and catching worry that the world will end. The world, I am delighted to say, has a magnificent disposition to carry on.by BlackBull_Markets224
It May Be Different This TimeStocks have recently experienced selloffs reminiscent of the subprime crash and Covid. However, there might be something different this time. This monthly chart of the S&P 500 highlights the three moments in history. The Global Financial Crisis is marked in white. The coronavirus pandemic is in teal and the tariff selloff is colored yellow. Simple price action on the stock index is mostly comparable, with large solid red candles revisiting levels from months (or years) prior. Two other charts, however, paint a different picture. They represent risk-off “safe havens” that typically move a certain way versus the “risk-on” S&P 500. The U.S. dollar index typically climbs during sharp downturns in the stock market and the 10-year Treasury yield usually falls as bond prices rise. The current period, however, has seen the U.S. dollar bleed lower. This is especially puzzling because higher tariffs should reduce imports, which in turn should reduce selling of the greenback. The 10-year Treasury yield has also made a small move relative to the stock market’s dramatic volatility. TNX broke to multiyear lows during the last two crashes, but this time it’s holding levels from October. Aside from the apparent anomaly, there could be a few takeaways from this price action. First, GFC and covid happened during a major secular bull market in Treasuries. But since the pandemic, yields have shown signs of a longer-term upside reversal. If that new trend continues, it may weigh on stock sentiment well into the future. Second, weakness in the greenback has corresponded to weakness in U.S. stocks. That may reflect capital outflows away from the U.S. as a general market. Third, the labor market has been resilient. A continuation of that strength could prevent the Fed from cutting interest rates. In other words, it could be the opposite of Goldilocks: an economy that’s too cold to drive profit growth but too warm to justify rate cuts. Given this potentially challenging mix of factors, investors may ask whether a new secular bear market has begun. TradeStation has, for decades, advanced the trading industry, providing access to stocks, options and futures. If you're born to trade, we could be for you. See our Overview for more. Past performance, whether actual or indicated by historical tests of strategies, is no guarantee of future performance or success. There is a possibility that you may sustain a loss equal to or greater than your entire investment regardless of which asset class you trade (equities, options or futures); therefore, you should not invest or risk money that you cannot afford to lose. Online trading is not suitable for all investors. View the document titled Characteristics and Risks of Standardized Options at www.TradeStation.com . Before trading any asset class, customers must read the relevant risk disclosure statements on www.TradeStation.com . System access and trade placement and execution may be delayed or fail due to market volatility and volume, quote delays, system and software errors, Internet traffic, outages and other factors. Securities and futures trading is offered to self-directed customers by TradeStation Securities, Inc., a broker-dealer registered with the Securities and Exchange Commission and a futures commission merchant licensed with the Commodity Futures Trading Commission). TradeStation Securities is a member of the Financial Industry Regulatory Authority, the National Futures Association, and a number of exchanges. TradeStation Securities, Inc. and TradeStation Technologies, Inc. are each wholly owned subsidiaries of TradeStation Group, Inc., both operating, and providing products and services, under the TradeStation brand and trademark. When applying for, or purchasing, accounts, subscriptions, products and services, it is important that you know which company you will be dealing with. Visit www.TradeStation.com for further important information explaining what this means.by TradeStation1113
Liberation or Obliteration?Notice the pattern here, the last time we had a fed pivot the market went up for a couple of months and then a huge draw down. History doesn’t always repeat but it often rhymes. We are being held up by the 0.382 Fib, so we are technically still bullish believe it or now. What’s next? If the tariff issues are not resolved we will get a total melt down, the likes of which we haven’t seen before. So if you are hopeful that the tariffs will be resolved, this is an excellent opportunity to buy the dip. I was largely long gold but I have not almost exited my position, please look at my trade idea on gold which was a textbook long. Now I’m putting that cash to work and slowly buying up the best assets the market has to offer. I will add to my long term investment in the AI companies, data center and top class software names. But I’m not going all in, I’m reserving dry powder for more draw downs. For now this technical analysis suggests now is the time to be slowly deploying. Not financial advice, do what’s best for you. by NoFOMO_338
S&P500 vs Unemployment vs Yield CurveI'd be surprised if that was the bottom in equities. 10yr/2yr is still coming out of inversion which historically is followed by a recession and a decline in equities, and we have unemployment remaining stubbornly low with only one direction to go from current levels. Market selloffs usually mean investors lose money while main street loses jobs so we should start to see the unemployment rate begin to rise from here assuming that the tariff war isn't over. Trump proved today that he has no intention of relenting on the new tariffs; when China retaliated with 34% tariffs on US goods, he immediately hit them with 50% tariffs. Not sure which side will cave first, but as long as there is uncertainty around US/China trade the risk for further declines in equities remains. The previous two times the yield curve inverted, we saw 50%+ declines in equities and rising unemployment when the curve came out of inversion. There was also a short-lived inversion in 2019 with a spike in unemployment and falling equity prices due to Covid, but the Federal Reserve lowering interest rates to 0% and printing trillions of dollars kept that bear market short and sweet. We currently have a Federal Reserve that needs higher rates to fight inflation while at the same time we have a president who wants lower rates to stimulate growth. Catch-22 for the Fed: if they lower rates, they risk reigniting inflation. If they raise rates or keep them flat during a market decline it will speed up the decline in equities. Trump knows this which is why I don't think that the tariff war and market decline are over. Shortby PrepForProfit115
SPX: Market Reflexivity & Fractal PatternsIn this idea I would like to walk you through some principles which I use to find and relate historical complexities within rhyming cycles. Market Reflexivity Market reflexivity is a concept introduced by George Soros that defies the traditional TA notion of efficient markets by revealing that price movements do not merely reflect fundamentals — they actively shape them. As prices rise, optimism fuels further buying, creating a self-reinforcing loop inflating bubbles. Conversely, declining prices trigger fear, accelerating downturns. Reflexivity explains why trends persist and why reversals can be abrupt, as self-sustaining cycles eventually reach a exhaustion point. To put it simply, there is a feedback loop between market participants’ perceptions and actual market conditions, suggesting that financial markets are not always in equilibrium because collective investor behavior actively drives price movements, which in turn influences future investor behavior. Feedback Loops Each massive rally eventually creates conditions that lead to overvaluation, resulting in sharp corrections. Self-Fulfilling Expectations Market participants, reacting to past price behavior, reinforce trends until a breaking point. Structural Adaptation Every major correction resets valuations, allowing for the next cycle to begin with renewed confidence and capital inflows. Practical Application of Reflexivity Compared to many tickers, SPX has exhibited relatively stable growth throughout history. Over the past 70 years, the most significant panic-driven decline occurred after its 2007 peak, with a 57% drop that defined a major cycle. Growth resumed in 2009, making this swing a key reference point for establishing historical relationships. I see the Dotcom and Housing crisis-induced declines as part of a broader complexity, shaped by prior long-term growth. The two cycles appear as they do because they stem from an extended structural uptrend, not just the 250% surge from 1994 to the bubble top, which lacked a significant preceding decline. Cause-and-effect logic suggests that these crashes were a reaction to a much larger uptrend that began in 1974. A 2447% rally provides a more compelling reason for mass panic and selling, as corrections of such magnitude are rare. Intuitively, the 2447% long-term upswing should have been preceded by a decline similar to the Dotcom and Housing crashes. This holds true, as the market experienced a nearly 50% drop after peaking in 1973 and 37% in 1968, following the same cyclical pattern of deep corrections leading to extended expansions. These corrections were relatively smaller than the Dotcom and Housing crashes because they are followed by a comparatively smaller 1452% rally from the end of WWII. Multi-Fractals Multifractals in market analysis describe the non-linear, self-similar nature of price movements, where volatility and risk vary across different scales. Unlike simple fractals with a constant fractal dimension, multifractals exhibit multiple fractal dimensions, creating varying levels of roughness. Benoit Mandelbrot introduced multifractal Time Series to refine the classic random walk theory, recognizing that price movements occur in bursts of volatility followed by calm periods. Instead of a single Hurst exponent, markets display a spectrum of exponents, reflecting diverse scaling behaviors and explaining why price action appears random at times but reveals structured patterns over different time horizons. This justifies viewing price action within its structural cause-and-effect framework, where micro and macro cycles are interdependent, while oscillating at different frequencies. Therefore, we will apply the building blocks independently from boundaries of Full Fractal Cycle. Since volatility varies, this reserves us the right to extract patterns with identical slope and roughness, and by method of exclusion relate to recent cycles starting from covid. by fractUpdated 99115
SPX - Have we bottomed ?History often repeats itself. SPX just bounced off a key level the 2022 high and the long-term channel support which has historically triggered strong reversals (red circles), and we’re seeing the same setup again. MACD is deep in bearish territory but showing signs of flattening. Volume is elevated — likely signaling a washout or institutional accumulation. If bulls defend this level, a bounce toward the 0.5 and 0.382 Fibs (5,493 – 5,649) is on the cards. Break below 5,114 and it’s lights out again — signalling that this bounce perhaps may just have been a gap and bull trap ? I’m neutral and acting as per technical hints, waiting for signs of confirmation. Although Risk/reward is solid here if momentum shifts. Would love to hear any thoughts or different opinions. All the best as always ! by likeghostmf116
S&P 500: Valuation Correction or the Start of a Breakdown?Valuation Correction or the Start of a Breakdown? Zoom out. Clear the noise. We might still sweep the lows, but when viewed on the weekly timeframe, this current S&P 500 move looks more like a healthy valuation correction than a structural breakdown. Let’s break it down by the numbers using fractal analysis: 🟩 March 2020 (COVID Crash): ▪️~35% drop ▪️V-shaped recovery ▪️Oversold RSI bounce 🟨 2022 Bear Market: ▪️~27% correction ▪️Multi-month wedge consolidation ▪️Eventually led to an upside breakout 🟦 Now (2025): ▪️~21% correction so far ▪️Retesting long-term trendline ▪️RSI in familiar oversold zone 📊 Fractal Math: - From 35% to 27% = 22.86% decrease - From 27% to 21% = 22.22% decrease Both legs show a consistent ~22% drop in correction depth suggesting bearish momentum is weakening with each cycle. Currently bouncing off the1844 days of support. Is this the bottom? Will there be relief? 🔁 If this pattern holds: - We could see a short-term sweep or deviation under recent lows. - But structure favours a potential recovery from this zone, unless the trendline breaks decisively. 📌 Watch levels closely. Timing matters. 🧠 What’s your take, is this another “buy the dip” moment? Do hit the like button if you liked this update and share your views in the comment section.Longby Cryptorphic17
S&P500 Searching for a BottomExecutive Summary The S&P 500’s Elliott Wave structure suggests the current downtrend is incomplete, with a high-probability target near the 4,300 level based on Fibonacci retracement levels. Global stock markets remain under pressure amid ongoing tariff uncertainty, and Elliott Wave patterns across various indices continue to point to more downside. Current Elliott Wave Analysis Today’s upward volatility is likely a small-degree wave four, with another leg down expected to retest today’s lows in the coming sessions. There is an impulse wave that began in October 2022 and topped in 2025. We are now seeing the after effects of that completed rally. A standard 61.8% Fibonacci retracement of that move places a high-probability support zone around 4,300—a logical target for a ‘normal’ correction of the 2022–2025 rally. Currently, price has paused near the January 2022 high at 4,662, and also sits near the 38.2% retracement level of the 2022 rally, which lies around 4,950. While a move to new highs cannot be fully ruled out, the probability of such a rally is currently low. Given the brief nature of the current decline in both price and duration, a more meaningful correction is still likely. Bottom Line The S&P 500 appears to be in wave ((iii)) or ((c)) of a downward move, with the structure still incomplete. A decline toward 4,300 remains the higher-probability scenario in the near term. We will reconsider the medium-term outlook if the index rallies above 5,488, which would overlap the March 31 low and suggest a possible low is in place.Shortby JWagnerFXTrader114
Nasdaq and S&p500 short: Completion of B waveI mentioned in my previous analysis that we are waiting for a short (the previous one was a long-then-short linked with this idea). I did not post any short idea yesterday after that NOT because I am good and recognize a double combination. It's really because I was too busy with work and I am glad my last was a long-then-short. Back to this, remember that the huge volatility has caused the points in the chart to compress and thus even though the stop loss looks small, it is actually still quite a number of points away. So my suggestion is to manage your size and keep it small relative to your account. Good luck!Short02:44by yuchaosngUpdated 443
Bear With Me: When AI Spending disturbs the hibernationSpent too much time coding and cycling today, so no time for a video. Now we know for sure: it was a deeper correction, and it’s indeed too close to a bear market to be ignored. What's next? I think the tariff war merely anticipated something that was bound to happen sooner or later: the AI bubble burst. For me, that explains why the NASDAQ entered the bear market first. Big tech was very bold in announcing billions of dollars in AI spending, yet many investors—mostly clueless about what this means for future growth—weren’t ready to accept it. However, the Trump maneuver isn’t straightforward and could lead to real complications. Without diving into macro analysis (which I admit is beyond my expertise), here are some scenarios derived from the chart: A – We bounce off the confluence of two major supports: the ascending wedge, the lateral from the 2021/2022 top, and the AVWAP anchored there. It’s a real possibility that we could simply bounce from here and reach a new ATH. However, even in this scenario, I doubt we’ll see the sun before the dark. The AI bubble has to burst before the real winners in that race can show their value. So, we may experience a blow-off top, only to return to bear market territory—possibly by the end of the year or next year. B – We lose this critical support and head for the hills. C – We bounce off the next level down and march back up (very unlikely, in my opinion). D – We complete a bear market with over a 50% correction. The downside could be harsh, with many whipsaws and false hopes along the way. I’ve never been this bearish in my life. Yet, I remain very bullish on AI. I’m at least 10x more productive with AI, and I believe everyone will be—and so will every company making the right moves. That will create amazing opportunities for traders. But until then… brace yourself.by marsrides2210
Update about my previous warning about a crash of the SPX500📉 SPX500 Major Correction: Scenario 1 or 2? In my previous analysis, I explained a scenario that could mimic the 2022 crash (Scenario 1): 🔗 However, the price action dropped much faster than in 2022, accelerating the correction. Now, on the daily timeframe, we already have a bullish MACD crossover, signaling a potential bullish trend for several days: 🔗 Could This Invalidate the Bearish Trend? ✅ Yes, absolutely. In June 2023 (Scenario 2), a similar situation occurred: A bearish MACD reset was interrupted mid-course by a violent dump This triggered a strong rebound, breaking through resistance levels There are now strong signs that Scenario 2 might play out again. What Does This Mean for Crypto & TradFi? 📈 If this bullish reversal holds, it could sync Crypto & TradFi, with both gaining bullish momentum on the weekly timeframe, peaking around May 2025. Two Possible Outcomes: 1️⃣ Scenario 1 – The reversal collapses, and the correction continues 📉 2️⃣ Scenario 2 – The reversal holds, leading to a rally 📈 Let’s monitor this closely to see which scenario unfolds. 🔍 DYOR! #SPX500 #StockMarket #Crypto #Trading #BullishReversal #BearishTrend #MACD #MarketAnalysis #Investingby CryptoNikkoidUpdated 171720
SPX 1D 200 EMA Retest? As the 9&21W EMAs cross and a new local low printing after a SFP top, could the S&P500 be getting its first major correction since Jan 2022? From a TA standpoint this kind of setup looks to be high probability with good R:R for the bears. Targeting the 1W 200 EMA is the most logical area as it remains major support and whenever tested holds strong. From a bulls standpoint this is worrying but could be rectified with a reclaim of the 9&21 EMAs preventing a "death cross" from there acceptance above the high would be the next step to maintain the rally. Fundamentals play a major role and the geopolitical world shows no signs of slowing down, perhaps the tariffs angle is introducing uncertainty in American companies? Or the index is just exhausted from 2.5 years of climbing? Either way the chart is an interesting one to monitor for now. by ProR35Updated 664
S&P 500 Index: First Correction Since July 2023I was just looking at NVDA and the market has been bullish forever. A drop is approaching and I wondered, "Will this be a short lived correction or will it turn into a bear-market?" Good question isn't it? The last correction for the SPX happened between July and October 2023, after that, it has been 100% bullish with some retraces lasting a maximum of three weeks. So it is hard to think of a bear-market. From January 2022 through October 2022 the SPX entered a strong correction, a bear-market, it lasted 280 days. There you have it. How would that look like today? Let's see... Ten months would put us at August/September 2025, can you imagine? These markets are super resilient, and with money printing going on over-drive soon, it is possible that we only experience a correction. A correction can last several weeks to a few months maximum. Big correction or small correction, three weeks or ten months, the SPX is bearish and pointing lower in the coming days, weeks and months. Namaste.Shortby MasterAnandaUpdated 3338
VIX Hits 27-Year Extreme. Is the Market About to CRASH or SOAR?The Volatility Index (VIX displayed by the blue trend-line) has entered a level that has visited only another 5 times in the last 27 years (since August 1998)! That is what we've called the 'VIX Max Panic Resistance Zone'. As the name suggests that indicates ultimate panic for the stock markets, which was fueled by massive sell-offs, leading to extreme volatility and uncertainty. So the obvious question arises: 'Is this Good or Bad for the market??' The answer is pretty clear if you look at the chart objectively and with a clear perspective. In 4 out of those 5 times, the S&P500 (SPX) bottomed exactly on the month of the VIX Max Panic signal. It was only during the 2008 U.S. Housing Crisis that VIX hit the Max Panic Zone in October 2008 but bottomed 5 months late in March 2009. As a result, this is historically a very strong opportunity for a multi-year buy position. If anything, today's VIX situation looks more similar to September 2011 or even the bottom of the previous U.S. - China Trade war in March 2020. ------------------------------------------------------------------------------- ** Please LIKE 👍, FOLLOW ✅, SHARE 🙌 and COMMENT ✍ if you enjoy this idea! Also share your ideas and charts in the comments section below! This is best way to keep it relevant, support us, keep the content here free and allow the idea to reach as many people as possible. ** ------------------------------------------------------------------------------- 💸💸💸💸💸💸 👇 👇 👇 👇 👇 👇Longby TradingShot19
SPX500 eyes on 5668: Key Resistance before Trump Tariff newsSPX500 might be in "sell the rumor, buy the news" mode. But the bounce has just hit a major fib (of its Covid wave). If the news is bearish, this would be a perfect top to drop. =================================================== by EuroMotifUpdated 226